. 2024 Dec;56(1):2425064.
doi: 10.1080/07853890.2024.2425064. Epub 2024 Nov 18.

Identification of copper metabolism-related markers in Parkinson's disease

Affiliations

Identification of copper metabolism-related markers in Parkinson's disease

Jie Lin et al. Ann Med. 2024 Dec.

Abstract

Objectives: This study aimed to identify key genes related to copper metabolism in Parkinson's disease (PD), providing insight into their roles in disease progression.

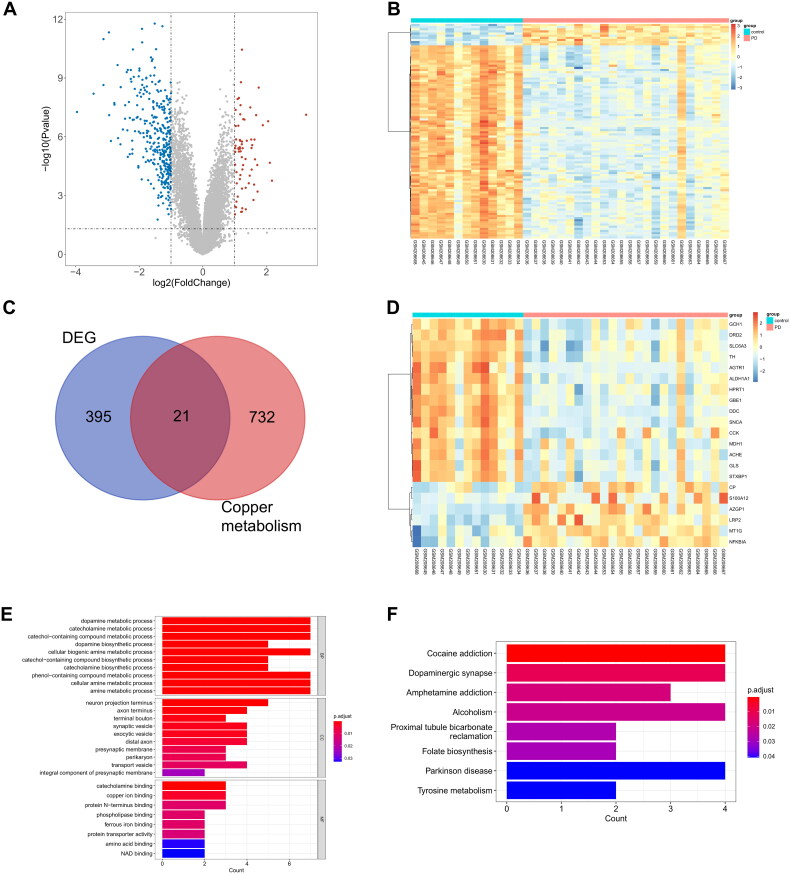
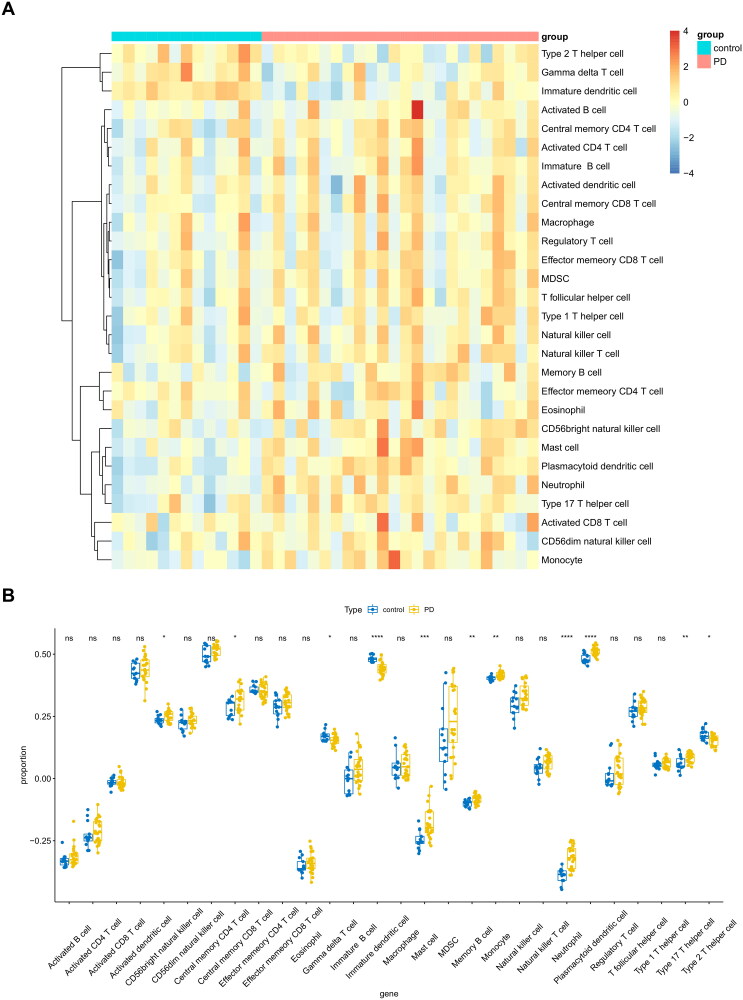
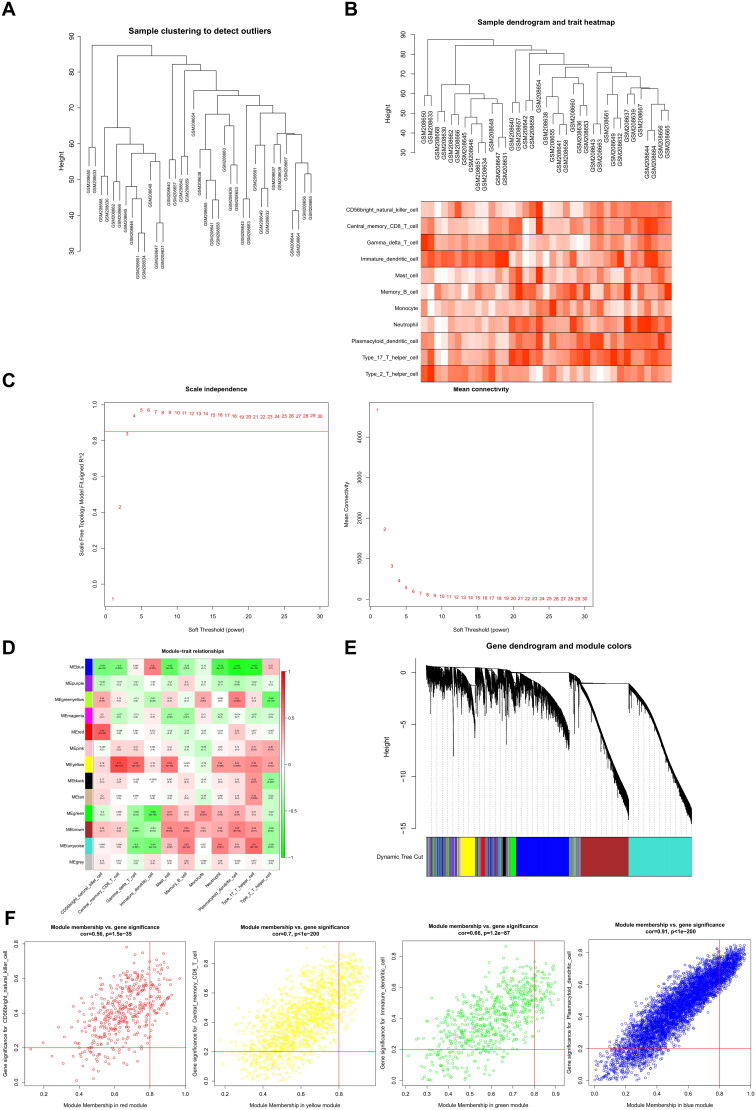
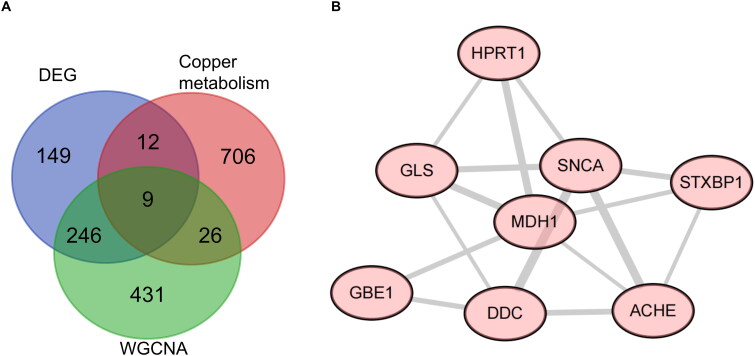
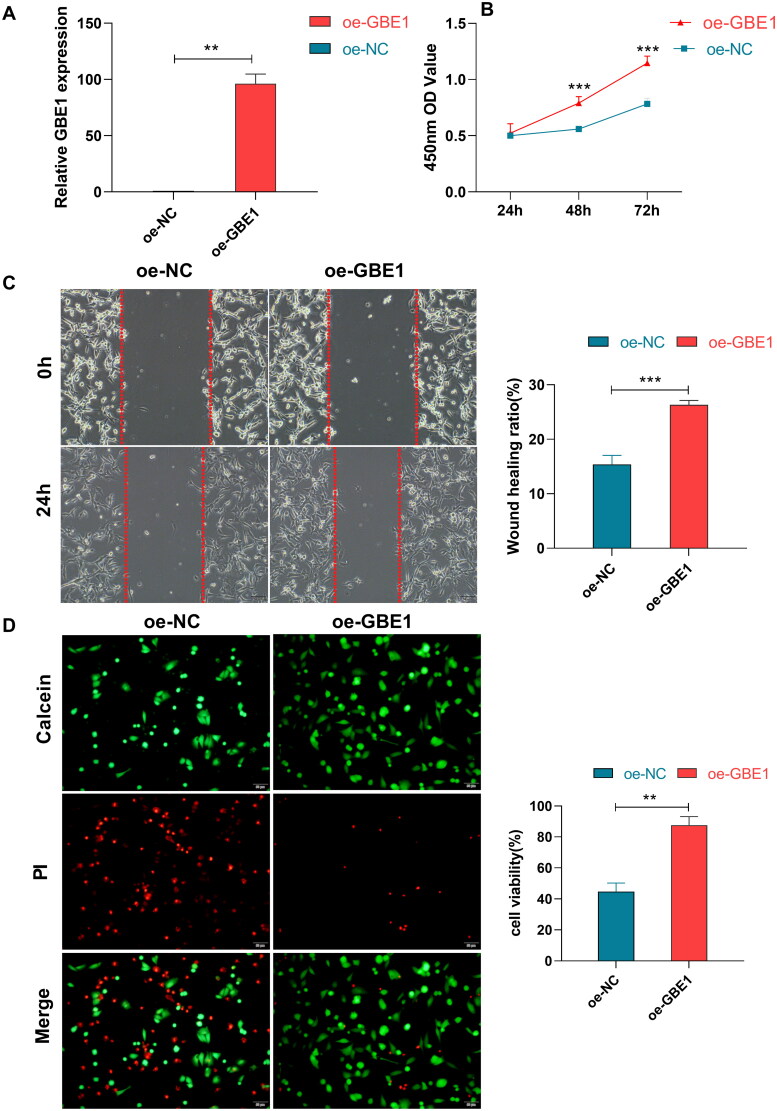
Methods: Using bioinformatic analyses, the study identified hub genes related to copper metabolism in PD patients. Differentially expressed genes (DEGs) were identified using the limma package, and copper-metabolism-related genes (CMRGs) were sourced from the Genecard database. Immune cell-related genes were derived through immune infiltration and Weighted Gene Co-expression Network Analysis (WGCNA). Hub genes were pinpointed by integrating DEGs, CMRGs, and immune cell-related genes. Functional analyses included Receiver Operating Characteristic (ROC) analysis, Ingenuity Pathway Analysis (IPA), and networks for miRNA-mRNA-transcription factor (TF), Competitive Endogenous RNA (ceRNA), and hub gene-drug interactions. Validation was performed in cerebrospinal fluid (CSF) samples from PD patients, while in vitro experiments utilized GBE1- overexpressing SH-SY5Y cells to examine cell proliferation, migration, and viability.

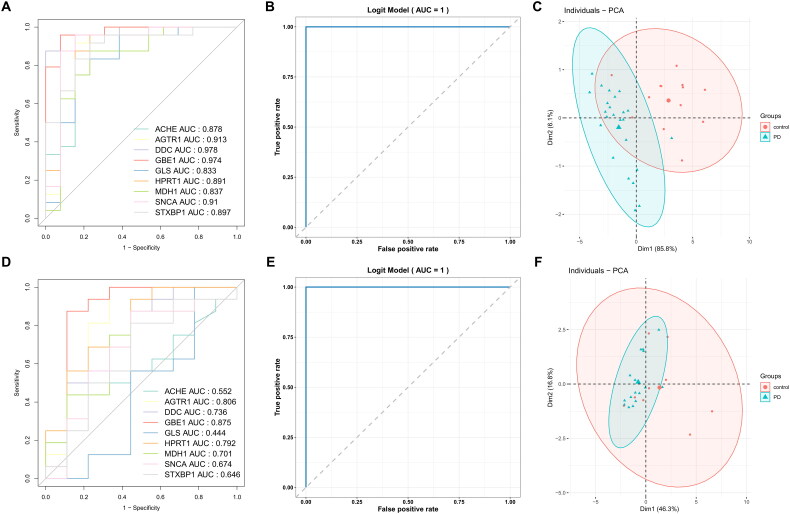
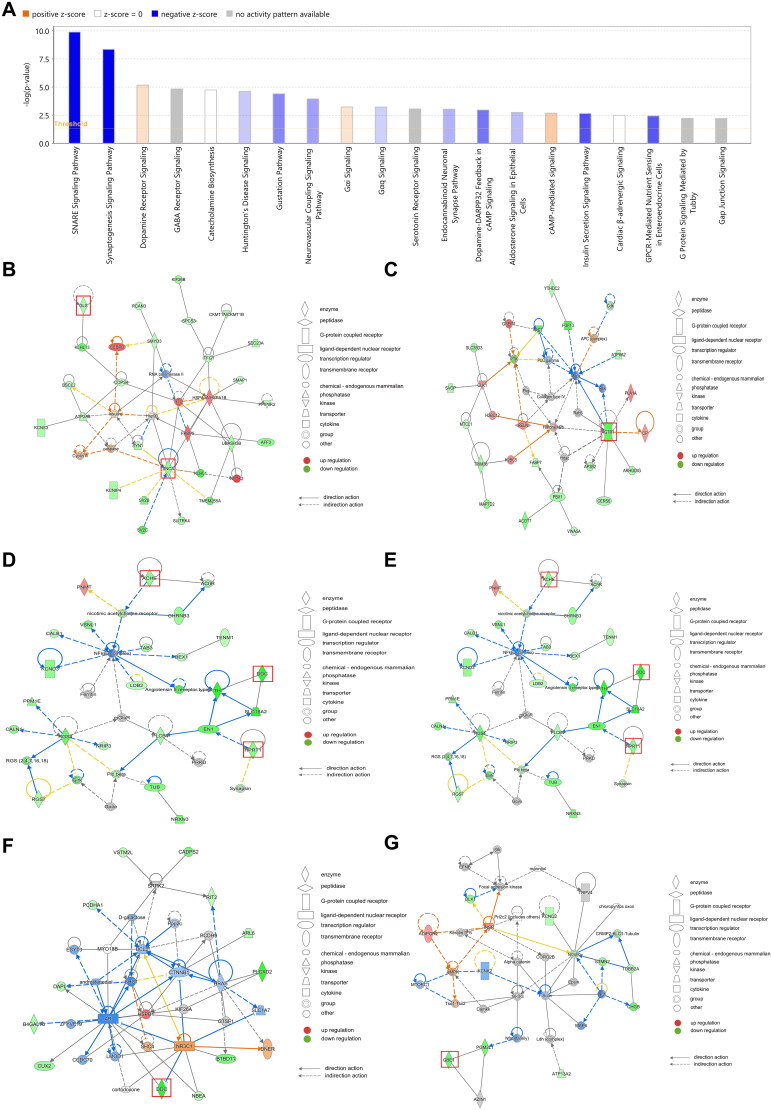
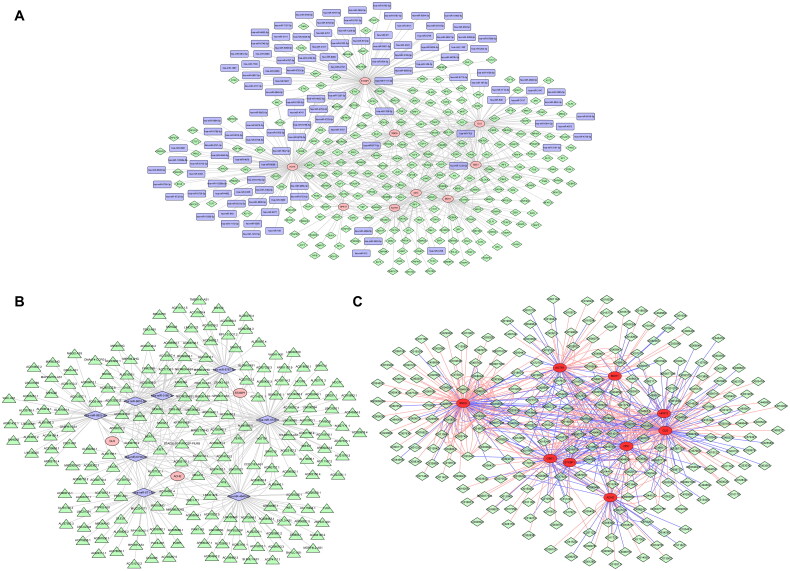
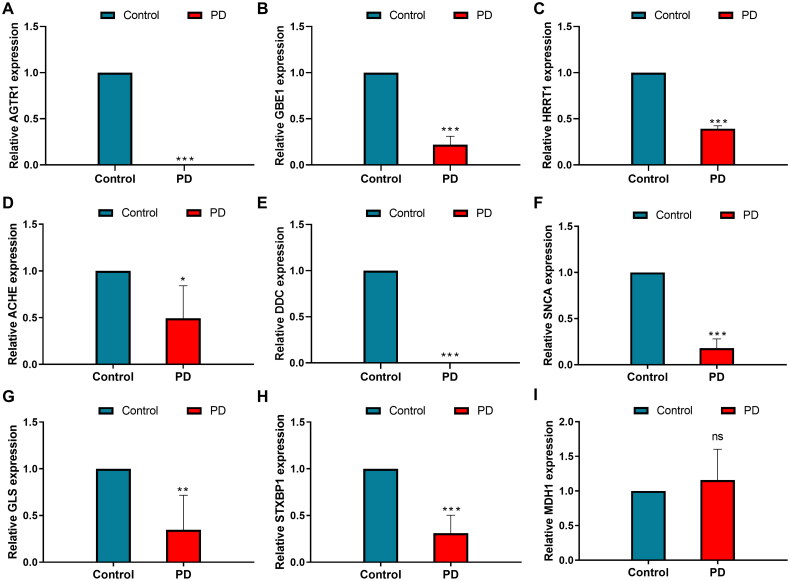
Results: Nine hub genes (HPRT1, GLS, SNCA, MDH1, GBE1, DDC, STXBP1, ACHE, and AGTR1) were identified from 753 CMRGs, 416 DEGs, and 951 immune cell-related genes. ROC analysis showed high predictive accuracy for PD, and principal component analysis (PCA) effectively distinguished PD patients from controls. IPA identified 20 significant pathways, and various networks highlighted miRNA, TF, and drug interactions with the hub genes. Hub gene expression was validated in PD CSF samples. GBE1-overexpressing cells displayed enhanced proliferation, migration, and viability.

Conclusions: The study identified nine copper metabolism-related genes as potential therapeutic targets in PD, highlighting their relevance in PD pathology and possible treatment pathways.

Keywords: GBE1; Parkinson’s disease; biomarker; copper metabolism; hub genes.


Conflict of interest statement

No potential conflict of interest was reported by the author(s).

Figures

Figure 1.
Figure 1.
Identification of 21 DE CMRGs. (A) Volcano plots showing 416 DEGs in total between control and PD groups in the GSE8397 dataset, red dots indicate up-regulation and blue dots indicate down-regulation. (B) Heat map of the expression of DEGs. (C) Venn diagram of 21 DE CMRGs by comparison between DEGs and CMRGs; (D) Heat map of the expression of 21 DE CMRGs. (E) GO analysis of 21 DE CMRGs. Y-axis represents the enriched GO terms; X -axis represents the amounts of genes enriched in GO terms. (F) KEGG pathway analysis of 21 DE CMRGs. Y-axis represents the KEGG signaling pathways. X-axis represents amounts of genes enriched in KEGG pathways.
Figure 2.
Figure 2.
Analysis of 28 immune cell infiltration according to ssGSEA (A) Heat map of the abundance of 28 immune cell types. Each square in each row represents each sample. The color of square represents p value. Each column represents the amount of 28 cell types in each sample. (B) Box plot of the percentage of 28 immune cell types between PD and control samples.
Figure 3.
Figure 3.
Detection of immune cell-related genes in GSE8397 dataset. (A) Sample clustering dendrogram. (B) Clustering dendrogram of samples with trait heatmap. (C) Analysis of network topology for various soft-thresholding powers. The left panel shows the scale-free fit index (y-axis) as a function of the soft-thresholding power (x-axis). The right panel displays the mean connectivity (degree, y-axis) as a function of the soft-thresholding power (x-axis). (D) Dendrogram of all samples clustered based on the measurement of dissimilarity (1-TOM). (E) Heatmap of the correlation between the module eigengenes and immune features of PD. (F) Royalblue module, black module, darkgrey module, and green module were identified to have the highest correlations with PD-related immune features.
Figure 4.
Figure 4.
Confirmation of hub genes. (A) Venn diagram of nine hub genes by comparison of immune cell-related genes, DEGs and CMRGs. (B) Protein-protein interaction network of hub genes (HRPT1, GLS, SNCA, MDH1, STXBP1, ACHE, DDC and GBE1).
Figure 5.
Figure 5.
Evaluation and verification of the diagnostic values of the nine hub genes. (A) ROC curves of nine hub genes in the GSE8397 dataset. (B) ROC curve of the diagnostic model in GSE8397 dataset. (C) Principal component analysis (PCA) on PD and control samples from the GSE8397 dataset based on nine hub genes. (D) ROC curves of nine hub genes in the GSE7621 dataset. (E) ROC curve of the diagnostic model in GSE7621 dataset. (F) PCA on PD and control samples from the GSE7621 dataset based on nine hub genes.
Figure 6.
Figure 6.
Single gene GSEA. Merged KEGG pathways enriched for nine hub genes using GSEA enrichment analysis.
Figure 7.
Figure 7.
IPA of hub genes from the GSE8397 dataset. (A) Diseases and functional pathway analysis of nine hub genes. While the Y-axis is the pathway terms, the X-axis is the log (p-value). (B) Interaction network was constructed between hub genes (SNCA and GLS) by using IPA. (C) Interaction network was constructed for gene AGTR1 by using IPA. (D) Interaction network was constructed between hub genes (ACHE, DDC, and HPRT1) by using IPA. (E) Interaction network was constructed between hub genes (MDH1 and DDC) by using IPA. (F) Interaction network was constructed for gene DDC by using IPA. (G) Interaction network was constructed for gene GBE1 by using IPA. Solid lines indicate direct action, dashed lines indicate indirect action.
Figure 8.
Figure 8.
Development of miRNA-mRNA-TF network, ceRNA network, and gene-drug network (A) a miRNA-mRNA-TF network with 635 edges based on nine hub genes, 122 miRNAs, and 243 TFs. (B) a mRNA-miRNA-lncRNA network with 225 edges based on three hub genes, eight lncRNAs, and 214 miRNAs. (C) gene-drug network with 641 edges based on nine hub genes and 261 drugs.
Figure 9.
Figure 9.
Validation of the expression levels of nine hub genes by qRT-PCR. (A) AGTR1. (B) MDH1. (C) GBE1. (D) HRRT1. (E) ACHE. (F) SNCA. (G) DDC. (H) GLS. (I) STXBP1.
Figure 10.
Figure 10.
Functional analysis of GBE1 gene in SH-SY5Y cells (A)the qRT-PCR assay showed over-expression of GBE1 in the oe-GBE1 group; (B)The CCK-8 test showed higher cell proliferation in the oe-GBE1 group compared to the oe-NC group; (C)The Wound Healing assay indicated an increase in cell migration in the oe-GBE1 group compared to the oe-NC group; (D) Live/dead staining showed increased cell viability in theoe-GBE1 group compared to the oe-NC group. **, *** respectively represent P-value less than 0.01, less than 0.001.

Similar articles

Cited by

References

    1. Braak H, Del Tredici K, Rüb U, et al. . Staging of brain pathology related to sporadic Parkinson’s disease. Neurobiol Aging. 2003;24(2):197–211. doi: 10.1016/s0197-4580(02)00065-9. - DOI - PubMed
    1. Chaudhuri KR, Healy DG, Schapira AH.. Non-motor symptoms of Parkinson’s disease: diagnosis and management. Lancet Neurol. 2006;5(3):235–245. doi: 10.1016/s1474-4422(06)70373-8. - DOI - PubMed
    1. Dorsey ER, Constantinescu R, Thompson JP, et al. . Projected number of people with Parkinson disease in the most populous nations, 2005 through 2030. Neurology. 2007;68(5):384–386. doi: 10.1212/01.wnl.0000247740.47667.03. - DOI - PubMed
    1. Dawson TM, Dawson VL.. Molecular pathways of neurodegeneration in Parkinson’s disease. Science. 2003;302(5646):819–822. doi: 10.1126/science.1087753. - DOI - PubMed
    1. Guo H, Wang Y, Cui H, et al. . Copper induces spleen damage through modulation of oxidative stress, apoptosis, DNA damage, and inflammation. Biol Trace Elem Res. 2022;200(2):669–677. doi: 10.1007/s12011-021-02672-8. - DOI - PubMed