

High-altitude environments enhance the ability of Eothenomys miletus to regulate body mass during food limitation, with a focus on gut microorganisms and physiological markers
- PMID: 39552642
- PMCID: PMC11565053
- DOI: 10.3389/fmicb.2024.1499028
High-altitude environments enhance the ability of Eothenomys miletus to regulate body mass during food limitation, with a focus on gut microorganisms and physiological markers
Abstract
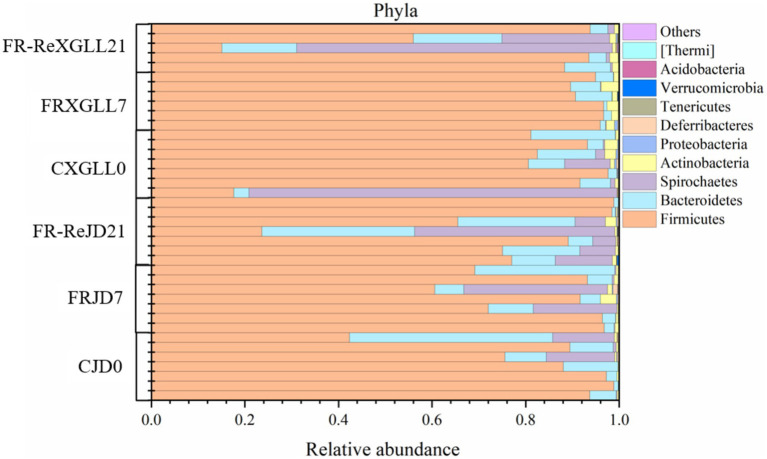
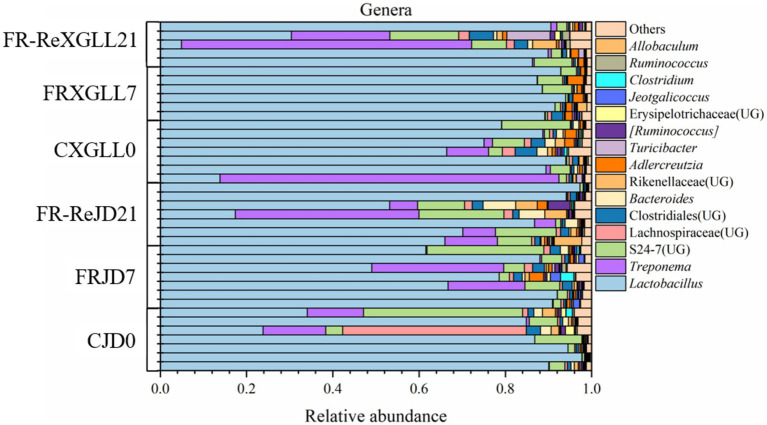
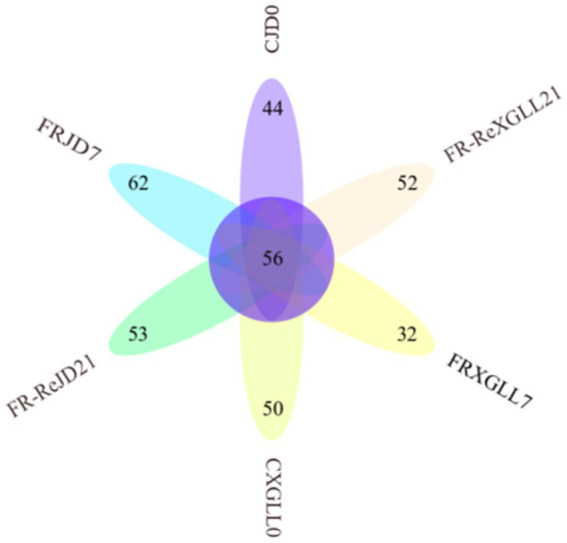
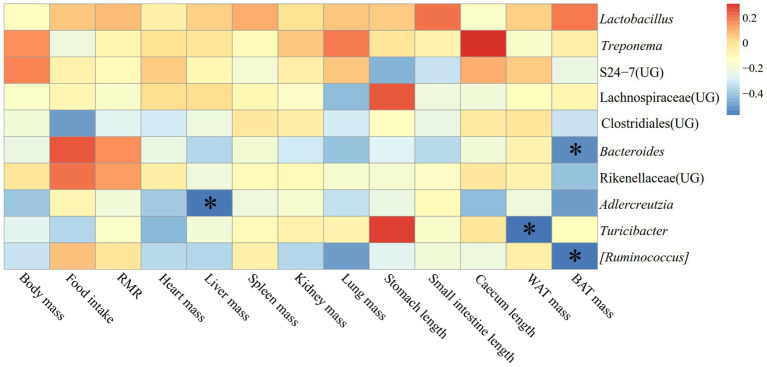
Animals' digestion, energy metabolism, and immunity are significantly influenced by interactions between the gut microbiota and the intestinal environment of the host. Previous studies have shown that gut microbiota of Eothenomys miletus can respond to environmental changes, high fiber or fat foods. But how E. miletus in high-altitude adapt to their environment through gut microbiota and physiological changes during winter food shortages period was unclear. In the present study, we evaluated the altitude differences in gut microbiota and their interactions with physiology in terms of body mass regulation in order to study the adaptation of the gut microbiota and physiological indicators of the E. miletus under food restriction settings. E. miletus were collected for this study from Jingdong County (JD, low-altitude) and Xianggelila County (XGLL, high-altitude) in Yunnan Province, China, and split into three groups: control group, food-restricted feeding group for 7 days, and re-feeding group was offered a standard diet for 14 days. 16S rRNA gene sequencing and physiological methods were used to analyze the abundance and community structure of gut microbiota, as well as physiological indicators of each group in E. miletus. The results showed that while the RMR changed more during the period of food restriction, the body mass and major organ masses of E. miletus from high-altitude changed less. After food restriction, RMR in XGLL decreased by 25.25%, while that of in JD decreased by 16.54%. E. miletus from the XGLL had gut bacteria that were more abundant in Firmicutes and had fewer OTUs, and the microbiota had a closer interaction with physiological indicators. Moreover, the gut microbiota adapted to the food shortage environment by enhancing the genera of Bacterroides, Ruminococcus, Turicibacter, and Treponema to improve the utilization of nutrient resources. The interactions between microbial species and the equilibrium of energy homeostasis were further impacted by alterations in physiological indicators and microbial community structure. These variations were important for E. miletus to adapt to the fluctuations and changes of food resources in high-altitude region, which also expand our knowledge of organismal adaptations and the mechanisms behind the interactions between gut bacteria and host physiology.
Keywords: Eothenomys miletus; adaptation; food restriction; gut microbiota; high altitude.
Copyright © 2024 Zhang, Jia, Zhu and Fan.
Conflict of interest statement
The authors declare that the research was conducted in the absence of any commercial or financial relationships that could be construed as a potential conflict of interest. The author(s) declared that they were an editorial board member of Frontiers, at the time of submission. This had no impact on the peer review process and the final decision.
Figures


Similar articles
-
Intermittent fasting driven different adaptive strategies in Eothenomys miletus (Red-backed vole) at different altitudes: based on the patterns of variations in intestinal microbiota.BMC Microbiol. 2025 Mar 31;25(1):185. doi: 10.1186/s12866-025-03934-4. BMC Microbiol. 2025. PMID: 40165055 Free PMC article.
-
Comparative analysis of energy homeostasis regulation at different altitudes in Hengduan Mountain of red-backed vole, Eothenomys miletus, during high-fat diet acclimation: examining gut microbial and physiological interactions.Front Microbiol. 2024 Jul 10;15:1434346. doi: 10.3389/fmicb.2024.1434346. eCollection 2024. Front Microbiol. 2024. PMID: 39050639 Free PMC article.
-
Effects of high-fiber food on gut microbiology and energy metabolism in Eothenomys miletus at different altitudes.Front Microbiol. 2023 Aug 31;14:1264109. doi: 10.3389/fmicb.2023.1264109. eCollection 2023. Front Microbiol. 2023. PMID: 37727288 Free PMC article.
-
Gut Microbiota as the Potential Mechanism to Mediate Drug Metabolism Under High-altitude Hypoxia.Curr Drug Metab. 2022;23(1):8-20. doi: 10.2174/1389200223666220128141038. Curr Drug Metab. 2022. PMID: 35088664 Review.
-
Yak Gut Microbiota: A Systematic Review and Meta-Analysis.Front Vet Sci. 2022 Jun 28;9:889594. doi: 10.3389/fvets.2022.889594. eCollection 2022. Front Vet Sci. 2022. PMID: 35836500 Free PMC article.
Cited by
-
Intranasal Administration of Acetaminophen-Loaded Poly(lactic-co-glycolic acid) Nanoparticles Increases Pain Threshold in Mice Rapidly Entering High Altitudes.Pharmaceutics. 2025 Mar 6;17(3):341. doi: 10.3390/pharmaceutics17030341. Pharmaceutics. 2025. PMID: 40143005 Free PMC article.
-
Intermittent fasting driven different adaptive strategies in Eothenomys miletus (Red-backed vole) at different altitudes: based on the patterns of variations in intestinal microbiota.BMC Microbiol. 2025 Mar 31;25(1):185. doi: 10.1186/s12866-025-03934-4. BMC Microbiol. 2025. PMID: 40165055 Free PMC article.
References
Associated data
LinkOut - more resources
Full Text Sources