

Walking fingerprinting
- PMID: 39552748
- PMCID: PMC11561731
- DOI: 10.1093/jrsssc/qlae033
Walking fingerprinting
Abstract
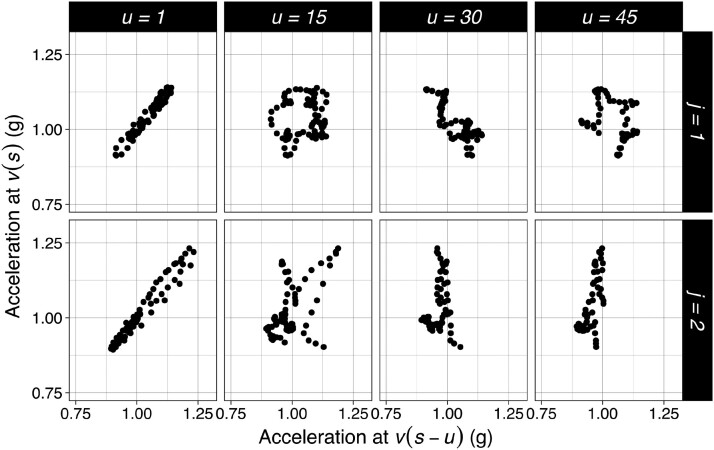
We consider the problem of predicting an individual's identity from accelerometry data collected during walking. In a previous paper, we transformed the accelerometry time series into an image by constructing the joint distribution of the acceleration and lagged acceleration for a vector of lags. Predictors derived by partitioning this image into grid cells were used in logistic regression to predict individuals. Here, we (a) implement machine learning methods for prediction using the grid cell-derived predictors; (b) derive inferential methods to screen for the most predictive grid cells while adjusting for correlation and multiple comparisons; and (c) develop a novel multivariate functional regression model that avoids partitioning the predictor space. Prediction methods are compared on two open source acceleometry data sets collected from: (a) 32 individuals walking on a km path; and (b) six repetitions of walking on a 20 m path on two occasions at least 1 week apart for 153 study participants. In the 32-individual study, all methods achieve at least 95% rank-1 accuracy, while in the 153-individual study, accuracy varies from 41% to 98%, depending on the method and prediction task. Methods provide insights into why some individuals are easier to predict than others.
Keywords: accelerometry; biometrics; functional data.
© The Royal Statistical Society 2024. All rights reserved. For commercial re-use, please contact reprints@oup.com for reprints and translation rights for reprints. All other permissions can be obtained through our RightsLink service via the Permissions link on the article page on our site—for further information please contact journals.permissions@oup.com.
Conflict of interest statement
Conflicts of interest: Ciprian Crainiceanu is consulting for Bayer and Johnson and Johnson on methods development for wearable and implantable technologies. The details of these contracts are disclosed through the Johns Hopkins University eDisclose system. The research presented here is not related to and was not supported by this consulting work.
Figures


References
-
- Bours P., & Shrestha R. (2010). Eigensteps: A giant leap for gait recognition. In 2010 2nd International Workshop on Security and Communication Networks (IWSCN) (pp. 1–6). IEEE.
-
- Chellappa R., Veeraraghavan A., & Ramanathan N. (2009). Gait Biometrics, Overview. In (pp. 628–633). Springer US.
-
- Chen T., & Guestrin C. (2016). XGBoost. In Proceedings of the 22nd ACM SIGKDD International Conference on Knowledge Discovery and Data Mining. ACM.
-
- Chipman H. A., George E. I., & McCulloch R. E. (2010). BART: Bayesian additive regression trees. The Annals of Applied Statistics, 4(1), 266–298. 10.1214/09-AOAS285 - DOI
Grants and funding
LinkOut - more resources
Full Text Sources