. 2024 Oct 25;10(21):e39843.
doi: 10.1016/j.heliyon.2024.e39843. eCollection 2024 Nov 15.

The effect of fibroblast growth factor 2 on neovascular vessels depends on the stage of angiogenesis

Affiliations

The effect of fibroblast growth factor 2 on neovascular vessels depends on the stage of angiogenesis

Yuki Hattori et al. Heliyon. .

Abstract

Objective: The exact relationship between fibroblast growth factor 2 (FGF2) and choroidal neovascularization (CNV) remains unclear. In this study, using optical coherence tomography angiography (OCTA) and FGF2-tg mice which are transgenic mice with a rhodopsin promoter/FGF2 gene fusion, we aimed to investigate the dynamics of FGF2's role in angiogenesis over time.

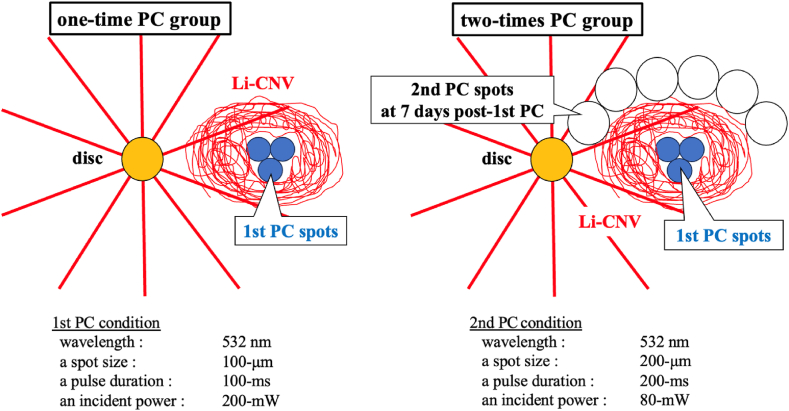
Methods: We developed laser-induced CNV models of FGF2-tg and wild-type (WT) mice and then separated them into two groups using different laser photocoagulation (PC) conditions. The first group received 3 intense PC shots (1st PC) altogether (one-time PC group), while the other group received 3 intense PC shots (1st PC) followed by 6 additional weak PC shots (2 nd PC) on the 7th day after 1st PC (two-times PC group).

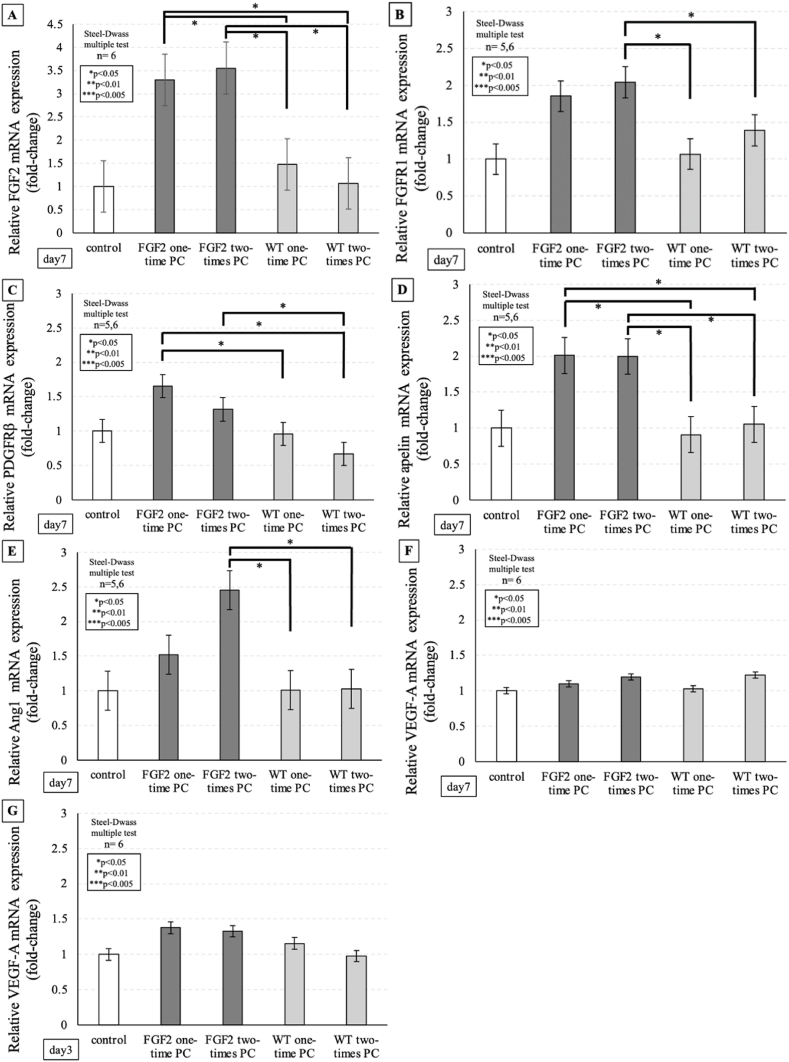
Results: Using OCTA to observe vessel changes within the same individual over time, there was no difference in the timing of vessel transition from the CNV development phase to the CNV regression phase between FGF2-tg and WT mice in the one-time PC group. In contrast, the neovascular vessels in the two-times PC group of FGF2-tg mice were maintained at least 28 days post-2nd PC without regression. In addition, mature vessels surrounded by PDGFRβ positive pericytes and α-SMA positive smooth muscle cells were observed. Real-time qPCR showed a substantial increase in apelin mRNA expression in the one-time PC group of FGF2-tg, rather than VEGF-A (p < 0.05, n = 5 or 6). Moreover, the expression levels of PDGFRβ, apelin, and Ang1 were significantly higher in FGF2-tg mice of two-times PC group than in WT mice (p < 0.05, n = 5 or 6).

Conclusions: FGF2 not only promotes neovascularization via the apelin/APJ system, which is independent of VEGF signaling pathway, but also helps maintain and stabilize pre-existing neovascular vessels by stimulating PDGFRβ and Ang1. The effect of FGF2 on the neovascular vessels depends on the stage of angiogenesis.

Keywords: Ang1; Apelin; FGF2; Intravitreal anti-VEGF treatment; OCTA; PDGFRβ; Vessels maturation.


Conflict of interest statement

The authors declare that they have no known competing financial interests or personal relationships that could have appeared to influence the work reported in this paper.

Figures

Fig. 1
Fig. 1
Schematic map of the rhodopsin/FGF2 fusion gene [9] and immunolabeled imaging of the retinal frozen section of FGF2-tg. A: Schematic map of the rhodopsin/FGF2 fusion gene. The bovine rhodopsin promoter is the previously described −2174 to +70 fragment. The FGF2 fragment extends from +84 to +1018 of the FGF2 gene with translation start sites at +280, +322, and +445 and the stop codon at +910 to +912. The oligonucleotide primers used to screen genomic DNA for the presence of the transgene are shown as P1 and P2. The primers used for RT-PCR are shown as P3 and P2. The transcription start site is indicated by +1 [9]. B: A frozen section of FGF2-tg mouse immunolabeled with anti-human FGF2 antibody (center). The left slide shows nuclei immunolabeled with DAPI from the same specimen. The right slide shows a merged view of the left two slides, showing that FGF2 is mainly localized in the outer nuclear layer of the retina. Scale bar = 200 μm.
Fig. 2
Fig. 2
Schematic figure of Li-CNV models, Left figure: One-time PC group mice receive 3 intense PC shots altogether (1st PC, drawn as blue circles). After 1st PC, Li-CNV gradually developed around the 1st PC spots (drawn as red circular nest). Right figure: Two-times PC group mice receive 3 intense PC shots followed by 6 additional weak PC shots (2 nd PC, drawn as white circles) around existing Li-CNV on the 7th day of 1st PC. The laser conditions for 1st and 2 nd PC are shown below the two figures.
Fig. 3
Fig. 3
One-time PC group of FGF2-tg and WT mice at 7 days post-1st PC. A: Left is OCTA imaging in one-time PC group of WT mouse at 7 days post-1st PC. Li-CNV was observed as a highly signaled lesion. Right is Li-CNV of the same mouse as the left figure and was immunolabeled with anti-rat CD31 antibody (green). Scale bar = 100 μm B: Left is OCTA imaging in one-time PC group of FGF2-tg mouse at 7 days post-1st PC. Compared to A figures, Li-CNV shows a more clearly defined highly signaled lesion and seems larger in size. Right is Li-CNV of the same mouse as shown in the left figure and immunolabeled with anti-rat CD31 antibody (green). Scale bar = 100 μm C: This figure represents the time-course change in Li-CNV size in FGF2-tg and WT mice. At day 3, 7, and 14 post-1st PC, the size of Li-CNV in FGF2-tg mice were significantly larger than that in WT mice on the same days. In contrast, there were no differences in the size of Li-CNV at day 21 and 28 post-1st PC between FGF2-tg and WT mice. Additionally, the size of Li-CNV in FGF2-tg mice at day 7 post-1st PC was significantly larger than that in FGF2-tg mice at day 3 post-1st PC. (FGF2-tg mice: n = 6, WT mice: n = 6, respectively).
Fig. 4
Fig. 4
Immunolabeled imaging. A) a) OCTA imaging is Li-CNV in two-times PC group of FGF2-tg mouse at 7 days post-1st PC. The white circle indicated to 1st PC area. Scale bar = 100 μm b, c) Comparison of OCTA and immunolabeled imaging using anti-rat CD31 antibody (green) from same mouse at 28 days post-2nd PC. Li-CNV enlarged toward to 2 nd PC area (yellow circle). Scale bar = 100 μm d)A flat-mounted choroid preparation from of the same mouse as shown in the figure Bb) and Bc) immunolabeled with anti-mouse α-SMA antibody (red). New vessels branching toward to 2 nd PC area surrounded α-SMA positive smooth muscle cells were observed. A α-SMA detected smooth muscle cells and RPE cell activity. Scale bar = 100 μm. B) a) OCTA imaging is Li-CNV in two-times PC group of WT mouse at 7 days post-1st PC. The white circle indicated to 1st PC area. Scale bar = 100 μm b, c) Comparison of OCTA and immunolabeled imaging using anti-rat CD31 antibody (green) from same mouse at 7 days post-2nd PC. Li-CNV enlarged toward to 2 nd PC area (yellow circle). Scale bar = 100 μm d) A flat-mounted choroid preparation from of the same mouse as shown in the figure Cb) and Cc) immunolabeled with anti-mouse α-SMA antibody (red). In contrast to figure Bd), no vessels surrounded α-SMA positive smooth muscle cells were observed. A α-SMA detected smooth muscle cells and RPE cell activity. Scale bar = 100 μm. C) These figures illustrate the time-course changes in Li-CNV in two-times PC group of FGF2-tg mice, as observed through immunolabeled imaging of flat-mounted choroidal preparations using from different FGF2-tg mice. Around 3 days post-2nd PC, new vascular networks developed from the existing Li-CNV in the 1st PC area (yellow circle) instead of the 2 nd PC area (white circle), and then, neovascular vessels extended toward the 2 nd PC area by 7 days post-2nd PC. Scale bar = 100 μm. D) A frozen section from two-times PC group of FGF2-tg mouse at 7 days post-2nd PC was immunolabeled with anti-rabbit PDGFRβ antibody (green), anti-mouse α-SMA (red) antibody, and DAPI (blue). White arrows indicate 1st PC spots. White arrowheads indicate 2 nd PC spots. Li-CNV separated two areas, one is developed Li-CNV after 1st PC (left side from dotted line) and another is newly enlarged Li-CNV after 2 nd PC (right side from dotted line). Vessels surrounded by PDGFRβ positive pericytes and α-SMA positive smooth muscle cells (yellow arrows) were observed in newly enlarged Li-CNV after 2 nd PC. Scale bar = 500 μm.
Fig. 5
Fig. 5
The time-course changes of Li-CNV in FGF2-tg and WT mice observed by OCTA. We observed Li-CNV in FGF2-tg and WT mice over time in the same individual until 28 days post-1st PC in the one-time PC group and post-2nd PC in the two-times PC group using OCTA.A. In both the one-time PC group of FGF2-tg and WT mice, Li-CNV size reached its maximum at 7 days post-1st PC and highly signaled lesion of Li-CNV gradually became indistinct by 28 days post-1st PC. Scale bar = 100 μm B. The one-time PC group of FGF2-tg mice clearly showed a decrease in Li-CNV size by 28 days post-1st PC compared with those of the Li-CNV size at 7 days post-1st PC. In contrast, in two-times PC group of FGF2-tg, highly signaled lesion of Li-CNV was illustrated clearly and Li-CNV size maintained until 28 days post-2nd PC. Scale bar = 100 μm, C. The highly signaled lesion of Li-CNV gradually became indistinct by 28 days post-1st PC in the one-time PC group of WT mice. In the two-times PC group of WT mice, Li-CNV enlarged at 7 days post-2nd PC compared with those of the Li-CNV at 7 days post-1st PC and CNV networks of both groups gradually became indistinct by 28 days post-2nd PC. Scale bar = 100 μm.
Fig. 6
Fig. 6
The real-time qPCR in FGF2-tg and WT mice. Gene expression levels were calculated using the 2−ΔΔCt method, GAPDH was used as a reference gene, and the results were presented as relative expression to the control. Untreated WT mice were used as controls. A: FGF2 mRNA expression level in the one-time PC group of FGF2-tg mice at 7 days post-1st PC was significantly higher than that in WT mice on the same day. Additionally, FGF2 mRNA expression level in the two-times PC group of FGF2-tg mice at 7 days post-2nd PC was significantly higher than that in WT mice on the same day. On the other hand, there was no significant increase in FGF2 mRNA expression level at 7 days post-2nd PC in WT mice compared with the untreated WT control mice on the same day. (FGF2-tg mice: n = 6, WT mice: n = 6, respectively), B: FGFR1 mRNA expression level in the two-times PC group of FGF2-tg mice at 7 days post-2nd PC was significantly higher than that in WT mice on the same day. On the other hand, there was no significant increase in FGFR1 mRNA expression level at 7 days post-2nd PC in WT mice compared with the untreated WT control mice on the same day. (FGF2-tg mice: n = 5 or 6, WT mice: n = 5 or 6, respectively), C: PDGFRβ mRNA expression level in the one-time PC group of FGF2-tg mice at 7 days post-1st was significantly higher than that in WT mice on the same day. Additionally, PDGFRβ mRNA expression level in the two-times PC group of FGF2-tg mice at 7 days post-2nd PC was significantly higher than that in WT mice on the same day. On the other hand, there was no significant increase in PDGFRβ mRNA expression level at 7 days post-2nd PC in WT mice compared with the untreated WT control mice on the same day. (FGF2-tg mice: n = 5 or 6, WT mice: n = 5 or 6, respectively), D: Apelin mRNA expression level in the one-time PC group of FGF2-tg mice at 7 days post-1st was significantly higher than that in WT mice on the same day. Additionally, apelin mRNA expression level in the two-times PC group of FGF2-tg mice at 7 days post-2nd PC was significantly higher than that in WT mice on the same day. On the other hand, there was no significant increase in apelin mRNA expression level at 7 days post-2nd PC in WT mice compared with the untreated WT control mice on the same day. (FGF2-tg mice: n = 5 or 6, WT mice: n = 5 or 6, respectively), E: Ang1 mRNA expression level in two-times PC group of FGF2-tg mice at 7 days post-2nd PC was significantly higher than those in WT mice on the same day. On the other hand, there was no significant increase in Ang1 mRNA expression level at 7 days post-2nd PC in WT mice compared with the untreated WT control mice on the same day. (FGF2-tg mice: n = 5 or 6, WT mice: n = 5 or 6, respectively), F: There was no significant increase in VEGF-A mRNA expression level at 7 days post-1st PC and at 7 days post-2nd PC in both of FGF2-tg and WT mice compared with the untreated WT control mice on the same day. (FGF2-tg mice: n = 6, WT mice: n = 6, respectively), G. There was no significant increase in VEGF-A mRNA expression level at 3 days post-1st PC and at 3 days post-2nd PC in both of FGF2-tg and WT mice compared with the untreated WT control mice on the same day. (FGF2-tg mice: n = 6, WT mice: n = 6, respectively).
Fig. 7
Fig. 7
The size ratio of Li-CNV compared to Li-CNV size at day7 post PC. To confirm the change in Li-CNV size, we examined the size ratio at 14 and 28 days post-PC by setting the Li-CNV size at 7 days post-PC to 100 % using OCTA imaging. There was no difference in the size ratio of Li-CNV at day 14 post-PC in any of the groups. On the other hand, the size ratio of Li-CNV at day 28 post-2nd PC in two-times PC group of FGF2-tg mice was statistically higher than that in the one-time PC group of FGF2-tg mice. Furthermore, the size ratio of Li-CNV at day 28 post-2nd PC in the two-times PC group of FGF2-tg mice was statistically higher than that in WT mice. In other words, the Li-CNV size in two-times PC group of FGF2-tg mice was maintained until 28 days post-2nd PC. (FGF2-tg mice: n = 6, WT mice: n = 6, respectively).

References

    1. Rey Sergio, Semenza Gregg L. Hypoxia-inducible factor-1-dependent mechanisms of vascularization and vascular remodelling. Cardiovasc. Res. 2010;86(2):236–242. doi: 10.1093/cvr/cvq045. - DOI - PMC - PubMed
    1. Carmeliet P., Jain R.K. Molecular mechanisms and clinical applications of angiogenesis. Nature. 2011;473:298–307. doi: 10.1038/nature10144. - DOI - PMC - PubMed
    1. Seghezzi G., Patel S., Ren C.J., et al. Fibroblast growth factor-2 (FGF-2) induces vascular endothelial growth factor (VEGF) expression in the endothelial cells of forming capillaries: an autocrine mechanism contributing to angiogenesis. J. Cell Biol. 1998;141:1659–1673. doi: 10.1083/jcb.141.7.1659. - DOI - PMC - PubMed
    1. Masahiro Murakami and Takashi Sakurai. Role of fibroblast growth factor signaling in vascular formation and maintenance: orchestrating signaling networks as an integrated system. WIREs Syst Biol Med. 2012;4:615–629. doi: 10.1002/wsbm.1190. - DOI - PubMed
    1. Senger R., Galli S.J., Dvorak A.M., Perruzzi C.A., Susan Harvey V., Dvorak H.F. Tumor cells secrete a vascular permeability factor that promotes accumulation of ascites fluid. Science. 1983;219(4587):983–985. doi: 10.1126/science.6823562. - DOI - PubMed

LinkOut - more resources