. 2024 Oct 9;15(11):6259-6276.
doi: 10.1364/BOE.535330. eCollection 2024 Nov 1.

Diffuse correlation tomography: a technique to characterize tissue blood flow abnormalities in benign and malignant breast lesions

Affiliations

Diffuse correlation tomography: a technique to characterize tissue blood flow abnormalities in benign and malignant breast lesions

Ruizhi Zhang et al. Biomed Opt Express. .

Abstract

Accurate assessment and quantification of neoangiogenesis associated with breast cancer could be potentially used to improve the sensitivity and specificity of non-invasive diagnosis, as well as predict outcomes and monitor treatment effects. In this study, we adapted an emerging technology, namely diffuse correlation tomography (DCT), to image microvascular blood flow in breast tissues and evaluate the potential for discriminating between benign and malignant lesions. A custom-made DCT system was designed for breast blood flow imaging, with both the source-detector array and reconstruction algorithm optimized to ensure precise imaging of breast blood flow. The global features and local features of three-dimensional blood flow images were extracted from the relative blood flow index (rBFI), which was obtained from most of the breasts targeted to the lesion. A total of 37 women with 19 benign and 18 malignant lesions were included in the study. Significant differences between malignant and benign groups were found in 12 image features. Moreover, when selecting the lesion mean relative blood flow index (MrBFI) as a single indicator, the malignant and benign tumors were discriminated with an accuracy of 89.2%. The blood flow features were found to successfully identify malignant and benign tumors, suggesting that DCT, as an alternate functional imaging modality, has the potential to be translated into clinical practice for diagnosis and assessment of breast cancers. There is potential to reduce the need for biopsy of benign lesions by improving the specificity of diagnostic imaging, as well as monitoring response to breast cancer treatment.


Conflict of interest statement

The authors declare that there are no conflicts of interest related to this article.

Figures

Fig. 1.
Fig. 1.
DCT instrument set-up. (a) DCT system and cup-shape fiber-optic probe for breast blood flow imaging. (b) S-D array on the fiber-optic probe. Bottom right: ‘U’, ‘D’, ‘L’, ‘R’ points to head, foot, left, right of subject, and ‘P’ indicates posterior-to-anterior orientation. (c) Detailed locations of S-D fiber array containing 8 different S-D sets, corresponding to Ch1-Ch8 in optical switch. Taking Ch3 as an example, it comprises a source (S3) and six detectors (D31, D32, D33, D34, D35, D36). (d) Connection manner between fibers and dorsal panel of optical switch. The leftmost column connects to DCT hardware of laser/APDs, while the right 8 columns connect to the probe [Fig. 1(c)]. The topmost row of right 8 columns connects to source fibers (i.e., S1 to S8) while following 6 rows connect to detector fibers, corresponding with Di1 to Di6. The DCT box, optical switch, and cup-shape probe are connected using optical fibers. The optical fibers, which connects the probe and optical switch, are encased in a protective black hose [shown in the upper right of Fig. 1(a)]. The same color in Fig. 1 indicates the connections within the same channel (set). (e) Schematic of probe placement on the breast tissue to be imaged of subject.
Fig. 2.
Fig. 2.
Representative DCT images containing four malignant and two benign lesions. Two DCT [(a)-(b)] and MRI images [(c)-(d)] with malignant lesion. (a) and (c), as well as (b) and (d) are from the same breast. Red and green arrows point to the lesion location. The high rBFI region (a) matches with the enhanced lesion (c) in the corresponding MRI images. The high rBFI region [12 o’clock shown in (b)] does not match with the enhanced lesion [9 o’clock shown in (d)] in the corresponding MRI images. Two DCT images [(e)-(f)] from breasts with biopsy-confirmed malignant lesion. (e) A 39-year-old female with invasive carcinoma in the upper-outer quadrant of her left breast. (f) A 61-year-old female with invasive carcinoma in the armpit of her left breast. Two DCT images [(g)-(h)] from breasts with biopsy-confirmed benign lesion. (g) A 47-year-old female with cyst around 12-3 o’clock in her left breast. (h) A 47-year-old female with fibroadenoma at 12 o’clock in her right breast. The “An” in the legend indicates that the images represent an anterior-to-posterior orientation of subject. The breast surface is formed by L-R axis and U-D axis. The thickness of DCT images illustrated in Fig. 2 is 1 cm below the breast surface.
Fig. 3.
Fig. 3.
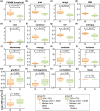
Boxplots of DCT image features with p-values. (a)-(p) Global features. The red star indicates significant difference between malignant (M) and benign (B) group from the Wilcoxon rank sum test with the Bonferroni correction at α = 0.05. (q) Mean BFI. The red star indicates significant difference between ‘M’ and ‘B’ group from the Wilcoxon rank sum test at α = 0.05.
Fig. 4.
Fig. 4.
Local features analyses. (a) Boxplots of local features categorized into four groups: (1) lesion-M: lesion from the subjects with malignant tumors; (2) lesion-B: lesion from the subjects with benign tumors; (3) norm-M: normal from the subjects with malignant tumors; (4) norm-B: normal from the subjects with benign tumors. The red star indicates significant difference from the Wilcoxon rank sum test with the Bonferroni correction at α = 0.05. (b) Accuracy curve of the benign-malignant classification for DCT images based on the threshold of MrBFI in the lesion. The black dot indicates the highest value of classification accuracy. (c) Bar graph of the MrBFI contrast between lesion and normal tissue obtained from ‘M’ and ‘B’ groups, respectively. The bar’s height indicates the average of all MrBFI contrast in the group. Error bar indicates standard deviation. (d) The relationship graph between MrBFI and BI-RADS classification. The dot indicates the average of all MrBFI in the group. Error bar indicates standard deviation. The ‘R’ and ‘p’ indicate Spearman correlation coefficient and p-value from correlation analyses. The red star indicates the highest correlations. The relationship graph between MrBFI and age in (e) malignant group and (f) benign group, respectively. The dot indicates the average of all MrBFI in the group. Error bar indicates standard deviation. The ‘p’ represents the p-value from Kruskal-Wallis test. The difference between MrBFI and age was not statistically significant (p > 0.0125).
Fig. 5.
Fig. 5.
ROC curves of significant global and local features with the corresponding AUC and 95% confidence interval (CI).

Similar articles

Cited by

References

    1. Sung H., Ferlay J., Siegel R. L., et al. , “Global Cancer Statistics 2020: GLOBOCAN Estimates of Incidence and Mortality Worldwide for 36 Cancers in 185 Countries,” Ca. Cancer J. Clin. 71(3), 209–249 (2021).10.3322/caac.21660 - DOI - PubMed
    1. Lima S. M., Kehm R. D., Terry M. B., “Global breast cancer incidence and mortality trends by region, age-groups, and fertility patterns,” eClinicalMedicine 38, 100985 (2021).10.1016/j.eclinm.2021.100985 - DOI - PMC - PubMed
    1. Duggan C., Trapani D., Ilbawi A. M., et al. , “National health system characteristics, breast cancer stage at diagnosis, and breast cancer mortality: a population-based analysis,” Lancet Oncol. 22(11), 1632–1642 (2021).10.1016/S1470-2045(21)00462-9 - DOI - PubMed
    1. Bhushan A., Gonsalves A., Menon J. U., “Current state of breast cancer diagnosis, treatment, and theranostics,” Pharmaceutics 13(5), 723 (2021).10.3390/pharmaceutics13050723 - DOI - PMC - PubMed
    1. Zhang J., Wu J., Zhou X. S., et al. , “Recent advancements in artificial intelligence for breast cancer: Image augmentation, segmentation, diagnosis, and prognosis approaches,” Semin. Cancer Biol. 96, 11–25 (2023).10.1016/j.semcancer.2023.09.001 - DOI - PubMed

LinkOut - more resources