[Preprint]. 2024 Oct 29:2024.10.28.620484.
doi: 10.1101/2024.10.28.620484.

WAVE1 and WAVE2 facilitate human papillomavirus-driven actin polymerization during cellular entry

Affiliations

WAVE1 and WAVE2 facilitate human papillomavirus-driven actin polymerization during cellular entry

D J Fernandez et al. bioRxiv. .

Update in

Abstract

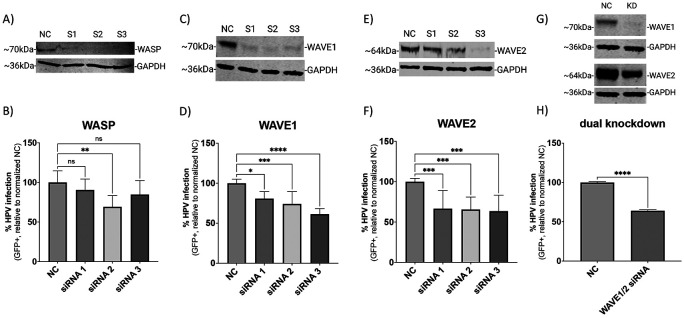
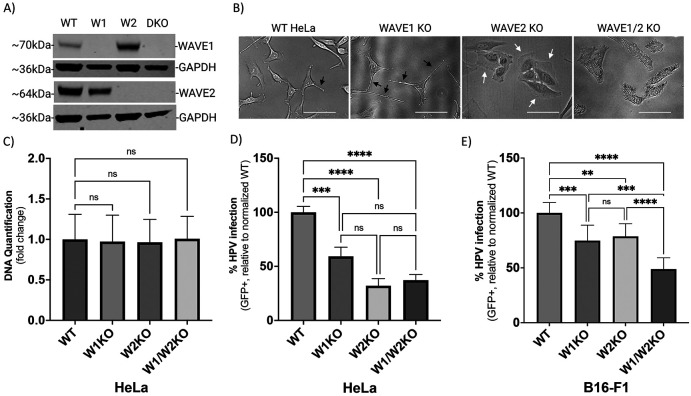
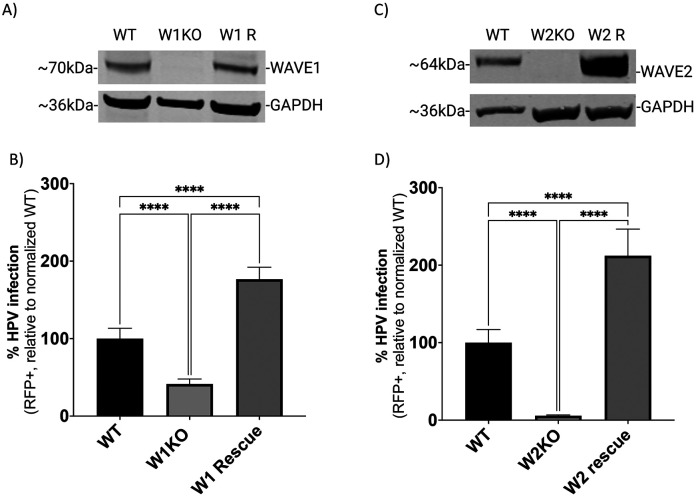
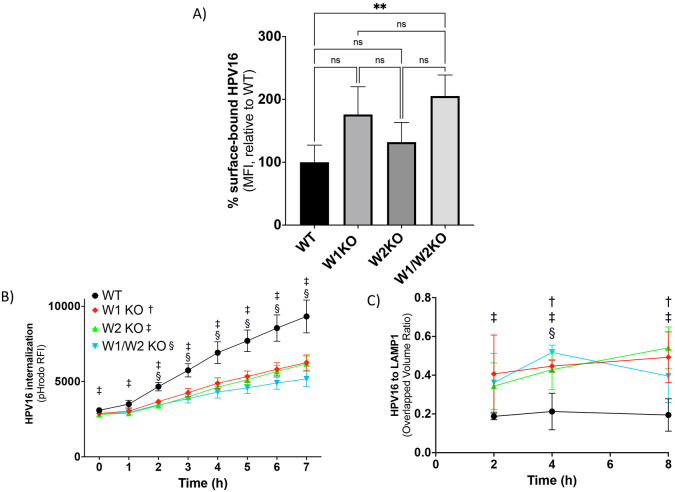
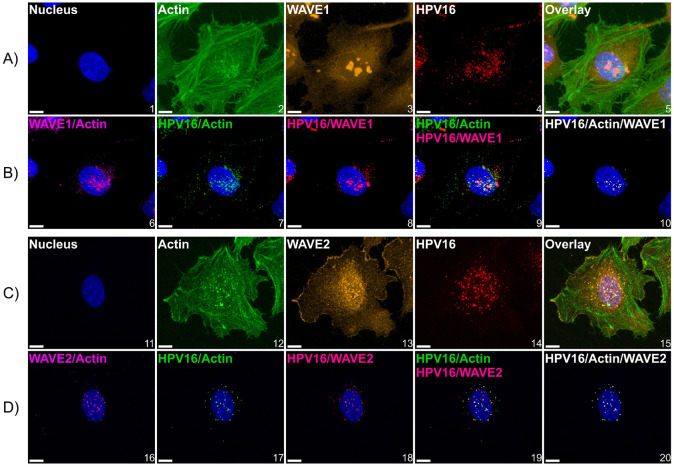
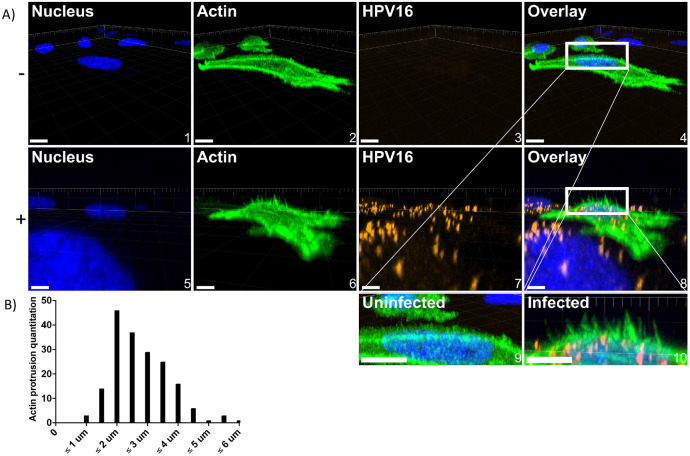
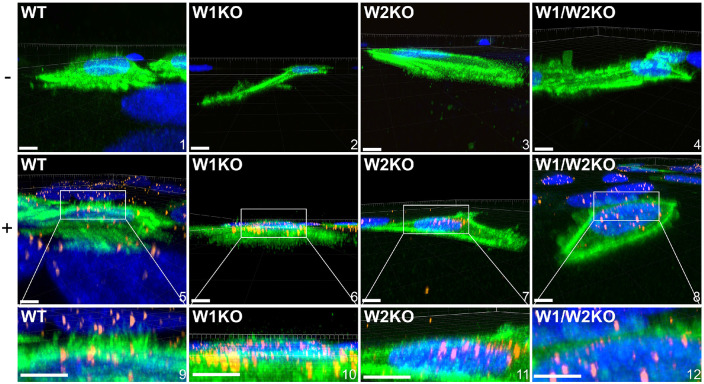
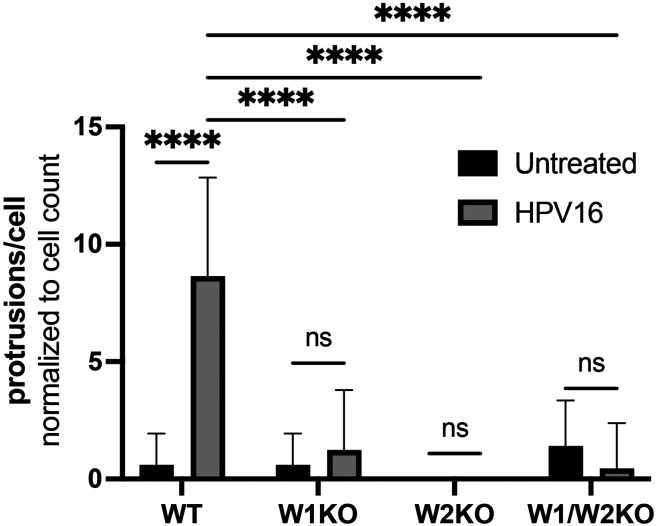
Human PapillomavirusType 16 (HPV16) is an etiological agent of human cancers that requires endocytosis to initiate infection. HPV16 entry into epithelial cells occurs through a non-canonical endocytic pathway that is actin-driven, but it is not well understood how HPV16-cell surface interactions trigger actin reorganization in a way that facilitates entry. This study provides evidence that Wiskott-Aldrich syndrome protein family verprolin-homologous proteins 1 and 2 (WAVE1 and WAVE2) are molecular mediators of the actin polymerization that facilitates HPV endocytosis and intracellular trafficking. We demonstrate through post-transcriptional gene silencing and genome editing that WAVE1 and WAVE2 are critical for efficient HPV16 infection, and that restoration of each in knockout cells rescues HPV16 infection. Cells lacking WAVE1, WAVE2, or both, internalize HPV16 at a significantly reduced rate. Analysis of fluorescently labeled cells exposed to HPV16 and acquired by confocal fluorescence microscopy revealed that HPV16, WAVE1, WAVE2, and actin are all colocalized at the cellular dorsal surface. We also found that HPV16 stimulates WAVE1 and WAVE2-mediated cellular dorsal surface filopodia formation during the viral endocytic process. Taken together, this study provides evidence that the HPV endocytic process needed for infection is controlled by actin reorganization into filopodial protrusions and that this process is mediated by WAVE1 and WAVE2.


Figures

Fig 1.
Fig 1.. siRNA-mediated knockdown of WAVE1 and WAVE2 inhibits HPV16 infection in HeLa cells.
On day 0 HeLa cells were seeded and transfected with siRNA in a 6-well microplate. On day 2, cells were collected and seeded onto a 24-well microplate to establish technical replicates. On day 3, cells were infected with HPV16 PsVs (TCID30) containing a GFP reporter plasmid for 48 hours. Protein expression of relevant proteins was measured via Western blotting on day 5 (A, C, E, G). NC is the negative control siRNA used in this study, while S1, S2, and S3 refer to each of three separate siRNAs used to target the indicated proteins. For panels G and H, S2 targeting WAVE1 and S3 targeting WAVE2 were employed to achieve knockdown of both proteins. Half volumes of each siRNA were combined for transfection so that the final concentration of siRNA in each experiment remained consistent. The percentage of HPV16 infected cells was also determined on day 5 (48 hours post infection) via flow cytometry (B, D, F, H). Each bar represents three biological replicates comprised of technical triplicates and show the mean %GFP+ cells ± standard deviation (n=3, normalized to WT). 1-way ANOVA with Dunnett’s multiple comparisons test was used to statistically determine significance (ns=not significant, **p<0.001, ***p<0.0001, ****p<0.0001).
Fig 2.
Fig 2.. WAVE1 knockout (W1KO), W2KO, and W1/W2KO alters cellular morphology, but not proliferation, and inhibits HPV16 infection in multiple cell lines.
(A) WAVE1 (W1) WAVE2 (W2) or both (DKO) proteins were knocked out in wild type (WT) HeLa cells via CRISPR/Cas9 and confirmed by Western blotting. (B) Representative phase-contrast images of WT, W1KO, W2KO, and W1/W2KO HeLa cells were taken on the FloID Cell Imaging Station (20x magnification, scale bar = 50μm). (C) W1KO, W2KO, and W1/W2KO HeLa cells were seeded in equal amounts, grown for 48 hours, and then analyzed for differences in DNA quantity via CyQUANT Cell Proliferation Assay (Thermo Fisher) compared to WT. (D and E) WT, W1KO, W2KO, and W1/W2KO HeLa or B16-F1 cells were treated with HPV16 PsVs (TCID30) containing a GFP reporter plasmid. The percentage of infected cells (based on GFP reporter gene expression) was measured at 48 hours post infection via flow cytometry. Background from mock infected cells was subtracted. For HeLa cells, at least 2 independent clones of each knockout were screened for consistent inhibition of HPV16 infection. Each bar represents three biological repeats comprised of technical triplicates and show DNA quantification over 48 hours (Panel C) or the mean %GFP+ cells ± standard deviation (n=3, normalized to WT) (Panels D and E). 1-way ANOVA with Dunnett’s multiple comparisons test was used to statistically determine significance (ns=not significant, **p<0.001, ***p<0.0001, ****p<0.0001).
Fig 3.
Fig 3.. HPV infectivity is functionally recovered by WAVE1 or WAVE2 expression in HeLa cells.
(A and C) WT and W1KO or W2KO cells were transduced with a mammalian gene expression lentiviral control vector or a vector containing either GFP-WAVE1 or GFP-WAVE2, respectively (Vector Builder). Transduced cells received an antibiotic resistance gene and underwent selection. (B and D) WT, KO, and cells with WAVE protein expression restored were treated with HPV16 PsVs (TCID30) containing an RFP reporter plasmid. The percentage of infected cells (RFP reporter gene transduction) was measured at 48 hours post infection via flow cytometry. Background from mock infected cells was subtracted. Each bar represents three biological repeats comprised of technical triplicates and show the mean %RFP+ cells ± standard deviation (n=3, normalized to WT). 1-way ANOVA with Dunnett’s multiple comparisons test was used to statistically determine significance (ns=not significant, **p<0.001, ***p<0.0001, ****p<0.0001).
Fig 4.
Fig 4.. W1KO, W2KO, and W1/W2KO increase HPV16 surface binding, reduce rate of internalization, and increase trafficking of particles to the lysosome.
(A) To assess the ability of HPV16 to bind its coreceptors, WT or KO cells were cooled to 4°C for 0.5 h to inhibit endocytosis. Cells were then transferred to ice and saturated with HPV16 VLPs (10 μg/1E6 cells) in serum-free media for 1 hour at 4°C. Cells were collected via scraping over ice and then subjected to immunostaining. The quantity of surface-bound HPV16 was analyzed by flow cytometry. Results show the mean fluorescent intensity (MFI) ± standard deviation, normalized to WT. (B) Cells were treated with pHrodo-labelled HPV16 VLPs (5 μg/1E6 cells) for 7 hours at 37°C and measured each hour via plate reader (BMG Labtech). Results show the mean MFI ± standard deviation. (A) and (B) represent three biological repeats comprised of technical triplicates. (C) Cells were cooled to 4°C for 0.5 h prior to the addition of HPV16 VLPs (0.5 μg/1E6 cells) diluted in ice-cold media and incubated together at 4°C for 1h. Next, cells were transferred to 37°C for either 2, 4, or 8h and subsequently fixed with 4% paraformaldehyde. Sample next underwent immunostaining for LAMP1 and HPV16, with a nuclear counterstain (DAPI). At least 5 Z-stacks were imaged via confocal microscopy from each of 3 biological repeats (~15 Z-stacks total per sample type with a minimum of 15 cells per condition). The quantification of the extent of colocalization between HPV16 and LAMP1 was measured by determining the overlapped volume ratio of voxels using Imaris. Results are depicted as the mean overlapped volume ratio ± standard deviation. Statistics: (A) 1-way ANOVA with Dunnett’s multiple comparisons test was used to statistically determine significance (ns=not significant, **p<0.001). (B & C) Multiple unpaired t-tests were conducted using the Holm-Šídák method for each time point between WT and KOs. †, ‡, §, symbols correspond with W1KO, W2KO, and W1/W2KO, respectively, and indicate p<0.05.
Fig 5.
Fig 5.. HPV16 colocalizes with actin and WAVE proteins at the cellular dorsal surface.
WT HeLa cells expressing LifeAct-GFP seeded in chambered microscope slides were first cooled from 37°C to 4°C for 0.5 h to inhibit endocytosis prior to the addition of HPV16 VLPs (10 ng/1E6 cells) in ice cold media for 1 hour. Cells were then returned to 37°C for 10 minutes prior to fixation with 4% paraformaldehyde for 10 minutes at room temperature, which was the temperature for subsequent steps. Samples were then permeabilized with 0.1% Triton X-100, blocked with 1% BSA, and immunostained against HPV16 L1 and (A) WAVE1 or (C) WAVE2. Hoescht 33342 was added during secondary antibody addition as a counterstain. Z-stacked images were generated via laser scanning confocal microscopy. (A and C) maximum intensity projections of Z-stacks of images depicting candidate cells. The color channels are labeled at the upper left of each image. (B and D) to analyze the spatial relationship between signals, we utilized Imaris 10.1.1 Microscopy Image Analysis Software (Oxford Instruments). Briefly, a “surface” was created for each signal, which is an Imaris segmentation algorithm. Surfaces were generated to provide object-object statistics. Parameters included the smoothing of surface details to 0.2 um with the method of absolute intensity thresholding. Background signal was subtracted through voxel size filtration (voxels smaller than 10 were excluded). Next, colocalization between channels was determined by the colocalization tool. Colocalized voxels (as determined by a Manders’ coefficient of 1) between surfaces were determined by first thresholding images to include true signals and restrict noise. New channels were then created of colocalization voxels. For both conditions, 3 fields containing 5-15 cells across 3 biological replicates were imaged. Scale = 10 μm.
Fig 6.
Fig 6.. WT HeLa cells stimulated by HPV16 express dorsal surface actin protrusions.
Cells were prepared as described in Fig 5; however, cells were not permeabilized during immunostaining. A) either untreated (top) or HPV16 infected HeLa cells (10 ng/1E6 cells) (bottom) treated with CellLight Actin-GFP were imaged via laser scanning confocal microscopy to obtain Z-stacks. Z-stacks were then stitched together and rotated to view the XZ oriented volume. Overlaid images (4 and 8) include a white box to indicate where dorsal surface actin protrusions appear. Images 9 and 10 depict what is in the white boxes but scaled up. Scale = images 1-4, 10 μm; images 5-8, 6 μm. 20 cells were analyzed per condition. B) Actin protrusion quantification was done using Imaris. The draw tool was utilized within the Surpass Tree Item Volume with the FITC channel selected. Spheres (points) were added at the base of actin protrusions, which stemmed perpendicularly from the actin cortex. The base of filopodia was determined to be the vertex of where the filopodia and the actin cortex meet. Next, a sphere (point) was added to the distal end of the filopodia as determined by fluorescence intensity. The distance between spheres was then determined.
Fig 7.
Fig 7.. Knockout of WAVE1, WAVE2, or both, prevents HPV16 stimulated HeLa cells from expressing dorsal surface actin protrusions.
Cells were prepared as described in Fig 5 however, cells were not permeabilized during immunostaining. Either untreated (top row, − symbol) or HPV16 infected WT, W1KO, or W1/W2KO HeLa cells (10 ng/1E6 cells) (middle row, + symbol) treated with CellLight Actin-GFP were imaged via laser scanning confocal microscopy to obtain Z-stacks. Z-stacks were then stitched together and rotated to view the XZ oriented volume. Scale: images 1, 2, 4-7 = 10 μm; image 3 = 8 μm; image 8 = 14 μm. 22 cells were analyzed per condition.
Fig 8.
Fig 8.. Knockout of WAVE1, WAVE2, or both, results in a significant reduction of dorsal surface actin protrusions.
Dorsal surface actin protrusions were quantified using the same method as described in Fig 6. The graph depicts the average number of protrusions per cell ± standard deviation. Statistics: 2-way ANOVA with comparison of means was used to statistically determine significance, corrected for multiple comparisons using Tukey’s test (ns = not significant, ****p<0.0001).

References

    1. Kombe Kombe AJ, Li B, Zahid A, Mengist HM, Bounda GA, Zhou Y, et al. Epidemiology and Burden of Human Papillomavirus and Related Diseases, Molecular Pathogenesis, and Vaccine Evaluation. Front Public Health. 2021. Jan 20;8:552028. - PMC - PubMed
    1. Bruni L, Albero G, Rowley J, Alemany L, Arbyn M, Giuliano AR, et al. Global and regional estimates of genital human papillomavirus prevalence among men: a systematic review and meta-analysis. Lancet Glob Health. 2023. Sep 1;11(9):e1345–62. - PMC - PubMed
    1. de Martel C, Georges D, Bray F, Ferlay J, Clifford GM. Global burden of cancer attributable to infections in 2018: a worldwide incidence analysis. Lancet Glob Health. 2020. Feb 1;8(2):e180–90. - PubMed
    1. Molano M, van den Brule A, Plummer M, Weiderpass E, Posso H, Arslan A, et al. Determinants of Clearance of Human Papillomavirus Infections in Colombian Women with Normal Cytology: A Population-based, 5-Year Follow-up Study. Am J Epidemiol. 2003. Sep 1;158(5):486–94. - PubMed
    1. Longworth MS, Laimins LA. Pathogenesis of Human Papillomaviruses in Differentiating Epithelia. Microbiol Mol Biol Rev. 2004. Jun;68(2):362–72. - PMC - PubMed

Publication types

LinkOut - more resources