[Preprint]. 2024 Oct 30:2024.10.29.620300.
doi: 10.1101/2024.10.29.620300.

Stratified analysis identifies HIF-2 α as a therapeutic target for highly immune-infiltrated melanomas

Affiliations

Stratified analysis identifies HIF-2 α as a therapeutic target for highly immune-infiltrated melanomas

Amy Y Huang et al. bioRxiv. .

Abstract

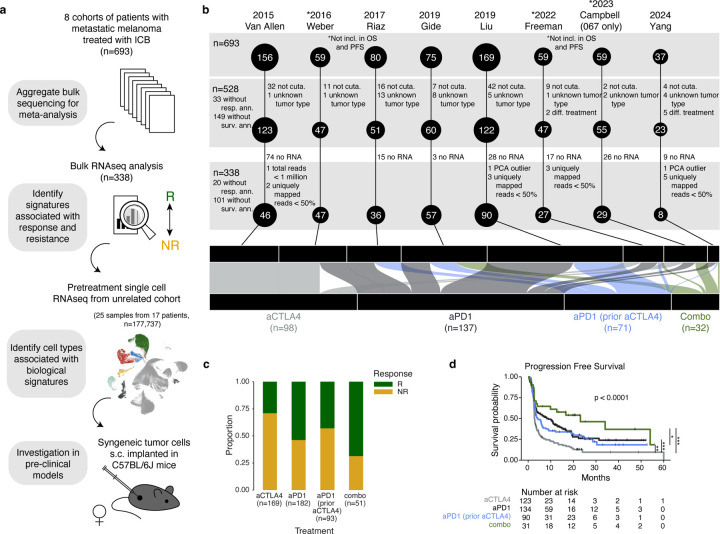
While immune-checkpoint blockade (ICB) has revolutionized treatment of metastatic melanoma over the last decade, the identification of broadly applicable robust biomarkers has been challenging, driven in large part by the heterogeneity of ICB regimens and patient and tumor characteristics. To disentangle these features, we performed a standardized meta-analysis of eight cohorts of patients treated with anti-PD-1 (n=290), anti-CTLA-4 (n=175), and combination anti-PD-1/anti-CTLA-4 (n=51) with RNA sequencing of pre-treatment tumor and clinical annotations. Stratifying by immune-high vs -low tumors, we found that surprisingly, high immune infiltrate was a biomarker for response to combination ICB, but not anti-PD-1 alone. Additionally, hypoxia-related signatures were associated with non-response to anti-PD-1, but only amongst immune infiltrate-high melanomas. In a cohort of scRNA-seq of patients with metastatic melanoma, hypoxia also correlated with immunosuppression and changes in tumor-stromal communication in the tumor microenvironment (TME). Clinically actionable targets of hypoxia signaling were also uniquely expressed across different cell types. We focused on one such target, HIF-2α, which was specifically upregulated in endothelial cells and fibroblasts but not in immune cells or tumor cells. HIF-2α inhibition, in combination with anti-PD-1, enhanced tumor growth control in pre-clinical models, but only in a more immune-infiltrated melanoma model. Our work demonstrates how careful stratification by clinical and molecular characteristics can be leveraged to derive meaningful biological insights and lead to the rational discovery of novel clinical targets for combination therapy.

Keywords: HIF-2α; anti-PD-1; hypoxia; immunotherapy; melanoma.


Conflict of interest statement

Conflict of interest/Competing interest A.H.S. has patents/pending royalties on the PD-1 pathway from Roche and Novartis and has research funding from AbbVie, TaiwanBio, and Calico unrelated to the submitted work. A.H.S. serves on advisory boards for Elpiscience, Monopteros, Alixia, Corner Therapeutics, Bioentre, Amgen, Glaxo Smith Kline, and Janssen. She also is on scientific advisory boards for the Massachusetts General Cancer Center, Program in Cellular and Molecular Medicine at Boston Children’s Hospital, the Human Oncology and Pathogenesis Program at Memorial Sloan Kettering Cancer Center, Perlmutter Cancer Center at NYU, the Gladstone Institutes, and the John Hopkins Bloomberg-Kimmel Institute for Cancer Immunotherapy. She is an academic editor for the Journal of Experimental Medicine. G.J.F. has patents/royalties on the PD-L1/PD-1 pathway from Roche, Merck MSD, Bristol-Myers-Squibb, Merck KGA, Boehringer-Ingelheim, AstraZeneca, Dako, Leica, Mayo Clinic, Eli Lilly, and Novartis. G.J.F. has served on advisory boards for iTeos, NextPoint, IgM, GV20, IOME, Bioentre, Santa Ana Bio, Simcere of America, and Geode. G.J.F. has equity in Nextpoint, iTeos, IgM, Invaria, GV20, Bioentre, and Geode. G.M.B. discloses the following financial and professional collaborations: Takeda Oncology – sponsored research agreement, Olink Proteomics – sponsored research agreement, Novartis – scientific advisory board, speaker, Nektar Therapeutics – scientific advisory board, steering committee, Palleon Pharmaceuticals – sponsored research agreement, InterVenn Biosciences – sponsored research agreement, scientific advisory board, Merck – scientific advisory board, consulting, Iovance - scientific advisory board, Ankyra Therapeutics – scientific advisory board, equity. F.S.H. reports grants and personal fees from Bristol-Myers Squibb, personal fees from Merck, grants and personal fees from Novartis, personal fees from Compass Therapeutics, personal fees from Apricity, personal fees from 7 Hills Pharma, personal fees from Bicara, personal fees from Checkpoint Therapeutics, personal fees from Genentech/Roche, personal fees from Bioentre, personal fees from Gossamer, personal fees from Iovance, personal fees from Catalym, personal fees from Immunocore, personal fees from Kairos, personal fees from Rheos, personal fees from Bayer, personal fees from Zumutor, personal fees from Corner Therapeuitcs, personal fees from Puretech, personal fees from Curis, personal fees from Astra Zeneca, personal fees from Pliant, personal fees from Solu Therapeutics, personal fees from Vir Biotechnology, personal fees from 92Bio, outside the submitted work; In addition, F.S.H. has a patent “Methods for Treating MICA-Related Disorders” (#20100111973) with royalties paid, a patent “Tumor antigens and uses thereof” (#7250291) issued, a patent “Angiopoieten-2 Biomarkers Predictive of Anti-immune checkpoint response” (#20170248603) pending, a patent “Compositions and Methods for Identification, Assessment, Prevention, and Treatment of Melanoma using PD-L1 Isoforms” (#20160340407) pending, a patent “Therapeutic peptides ”(#20160046716) pending, a patent “Therapeutic Peptides” (#20140004112) pending, a patent “Therapeutic Peptides” (#20170022275) pending, a patent “Therapeutic Peptides” (#20170008962) pending, a patent “Therapeutic Peptides” (#9402905) issued, a patent “METHODS OF USING PEMBROLIZUMAB AND TREBANANIB” pending, a patent “Vaccine compositions and methods for restoring NKG2D pathway function against cancers” (#10279021) with royalties paid, a patent “antibodies that bind to MHC Class I polypeptide-related sequence”, a patent (#10106611) issued, a patent “ANTI-GALECTIN ANTIBODY BIOMARKERS PREDICTIVE OF ANTI-IMMUNE CHECKPOINT AND ANTI-ANGIOGENESIS RESPONSES” (publication number #20170343552) pending, and a patent “Antibodies against EDIL3 and methods of use thereof” pending. D.L. reports receiving personal fees from Genentech, and served on the Scientific Advisory Board for Oncovalent Therapeutics, outside the current work.

Figures

Figure 1.
Figure 1.. Study overview, cohort selection, and clinical characteristics.
a. Diagram depicting study overview. The study has four major components: (1) aggregate bulk RNA-sequencing data from 8 cohorts for a meta-analysis, (2) identify features of the tumor microenvironment (TME) associated with response and resistance, (3) analyze cell types associated with such features in orthogonal scRNA-sequencing cohorts to evaluate the potential for targeting such signatures, and (4) testing in pre-clinical models. b. Eight cohorts included in bulk transcriptomic analysis (n=694). c. Response rates by treatment group. Only samples which passed clinical inclusion criteria with response data were included; 33 samples were missing response annotations. d. Progression-free survival rates stratified by treatment group. Samples which passed clinical exclusion criteria with survival data were considered. 149 samples were missing survival data or were treated sequentially; these were excluded from the analysis. The survival rates between the four treatment groups were significantly different (Log-rank p < 0.0001). Significance of pairwise log-rank test also shown, where ∗ ∗ ∗p < 0.001, ∗ ∗ p < 0.01, ∗p < 0.05.
Figure 2.
Figure 2.. Immune stratification reveals increased response rates to combination ICB in patients with immune-high tumors.
a. Heatmap showing the scaled ssGSEA scores of 19 immune cell type signatures across all bulk RNA-seq samples. Across all samples, hierarchical clustering is used to define two clusters: immune-high and immune-low. b. Co-correlation matrix between the immune score and other immune infiltrate metrics showing high levels of correlation between the immune score and other metrics (between 0.56 and 0.94). From left to right and top to bottom, the columns of the heatmap are: (1) expanded IFNγ signature [12], (*) the immune score (outlined in red), (2) Hallmark IFNγ signature [26], (3) TLS marker genes [27], (4) CIBERSORTx Tirosh immune proportion [70], (5) CIBERSORTx LM22 absolute immune score [71], (6) non-expanded IFNγ signature [12], (7) CIBERSORTx LM22 CD8+ T cell proportion [71], (8) CIBERSORTx Tirosh CD8+ T cell proportion [70], (9) Cabrita TLS signature [27]. c. In samples with both whole exome sequencing and bulk RNA-seq (n=162), tumor purity (estimated by FACETS [77]) anti-correlates with the immune score (Spearman’s ρ = −0.64, p < 0.0001). d. The immune score by responders and non-responders in each treatment group. e-f. Frequency of response by treatment group in (e) immune-low and (f) immune-high. g. Odds ratio and significance by one-sided Fisher’s Exact Test for response in immune-high versus immune-low populations for each treatment group. h. Odds ratio and significance by one-sided Fisher’s Exact Test for response in combination versus anti-PD-1 in immune-high and immune-low. For d-f., 20 samples with RNA-seq but no response annotations are not shown. ∗ ∗ ∗p < 0.001, ∗ ∗ p < 0.01, ∗p < 0.05; n.s. denotes “not significant.”
Figure 3.
Figure 3.. Hypoxia and related pathways enrich in non-responders to anti-PD-1 in immune-high tumor samples.
a. Enrichment of 254 pathways from the Hallmarks and Kegg databases, including select T cell signatures from ImmuneSigDB. Enrichment analysis was performed for each group of immune-high or low samples for each treatment group separately. Number of significant treatment/immune conditions for which the signature is enriched (0–7) is shown on the annotations on the right of the heatmap. Broad categories for sets of gene signatures of interest are labelled to the right of the significance annotation; grey bars denote signatures which fall into the given categories. b. Normalized enrichment score for response to anti-PD-1, immune-high. Hypoxia and related signatures are labelled; *: FDR< 0.05, **: FDR< 0.01. c. ssGSEA score of hypoxia response to anti-PD-1 in immune-high and immune-low. *: p < 0.05 by Wilcoxon rank-sum. n.s. denotes “not significant.”
Figure 4.
Figure 4.. Single-cell RNA-seq reveals hypoxia associates with immune exclusion and immunosuppressive phenotypes.
a. UMAP showing general cell type clustering for 175,497 cells included in analysis . b. Sample-level hypoxia stratification based on a cell-type normalized sample-level hypoxia score (Methods). Samples are designated as low or high based on tertiles. Mean and standard deviation of normalized hypoxia score shown. c. Pearson correlation between hypoxia score across compartments. d. Immune frequency in each sample by hypoxia state. Significance from Wilcoxon-rank sum, ∗p < 0.05. e. UMAP showing immune cell type clustering . f. Heatmap showing the pre-ranked GSEA normalized enrichment score (NES) for each of 254 signatures plus 4 additional hypoxia signatures. Genes were ranked by the estimated hypoxia score effect for each cell type as (see Methods on “modeling sample-level hypoxia”). Select gene sets of interest are labelled. Signatures and cell types are clustered by hierarchical clustering. Cell type subsets not shown (B cells, plasma cells, pDCs, mast cells, neutrophils) did not have enough representation across low, mid, and high hypoxia samples to include in the analysis. g. Estimated hypoxia score effect for all genes expressed in pseudobulk CD8+ T cells with log2(fold change) greater than 0.1 between high and low hypoxia samples (2,117 genes), as estimated by a linear model. Genes are ranked from lowest to highest based on the estimated effect of the sample-level hypoxia score. Select genes of interest are labelled. h. Normalized ssGSEA score of an LCMV effector versus exhausted CD8+ T cell signature in CD8+ T cell pseudobulks correlated with sample-level hypoxia score (Pearson’s R = −0.52, p < 0.05). Note that sample 194008 (hypoxia score of 2.46), is dropped from this panel because no CD8+ T cells were identified from this sample. i. Same as g. for tumor-associated macrophages (TAMs, 2,107 genes). j. Normalized ssGSEA score of the SPP1+ TAM signatures from Wei et al. 2021 [43] in TAMs correlated with sample-level hypoxia score (Pearson’s R = 0.31, p = 0.14).
Figure 5.
Figure 5.. Effect of hypoxia on stromal cell characteristics and stromal-tumor communication.
a. AUCell Hallmark Hypoxia score for all cells in each general cell type. b. Log-normalized expression (counts per ten thousand) of labelled gene for each cell type averaged across all cells of that type per sample. a-b. Cell types with significantly higher scores by Wilcoxon rank-sum are shown, with each cell type compared against all others. *: p < 0.05, **: p < 0.01, ***: p < 0.001. c. Frequency of fibroblasts (out of all cells) in low-, mid-, and high-hypoxia samples. d. Estimated hypoxia score effect for all genes expressed in pseudobulk of labelled cell type with log2(fold change) greater than 0.25 between high and low hypoxia samples (8,410 genes in fibroblasts), as estimated by a linear model (see Methods for details). Genes are ranked from lowest to highest based on the estimated effect of the sample-level hypoxia score. Select genes of interest are labelled. e. Frequency of endothelial cells (out of all cells) in low-, mid-, and high-hypoxia samples (5,871 genes in endothelial cells with log2(fold change) greater than 0.25. f. Like d., but with endothelial cells. g-h. The relationship between the number of stromal-tumor interactions estimated by the CellPhoneDB statistical analysis method [45] and the sample-level hypoxia score for fibroblasts and endothelial cells (ECs). Correlations shown are Pearson correlations. i-j. All stromal-tumor interactions which are significant ≥ 75% of the samples (p < 0.05 in at least 6/8) in each category: low hypoxia (left, pink), mid hypoxia (middle, white), high hypoxia (right, grey). All ≥ 75% significant interactions in multiple categories (e.g. ‘KDR_VEGFA’ in EC-tumor interactions for both mid hypoxia and high hypoxia) are shown in dashed overlapping regions. Interacting pairs are listed as “partnerA_partnerB”, where partnerA is expressed on stromal cells and partnerB is expressed on tumor cells.
Figure 6.
Figure 6.. Targeting hypoxia in combination with anti-PD-1 slows tumor growth in pre-clinical models of immune-high tumors
a. Graphic depicting experimental design of combination PT2399/anti-PD-1 treatment experiments. b-c. Growth curves showing tumor growth in response to HIF2α inhibitor (PT2399) and anti-PD-1 blockade combination treatment for (b) B16-OVA and (c) B16.F10. Data representative of two independent experiments (n > 5 per group). d-i. Flow cytometry characterization of T cells isolated from B16-OVA tumors treated with isotype control, anti-PD-1, PT2399, or the combination. Data showing two independent experiments combined (n=4–5 per group). d. Percentage of CD8+ T cells of CD45+ cells. e. Percentage of conventional T cells (Tcon; CD4+FOXP3-) of CD45+ cells. f. Percentage of regulatory T cells (Tregs; CD4+FOXP3+) of CD45+ cells. g. Percent of PD-1+ CD8+ T cells out of total CD8+ T cells. h. Percent of TIM-3+ CD8+ T cells out of total CD8+ T cells. i. Percent of Ki-67+ CD8+ T cells out of total CD8+ T cells. j. Percentage of HIF-1α+ CD31+ cells out of total CD31+ cells in the tumor. Significance levels are denoted as *p < 0.05, **p < 0.01, ***p < 0.001.

References

    1. Stephen Hodi F., O’Day Steven J., McDermott David F., Weber Robert W., Sosman Jeffrey A., Haanen John B., Gonzalez Rene, Robert Caroline, Schadendorf Dirk, Hassel Jessica C., Akerley Wallace, Van Den Eertwegh Alfons J.M., Lutzky Jose, Lorigan Paul, Vaubel Julia M., Linette Gerald P., Hogg David, Ottensmeier Christian H., Lebbé Celeste, Peschel Christian, Quirt Ian, Clark Joseph I., Wolchok Jedd D., Weber Jeffrey S., Tian Jason, Yellin Michael J., Nichol Geoffrey M., Hoos Axel, and Urba Walter J.. Improved Survival with Ipilimumab in Patients with Metastatic Melanoma. New England Journal of Medicine, 363(8):711–723, August 2010. - PMC - PubMed
    1. Robert Caroline, Schachter Jacob, Long Georgina V., Arance Ana, Grob Jean Jacques, Mortier Laurent, Daud Adil, Carlino Matteo S., McNeil Catriona, Lotem Michal, Larkin James, Lorigan Paul, Neyns Bart, Blank Christian U., Hamid Omid, Mateus Christine, Shapira-Frommer Ronnie, Kosh Michele, Zhou Honghong, Ibrahim Nageatte, Ebbinghaus Scot, and Ribas Antoni. Pembrolizumab versus Ipilimumab in Advanced Melanoma. New England Journal of Medicine, 372(26):2521–2532, June 2015. - PubMed
    1. Wolchok Jedd D., Chiarion-Sileni Vanna, Gonzalez Rene, Rutkowski Piotr, Grob Jean-Jacques, Lance Cowey C., Lao Christopher D., Wagstaff John, Schadendorf Dirk, Ferrucci Pier F., Smylie Michael, Dummer Reinhard, Hill Andrew, Hogg David, Haanen John, Carlino Matteo S., Bechter Oliver, Maio Michele, Ivan Marquez-Rodas Massimo Guidoboni, McArthur Grant, Lebbé Celeste, Ascierto Paolo A., Long Georgina V., Cebon Jonathan, Sosman Jeffrey, Postow Michael A., Callahan Margaret K., Walker Dana, Rollin Linda, Bhore Rafia, Stephen Hodi F., and Larkin James. Overall Survival with Combined Nivolumab and Ipilimumab in Advanced Melanoma. New England Journal of Medicine, 377(14):1345–1356, October 2017. - PMC - PubMed
    1. Larkin James, Chiarion-Sileni Vanna, Gonzalez Rene, Grob Jean-Jacques, Rutkowski Piotr, Lao Christopher D., Lance Cowey C., Schadendorf Dirk, Wagstaff John, Dummer Reinhard, Ferrucci Pier F., Smylie Michael, Hogg David, Hill Andrew, Márquez-Rodas Ivan, Haanen John, Guidoboni Massimo, Maio Michele, Schöffski Patrick, Carlino Matteo S., Lebbé Céleste, McArthur Grant, Ascierto Paolo A., Daniels Gregory A., Long Georgina V., Bastholt Lars, Rizzo Jasmine I., Balogh Agnes, Moshyk Andriy, Stephen Hodi F., and Wolchok Jedd D.. Five-Year Survival with Combined Nivolumab and Ipilimumab in Advanced Melanoma. New England Journal of Medicine, 381(16):1535–1546, October 2019. - PubMed
    1. Jenkins Russell W, Barbie David A, and Flaherty Keith T. Mechanisms of resistance to immune checkpoint inhibitors. British Journal of Cancer, 118(1):9–16, January 2018. - PMC - PubMed

Publication types

LinkOut - more resources