[Preprint]. 2024 Oct 30:2024.10.29.620847.
doi: 10.1101/2024.10.29.620847.

Dynamic imbalances in cell-type specific striatal ensemble activity during visually guided locomotion

Affiliations

Dynamic imbalances in cell-type specific striatal ensemble activity during visually guided locomotion

Brenna Fearey et al. bioRxiv. .

Abstract

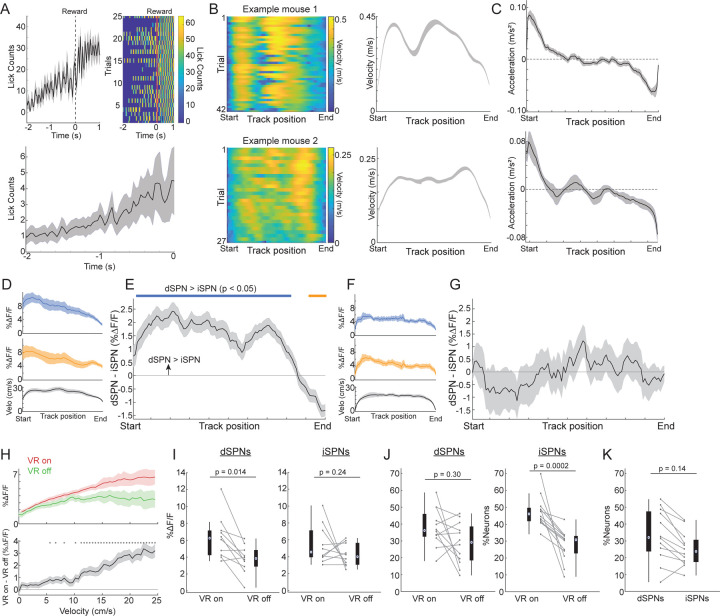
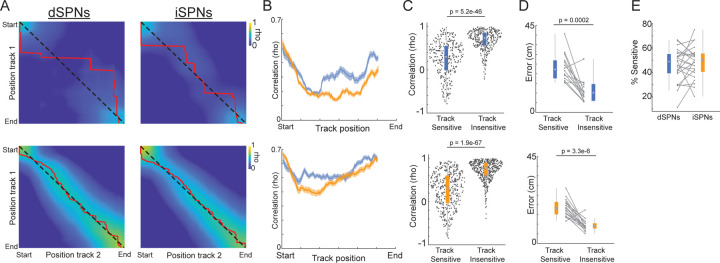
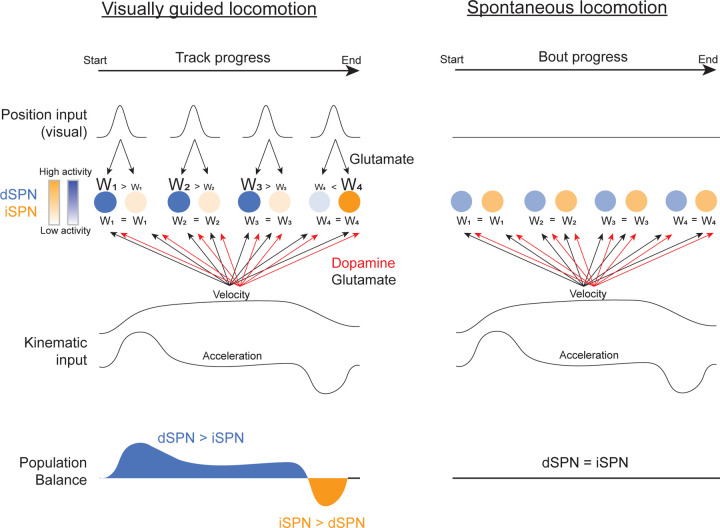
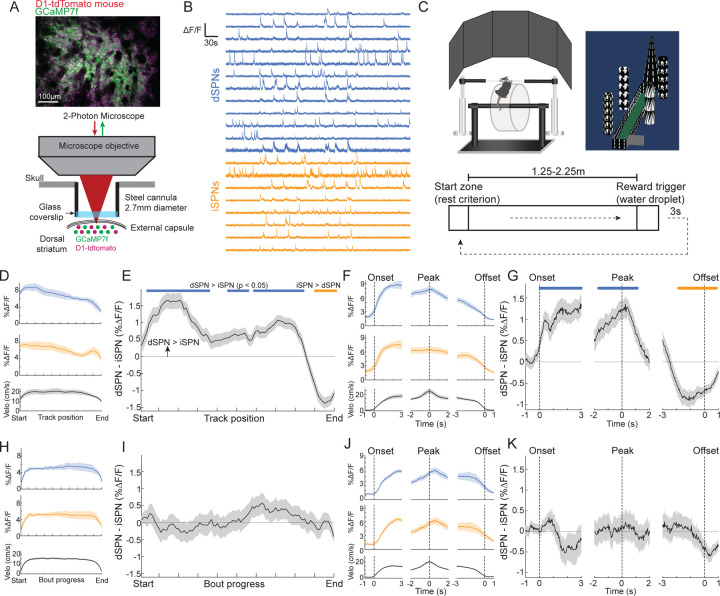
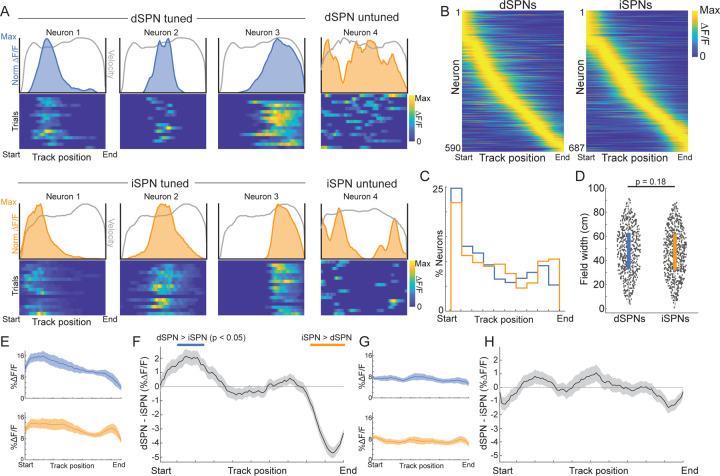
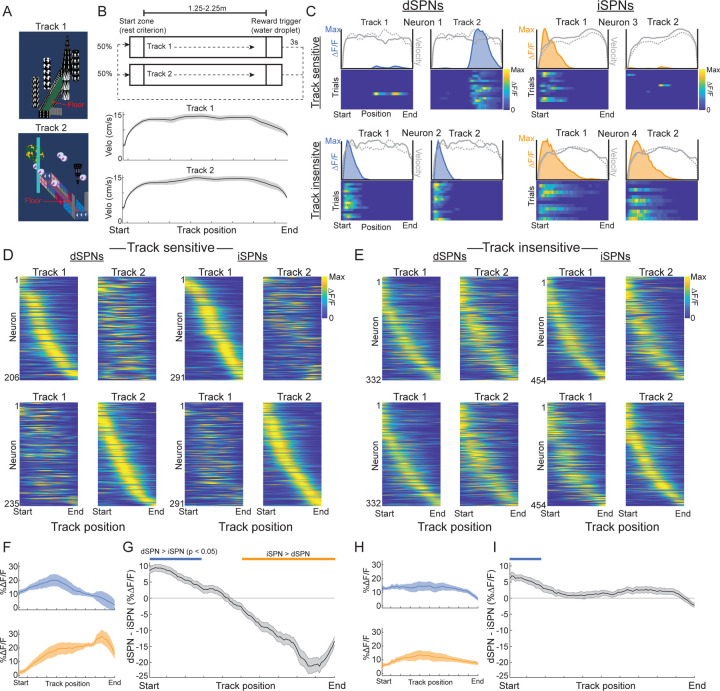
Locomotion is continuously regulated by an animal's position within an environment relative to goals. Direct and indirect pathway striatal output neurons (dSPNs and iSPNs) influence locomotion, but how their activity is naturally coordinated by changing environments is unknown. We found, in head-fixed mice, that the relative balance of dSPN and iSPN activity was dynamically modulated with respect to position within a visually-guided locomotor trajectory to retrieve reward. Imbalances were present within ensembles of position-tuned SPNs which were sensitive to the visual environment. Our results suggest a model in which competitive imbalances in striatal output are created by learned associations with sensory input to shape context dependent locomotion.


Figures

Extended Data Figure 1:
Extended Data Figure 1:. Additional behavioral measures and activity comparisons in and out of VR.
A.) Mean spout licking triggered on reward deliveries at the end of the linear track from one representative session (top left) and across mice (n = 5) and sessions (n = 36) (bottom). Top right is a raster of lick counts on all individual trials for the session at top left. B.) Left: Velocity binned by track position across all trials in two example sessions in two different mice with distinct velocity profiles. Right: Mean velocity binned by track position for the two sessions shown at left. C.) Mean treadmill acceleration binned by track position (top) and locomotion bout progress (bottom) across all sessions in (top, n = 36 sessions) and out (bottom, n = 35 sessions) of VR. D.) Mean ΔF/F of dSPNs (blue, n = 271), iSPNs (orange, n = 358), and treadmill velocity (black) binned by position along the linear track from the 2 mice and 12 sessions with corresponding imaging of the same fields outside VR. E.) Mean difference in population ΔF/F between dSPNs and iSPNs binned by track position for the sessions in D. F.) Mean ΔF/F of dSPNs (blue, n = 218), iSPNs (orange, n = 293), and treadmill velocity (black) for spontaneous locomotion bouts occurring outside of VR binned by relative bout progress normalized to the distance of each bout from the 2 mice in D (10 sessions) D. G.) Mean difference in population ΔF/F between dSPNs and iSPNs binned by bout progress for the sessions in F. H.) Top: Mean ΔF/F binned by velocity for all SPNs imaged in the same sessions in and out of VR. Bottom: Difference in mean ΔF/F between inside and outside VR for the cells and sessions at top. Asterisks, p < 0.05. I.) Boxplot of the mean ΔF/F per second during locomotion bouts (see Methods) in VR-on and VR-off sessions for dSPNs (left) and iSPNs (right). Each point is the mean across all neurons in a session, lines connect corresponding sessions with the same imaging field. J.) Boxplot of the percentage of the total dSPNs (left) and iSPNs (right) active only in VR-on or VR-off periods for sessions with the same imaging fields in both as in I. K.) Boxplot of the percentage of the total dSPNs and iSPNs active in both VR-on and VR-off periods as in J. P-values, Wilcoxon rank sum test. Shaded regions, 95% confidence intervals of the model coefficients from the linear mixed effect model (see Methods).
Extended Data Figure 2:
Extended Data Figure 2:. Additional comparisons of track sensitive and insensitive neurons.
A.) Pairwise correlations (Spearman’s rho) between the mean ΔF/F at a given track position across all track sensitive (top) and insensitive (bottom) neurons in track 1 and the mean ΔF/F across the same neurons in track 2. Matrices show correlations between the mean ΔF/F population vectors for all combinations of track positions. Values along the diagonal (dashed line) are correlations for the same relative positions in tracks 1 and 2, so high correlations indicate similar mean population activity in the two tracks at that position. Red lines indicate the combination of track 1 and 2 positions with the highest correlation. B.) Mean correlations for track sensitive (top) and insensitive (bottom) dSPN (blue) and iSPN (orange) mean ΔF/F population vectors between the same relative positions in tracks 1 and 2 (the diagonal in A). Correlations were computed for each session at each position then averaged across sessions. C.) Boxplots of the correlations (Spearman’s rho) of position-binned mean ΔF/F for each neuron (dot) between track 1 and track 2 for all dSPNs (top) and iSPNs (bottom) classified as track sensitive and insensitive. D.) Boxplots of the absolute deviation (error, in cm; red line in A) between the empirical peak correlation position and the expected peak correlation if the activity pattern relative to position was identical in track 1 and track 2 for track sensitive and insensitive dSPNs (top) and iSPNs (bottom). Pairs of connected dots are comparisons of SPNs in the same session. E.) Boxplot of the percent track sensitive dSPNs and iSPNs of the total stable position tuned population for each session. Dots and lines indicate percentages for each session. P-values, Wilcoxon Rank Sum test.
Extended Data Figure 3:
Extended Data Figure 3:. Model for the generation of dSPN/iSPN activity imbalances.
During stereotyped locomotion through a familiar environment (e.g. the VR track), individual dSPNs and iSPNs (blue and orange dots, respectively) receive excitatory, glutamatergic inputs encoding distinct visual features of the environment at each position, giving rise to the position tuning within specific environments we observed (Figs. 2 and 3 and Extended Data Fig. 2). In addition, position tuned SPNs receive glutamatergic and dopaminergic inputs which signal locomotor kinematics at all positions in the environment. Note that each SPN likely receives different relative levels of position and locomotor input, giving rise to diverse tuning across the population (e.g. some neurons will not be sensitive to visual input, Fig. 3). The visual input at each position onto dSPNs and iSPNs is equivalent, but the synaptic weights (W) of the position inputs onto each SPN differ depending on the locomotion kinematics at each position: dSPN weights > iSPN at positions where animals accelerate or sustain high velocity and iSPN weights < dSPN at positions where animals decelerate. Thus, the relative dSPN/iSPN balance at each position reflects an association of context specific visual input and locomotion kinematics. The asymmetric weights onto dSPNs and iSPNs are produced by the kinematic signal transmitted by the dopaminergic (perhaps in conjunction with the glutamatergic) inputs. Dopamine release bi-directionally modulates synaptic plasticity in SPNs, promoting long term potentiation and depression of dSPN and iSPN synapses respectively,. Thus, dopamine fluctuations related to ongoing locomotion kinematics will selectively strengthen or weaken the sensory inputs at each position with repeated stereotyped experience (e.g. animals always slow down at the same track position). When visual inputs are not associated with consistent locomotor kinematics (such as during spontaneous running with VR off, Fig. 1h–i and Extended Data Fig. 1d–g) or if neurons receive only continuous locomotor input, the dSPN/iSPN output is balanced (right panels).
Figure 1:
Figure 1:. Dynamic imbalances in the activity of striatal projection neuron cell types during stereotyped locomotion in a virtual linear track task.
A.) Schematic of the 2-photon imaging approach for simultaneous cellular resolution Ca2+ imaging of dSPNs and iSPNs in the dorsal striatum of head-fixed mice. B.) Fluorescence traces (min-max normalized ΔF/F) from dSPNs and iSPNs in a representative field. C.) Schematic of the head-fixed virtual reality setup and linear track task design. D.) Mean ΔF/F of dSPNs (blue, n = 1551), iSPNs (orange, n = 2057), and treadmill velocity (black) from 5 mice and 36 sessions binned by position along the linear track. E.) Mean difference in population ΔF/F between dSPNs and iSPNs binned by track position. Blue lines indicate bins where dSPN ΔF/F>iSPN, orange lines iSPN>dSPN (p < 0.05, t-tests on model coefficients, Bonferroni corrected for multiple comparisons). F.) Mean ΔF/F and velocity as in D, triggered on onsets, offsets, and the peak velocity of locomotion bouts during VR track traversal. G.) Mean difference in population ΔF/F as in E, triggered on locomotion periods as in F. H.) Mean ΔF/F of dSPNs (blue, n = 1680), iSPNs (orange, n = 2746), and velocity (black) from 3 mice and 35 sessions for spontaneous locomotion bouts occurring outside of VR, binned by relative bout progress normalized to the distance of each bout. I.) Mean difference in population ΔF/F between dSPNs and iSPNs (as in E) binned by normalized bout progress outside VR. J.) Mean ΔF/F and velocity as in H, triggered on onsets, offsets, and the peak velocity of locomotion bouts during spontaneous locomotion bouts outside of VR. K.) Mean difference in population ΔF/F as in I, triggered on accelerations as in J. Shaded regions in all plots are the 95% confidence intervals of the model coefficients from the linear mixed effect model (see Methods).
Figure 2:
Figure 2:. Dynamic imbalances originate from a subpopulation of position selective SPNs that collectively tile the linear track environment.
A.) Representative dSPNs (top) and iSPNs (bottom) with and without significant track position tuning across trials in a session (see Methods). Color plots are ΔF/F on each trial, binned by track position, normalized to the max ΔF/F across all trials. Shaded blue (dSPNs) and orange (iSPNs) regions above the color plots are the mean ΔF/F for each position. The overlaid gray lines are the mean normalized position binned velocities. B.) Mean ΔF/F binned by track position for all dSPNs (left) and iSPNs (right) classified as having stable track position tuning across trials (see Methods) normalized by the max ΔF/F for each neuron. Neurons are sorted by the positions of the maximum ΔF/F from track start to end. C.) Percent of the total position tuned population of dSPNs (blue) and iSPNs (orange) with a maximum ΔF/F at each position across the virtual track. D.) Boxplot of median field widths of all position tuned SPNs. Each dot is a single SPN. E.) Mean ΔF/F of stable, position-tuned dSPNs (blue, n = 590) and iSPNs (orange, n = 687) from 5 mice and 36 sessions binned by position along the linear track. F.) Mean difference in population ΔF/F between the dSPNs and iSPNs in E binned by track position. Blue lines indicate bins where dSPN ΔF/F > iSPN, orange lines iSPN>dSPN (p < 0.05, t-tests on model coefficients, Bonferroni corrected for multiple comparisons). G.) Same as E for active neurons without significant position tuning (n = 406 dSPNs, and 447 iSPNs). P-values, Wilcoxon rank sum test. Shaded regions in all plots are the 95% confidence intervals of the fitted model coefficients from the linear mixed effect model (see Methods).
Figure 3:
Figure 3:. Subpopulations of position tuned SPNs differ in their sensitivity to environment specific visual input and in their cell-type specific activity imbalances.
A.) Top-down images of the two virtual tracks with distinct distal and proximal features. B.) Task schematic (top) and mean velocity (bottom) binned by track position in the two tracks across all mice and sessions (n = 4 mice and 23 sessions). C.) Representative position tuned dSPNs (left) and iSPNs (right) with tuning that is sensitive (top) or insensitive (bottom) to the visual track environment. Color plots are ΔF/F on each trial, binned by track position, normalized to the maximum ΔF/F across all trials. Shaded blue (dSPNs) and orange (iSPNs) regions above the color plots are the normalized mean ΔF/F for each position. Overlaid gray lines are the normalized position binned velocity; solid line is track 1 and dashed line is track 2. D.) Mean ΔF/F binned by position in each track for all dSPNs (left) and iSPNs (right) classified as having track-sensitive position tuning across trials (see Methods) normalized by the maximum ΔF/F for each neuron across both tracks. Neurons are sorted by the positions of the mean ΔF/F peaks from track start to end. Top row plots are sorted by peak position indices in track 1, bottom row, track 2. Only neurons with significant position tuning in track 1 are shown in top and in track 2 on bottom. Note that the organization of peak tuning locations across neurons and relative ΔF/F magnitudes differ between tracks. E.) Same as D but for neurons with track insensitive position tuning. Note that the organization of peak tuning and ΔF/F magnitudes are relatively similar between tracks. F.) Mean ΔF/F of position-tuned, track sensitive dSPNs (blue, n = 132) and iSPNs (orange, n = 260) from 3 mice and 14 sessions binned by position along the linear track (see Methods for inclusion criteria). G.) Mean difference in population ΔF/F between the dSPNs and iSPNs in F binned by track position. Blue lines indicate bins where dSPN ΔF/F > iSPN, orange lines iSPN>dSPN (p < 0.05, t-tests on model coefficients, Bonferroni corrected for multiple comparisons). H-I.) Same as F-G for position-tuned, non-track sensitive dSPNs (blue, n = 183) and iSPNs (orange, n = 205) from 3 mice and 14 sessions. Shaded regions in all plots are the 95% confidence intervals of the fitted model coefficients from the linear mixed effect model (see Methods).

Similar articles

References

    1. Mink J. W. THE BASAL GANGLIA: FOCUSED SELECTION AND INHIBITION OF COMPETING MOTOR PROGRAMS. Prog. Neurobiol. 50, 381–425 (1996). - PubMed
    1. Graybiel A. M., Aosaki T., Flaherty A. W. & Kimura M. The basal ganglia and adaptive motor control. Science 265, 1826–1831 (1994). - PubMed
    1. Robbe D. To move or to sense? Incorporating somatosensory representation into striatal functions. Curr. Opin. Neurobiol. 52, 123–130 (2018). - PubMed
    1. Xiong Q., Znamenskiy P. & Zador A. M. Selective corticostriatal plasticity during acquisition of an auditory discrimination task. Nature 521, 348–351 (2015). - PMC - PubMed
    1. Sippy T., Lapray D., Crochet S. & Petersen C. C. H. Cell-Type-Specific Sensorimotor Processing in Striatal Projection Neurons during Goal-Directed Behavior. Neuron 88, 298–305 (2015). - PMC - PubMed

Publication types

LinkOut - more resources