[Preprint]. 2024 Nov 12:2024.10.25.620344.
doi: 10.1101/2024.10.25.620344.

Systemic inflammation and lymphocyte activation precede rheumatoid arthritis

Ziyuan He  1 Marla C Glass  1 Pravina Venkatesan  1 Marie L Feser  2 Leander Lazaro  3 Lauren Y Okada  1 Nhung T T Tran  1 Yudong D He  1 Samir Rachid Zaim  1 Christy E Bennett  1 Padmapriyadarshini Ravisankar  1 Elisabeth M Dornisch  1 Najeeb A Arishi  2 Ashley G Asamoah  2 Saman Barzideh  2 Lynne A Becker  1 Elizabeth A Bemis  2 Jane H Buckner  4 Christopher E Collora  2 Megan A L Criley  2 M Kristen Demoruelle  2 Chelsie L Fleischer  2 Jessica Garber  1 Palak C Genge  1 Qiuyu Gong  1 Lucas T Graybuck  1 Claire E Gustafson  1 Brian C Hattel  2 Veronica Hernandez  1 Alexander T Heubeck  1 Erin K Kawelo  1 Upaasana Krishnan  1 Emma L Kuan  1 Kristine A Kuhn  2 Christian M LaFrance  1 Kevin J Lee  1 Ruoxin Li  1 Cara Lord  1 Regina R Mettey  1 LauraKay Moss  2 Blessing Musgrove  1 Kathryn Nguyen  3 Andrea Ochoa  3 Vaishnavi Parthasarathy  1 Mark-Phillip Pebworth  1 Chong Pedrick  2 Tao Peng  1 Cole G Phalen  1 Julian Reading  1 Charles R Roll  1 Jennifer A Seifert  2 Marguerite D Siedschlag  2 Cate Speake  4 Christopher C Striebich  2 Tyanna J Stuckey  1 Elliott G Swanson  1 Hideto Takada  2 Tylor Thai  2 Zachary J Thomson  1 Nguyen Trieu  3 Vlad Tsaltskan  3 Wei Wang  3 Morgan D A Weiss  1 Amy Westermann  3 Fan Zhang  2 David L Boyle  3 Ananda W Goldrath  1 Thomas F Bumol  1 Xiao-Jun Li  1 V Michael Holers  2 Peter J Skene  1 Adam K Savage  1 Gary S Firestein  3 Kevin D Deane  2 Troy R Torgerson  1 Mark A Gillespie  1
Affiliations

Systemic inflammation and lymphocyte activation precede rheumatoid arthritis

Ziyuan He et al. bioRxiv. .

Abstract

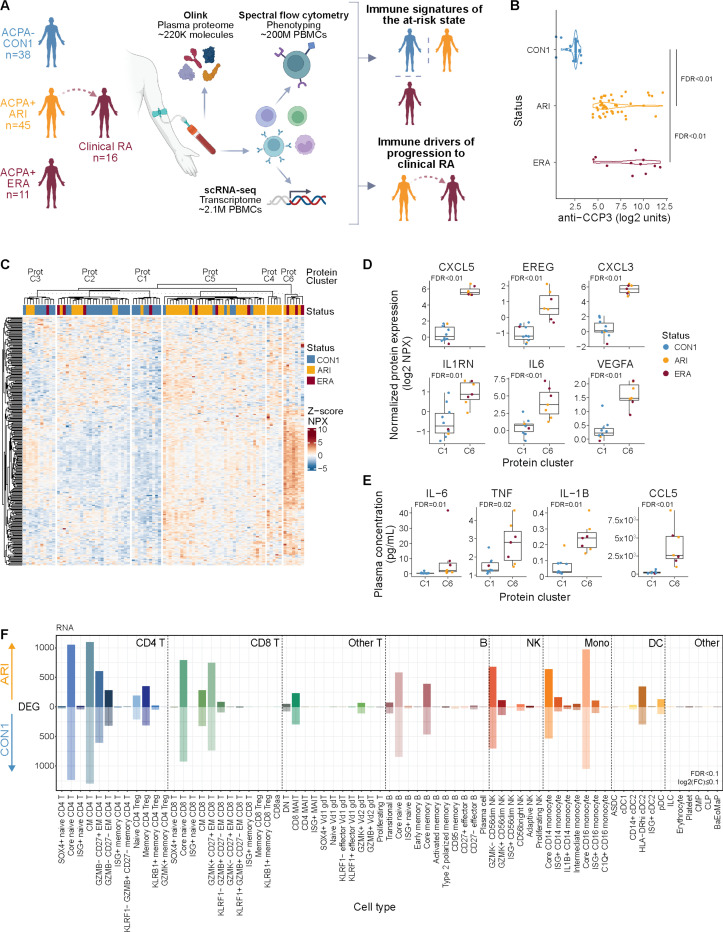
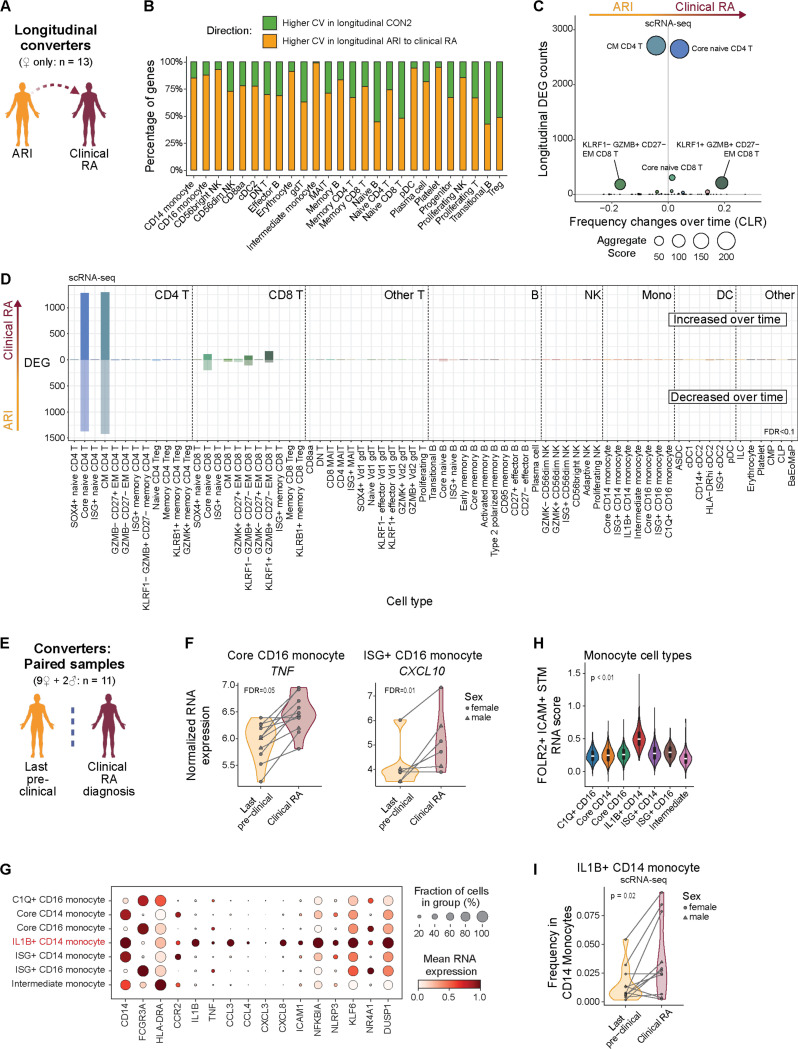
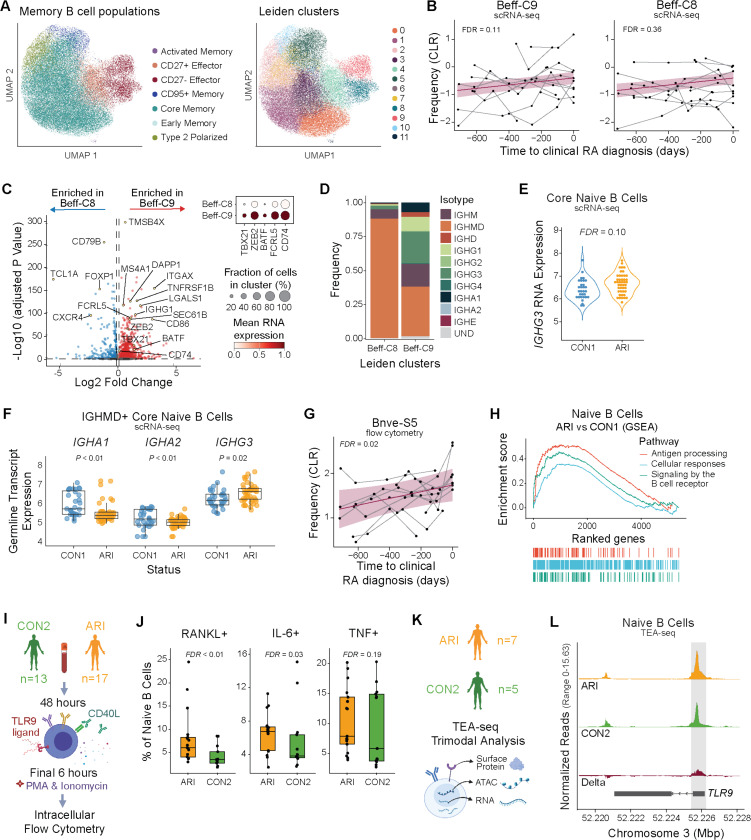
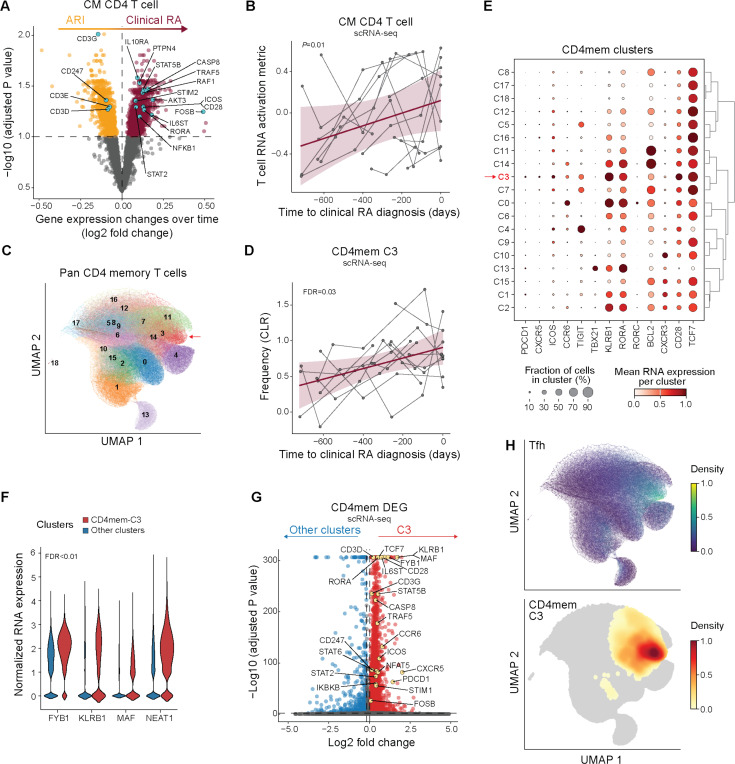
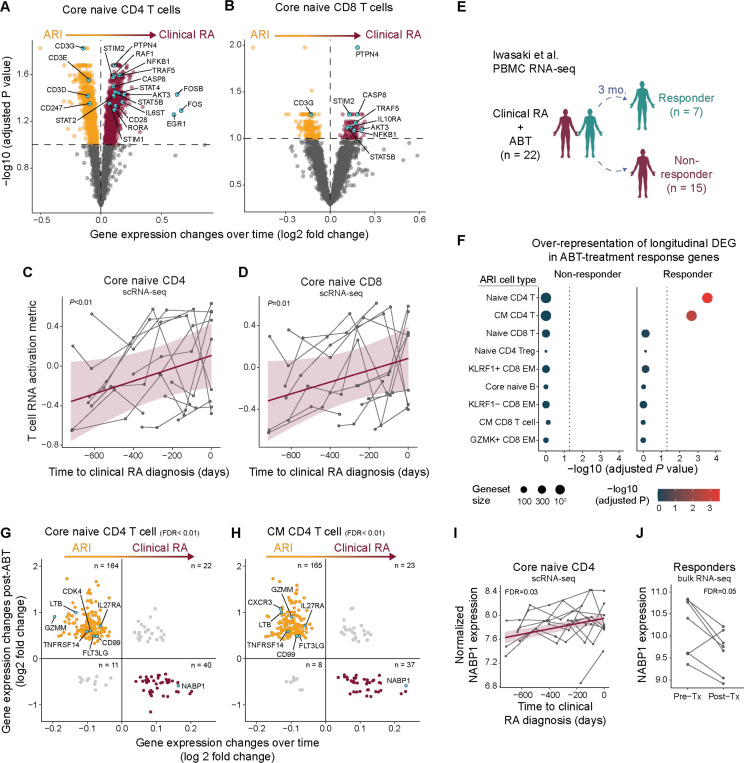
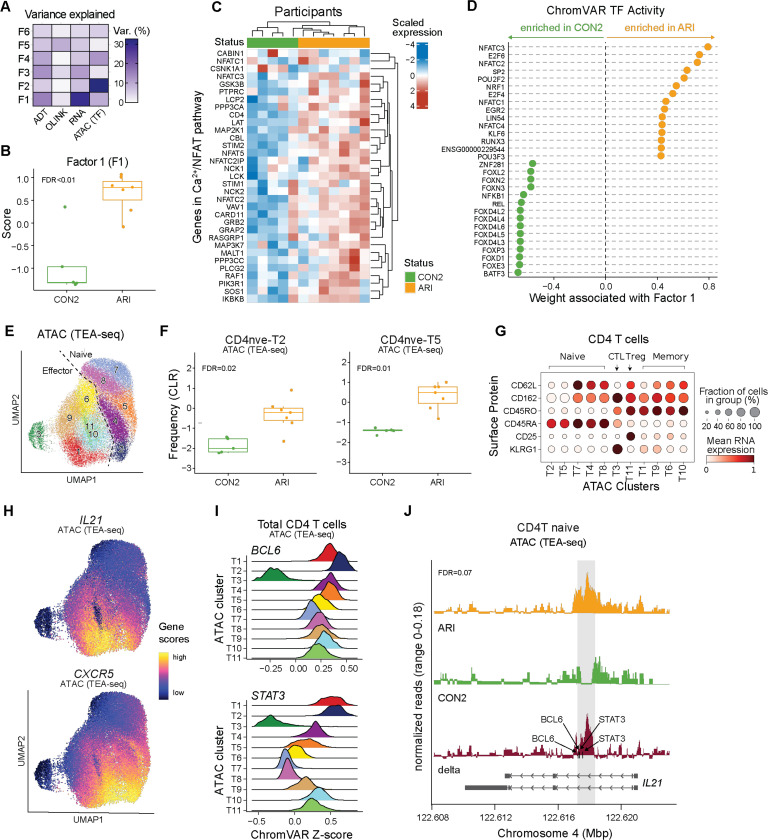
Some autoimmune diseases, including rheumatoid arthritis (RA), are preceded by a critical subclinical phase of disease activity. Proactive clinical management is hampered by a lack of biological understanding of this subclinical 'at-risk' state and the changes underlying disease development. In a cross-sectional and longitudinal multi-omics study of peripheral immunity in the autoantibody-positive at-risk for RA period, we identified systemic inflammation, proinflammatory-skewed B cells, expanded Tfh17-like cells, epigenetic bias in naive T cells, TNF+IL1B+ monocytes resembling a synovial macrophage population, and CD4 T cell transcriptional features resembling those suppressed by abatacept (CTLA4-Ig) in RA patients. Our findings characterize pathogenesis prior to clinical diagnosis and suggest the at-risk state exhibits substantial immune alterations that could potentially be targeted for early intervention to delay or prevent autoimmunity. We provide a suite of tools at https://apps.allenimmunology.org/aifi/insights/ra-progression/ to facilitate exploration and enhance accessibility of this extensive dataset.


Figures

Fig. 1:
Fig. 1:. Active inflammation in ARI
(A) Overview of study and multimodal workflow. CON1, controls; ARI, at-risk individuals; ERA, early RA. (B) First sample (baseline) anti-CCP3 measurements from CON1, ARI, ERA. (C) k-means clustering (k=6) of z-scored normalized protein expression (NPX) values from differential proteins in ARI vs. CON1 (FDR < 0.1) and ERA vs. CON1 (FDR < 0.15). Rows denote proteins, columns denote baseline samples. (D) Abundance of select inflammatory plasma proteins elevated in ARI. Dots represent participant samples in each cluster. (E) Absolute concentration of select plasma proteins from participants in Prot-C1 and Prot-C6 clusters as assayed by MSD or LegendPlex. (F) Number of differentially expressed genes (DEGs; FDR < 0.1 and absolute log2 fold change ≥ 0.1) per immune cell type, elevated in ARI (above 0) or CON1 (below 0). Cell types are based on (24). Boxplots show median (centerline), first and third quartiles (lower and upper bound of the box) and whiskers show the 1.5x interquartile range of data. Effect sizes and P values for C,F were determined by linear regression models. Remaining comparisons were made using the Kruskal-Wallis test with Dunn’s post-hoc testing (B) or Wilcoxon rank-sum test (D-E). FDR values are indicated for all panels.
Fig. 2:
Fig. 2:. Longitudinal changes in naive and CM CD4 T cells dominate progression to clinical RA.
(A) Overview of longitudinal comparison of converters, from ‘at-risk’ to clinical RA. (B) Number of genes per Allen Institute for Immunology level 2 cell type with higher average intra-donor coefficients of variation (CVs) over time in ARI who progress to clinical RA (orange) or in CON2 (green). (C) Comparison of the number of differentially expressed genes (DEGs) (y-axis) with the change in frequency over time (x-axis; centered log-ratio (CLR) transformed) as ARI progress to clinical RA. Bubble size corresponds to the aggregate score calculated by [-log(padj CLR frequency changes) x total number of DEGs]. (D) Number of DEGs from longitudinal model (FDR<0.1) per level 3 immune cell type, elevated (above 0) or diminished (below 0) in ARI progressing to clinical RA. (E-I) Overview (E) of paired comparison in converters at their last ‘at-risk’ pre-symptomatic visit vs. time of their clinical RA diagnosis. (F) Normalized RNA expression of TNF in Core CD16 monocytes and CXCL10 in ISG+ CD16 monocytes. (G) Mean RNA expression of select inflammatory genes amongst monocyte level 3 cell types. (H) Gene scores calculated by comparing marker genes from FOLR2+ICAM+ RA synovial tissue macrophages (Alivernini 2020) among all monocyte cell types. (I) Frequency of IL1B+ CD14 monocytes within CD14 monocytes. Effect sizes and P values were determined by linear mixed effect models (C,D), paired Wald test (F), or paired Wilcoxon test (I). FDR values are indicated for all panels.
Fig. 3:
Fig. 3:. The B cell compartment exhibits a pro-inflammatory skewing during progression to clinical RA.
(A) UMAP plots of memory B cells from ARI and CON1 showing B cell population labels (left) and Leiden clusters (right). (B) Centered log-ratio (CLR)-transformed frequencies of Beff-C9 (P=0.055; FDR=0.111) and Beff-C8 (P=0.359; FDR=0.359) as ARI progress to clinical RA. Each participant’s longitudinal series is connected by a gray line, with a group trendline and 95% confidence interval in purple. (C) DEGs for Beff-C8 compared to Beff-C9 in ARI samples with selected genes labeled (left). Dot size in heatmap (right) indicates the fraction of cells with positive expression for selected genes. (D) IgH isotype or undetermined (UND) identity, as frequency within each population, for Beff-C8 and Beff-C9. (E) IGHG3 gene expression by Naive B cells (P=0.03; FDR=0.10) of ARI and CON1. (F) Normalized expression of IgH germline transcription (GLT) from IGHMD+ naive B cells in ARI and CON1. (G) CLR-transformed flow cytometry frequencies of Bnve-S5 as ARI progress to clinical RA, as in (B). (H) GSEA enrichment analysis with the top Reactome pathways among naive B cells of ARI compared to CON1. (I-J) B cells were stimulated ex vivo and analyzed by intracellular flow cytometry. Experimental workflow (I) and IL-6+, RANKL+, and TNF+ cell frequencies within the stimulated naive B cell populations of ARI and CON2 (J). (K) PBMC TEA-seq experiment overview. (L) Chromatin accessibility tracks from TEA-seq showing the TLR9 gene in naive B cells of ARI (orange), CON2 (green) and the delta between groups (red). The gray box highlights the region containing differentially accessible peaks between groups (P=0.02; FDR=0.19). Boxplots show median (centerline), first and third quartiles (lower and upper bound of the box) and whiskers show the 1.5x interquartile range of data. P values were determined by a linear mixed model (B), Wald test (E,F), Wilcoxon rank-sum test (J), or zero-inflated Wilcoxon test (L). FDR values are indicated for all panels.
Fig. 4:
Fig. 4:. Expansion of effector and memory T cells with pathogenic signatures during progression to clinical RA.
(A) RNA expression differences in central memory (CM) CD4 T cells over time in ARI (orange) who progress to clinical RA (purple). Genes associated with T cell activation are noted. (B) T cell RNA activation metric in CD4 CM over time as ARI progress to clinical RA. Each participant’s longitudinal series is connected by a gray line, with a group trendline and 95% confidence interval in purple. (C) UMAP showing Leiden clustering of non-negative matrix factorization (NMF)-projected CD4 reference gene weights on pan CD4 memory T cells (CD4mem). Cluster 3 (CD4mem-C3) is indicated (arrow). (D) Frequency over time in CD4mem-C3 cells as ARI progress to clinical RA, as in (B). (E) Mean RNA expression of select genes across CD4mem clusters. (F) Normalized RNA expression of genes that promote differentiation to Tfh and Th17 cells in CD4mem-C3 (red) vs. remaining CD4mem clusters (blue). (G) Differentially expressed genes between CD4mem-C3 (red) and remaining CD4mem clusters (blue). Select genes associated with T cell activation are labeled. (H) Cells expressing Tfh gene program are distinguished based on the NMF projection using a pre-computed weight matrix of CD4 T cell population from Yasumizu et al. 2024. For comparison, a UMAP density plot of cluster CD4mem-C3 is shown below. P values were determined by linear mixed models (A, B, D) or the Wilcoxon rank-sum test (F-G). Nominal P value is indicated for (B). FDR values are indicated for (A, D, F, G).
Fig. 5:
Fig. 5:. Activation signature in naive T cells during progression to clinical RA.
(A-B) RNA expression differences in core naive CD4 (A) or CD8 (B) T cells over time in ARI (orange) who progress to clinical RA (purple). Genes associated with T cell activation are annotated. (C-D) T cell RNA activation metric in core naive CD4 (C) or CD8 (D) T cells over time as ARI progress to clinical RA. (E-H) Longitudinal DEGs as ARI progress to clinical RA were assessed within the context of RA patients with efficacious (responders) or non-efficacious (non-responders) clinical response to abatacept (ABT) treatment (from Iwasaki et al. 2024). (E) Overview of the analysis strategy. (F) Over-representation of ARI cell type-specific longitudinal DEG amongst ABT-treatment response DEG. (G-H) Significant DEGs in ABT responders compared to DEG changes over time as ARI progress to clinical RA in core naive CD4 T cells (G) and CM CD4 T cells (H). Genes (dots) previously implicated in RA-like disease are labeled. (I-J) Normalized RNA expression of NABP1 over time as ARI progress to clinical RA (I) and pre- vs. post-ABT therapy in RA patients (J). P values were determined by linear mixed models (A-D, I), hypergeometric enrichment tests (F), McNemar’s Chi-squared test (G-H), Wald test (J). Nominal P values are indicated for (C-D). FDR values are indicated for (A, B, F-J).
Fig. 6:
Fig. 6:. Epigenetic changes in naive CD4 T cells support activation and Tfh bias in ARI.
PBMC TEA-seq experiment in a subset of ARI and CON2 samples was performed as in Fig. 3K. (A) Percentage of variance in each modality (surface protein, plasma protein, RNA, ATAC) explained by Multi-Omics Factor Analysis (MOFA) factors. (B) Factor 1 scores between ARI and CON2. (C) Scaled normalized expression of select genes in Calcium–Calcineurin–NFAT pathway in ARI and CON2. (D) Inferred accessibility for the top 15 transcription factors (TFs) positively or negatively associated with factor 1, ranked by weight. (E) Louvain clusters in CD4 T cells by ATAC modality in TEA-seq. (F) Centered log-ratio (CLR)-transformed frequencies of ATAC clusters CD4nve-T2 and CD4nve-T5 in CD4 T cells. (G) Mean surface protein expression of select markers differentiating CD4 naive, memory, Treg, and cytotoxic CD4 T cells (CTL) across ATAC clusters. (H) ATAC UMAP overlaid with inferred gene activity scores calculated by ArchR for CXCR5 and IL21. (I) ChromVAR TF activity z scores of BCL6 and STAT3 in CD4 T cells. (J) ATAC signal in ARI (orange), CON2 (green), and delta (red) at the IL21 locus. The gray box highlights a 500bp region containing differentially accessible peaks between ARI and CON2 (chr4: 122,617,500–122,617,999). Black arrows indicate the motif locations of BCL6 and STAT3 binding sites. Gene bodies are displayed on the bottom. Boxplots show median (centerline), first and third quartiles (lower and upper bound of the box) and whiskers show the 1.5x interquartile range of data. P values were determined by linear models (B, F) or zero-inflated Wilcoxon test (J). FDR values are indicated.

References

    1. Combe B., Landewe R., Daien C. I., Hua C., Aletaha D., Álvaro-Gracia J. M., Bakkers M., Brodin N., Burmester G. R., Codreanu C., Conway R., Dougados M., Emery P., Ferraccioli G., Fonseca J., Raza K., Silva-Fernández L., Smolen J. S., Skingle D., Szekanecz Z., Kvien T. K., van A. der Helm-van Mil, van Vollenhoven R., 2016 update of the EULAR recommendations for the management of early arthritis. Ann. Rheum. Dis. 76, 948–959 (2017). - PubMed
    1. Herold K. C., Bundy B. N., Long S. A., Bluestone J. A., DiMeglio L. A., Dufort M. J., Gitelman S. E., Gottlieb P. A., Krischer J. P., Linsley P. S., Marks J. B., Moore W., Moran A., Rodriguez H., Russell W. E., Schatz D., Skyler J. S., Tsalikian E., Wherrett D. K., Ziegler A.-G., Greenbaum C. J., Type 1 Diabetes TrialNet Study Group, An Anti-CD3 Antibody, Teplizumab, in Relatives at Risk for Type 1 Diabetes. N. Engl. J. Med. 381, 603–613 (2019). - PMC - PubMed
    1. Buch M. H., Defining refractory rheumatoid arthritis. Ann. Rheum. Dis. 77, 966–969 (2018). - PubMed
    1. Rantapää-Dahlqvist S., de Jong B. A. W., Berglin E., Hallmans G., Wadell G., Stenlund H., Sundin U., van Venrooij W. J., Antibodies against cyclic citrullinated peptide and IgA rheumatoid factor predict the development of rheumatoid arthritis. Arthritis Rheum. 48, 2741–2749 (2003). - PubMed
    1. Nielen M. M. J., van Schaardenburg D., Reesink H. W., van de Stadt R. J., van der Horst-Bruinsma I. E., de Koning M. H. M. T., Habibuw M. R., Vandenbroucke J. P., Dijkmans B. A. C., Specific autoantibodies precede the symptoms of rheumatoid arthritis: a study of serial measurements in blood donors. Arthritis Rheum. 50, 380–386 (2004). - PubMed

Publication types