[Preprint]. 2024 Nov 2:2024.11.01.620405.
doi: 10.1101/2024.11.01.620405.

Gene expression and DNA methylation changes in response to hypoxia in toxicant-adapted Atlantic killifish (Fundulus heteroclitus)

Affiliations

Gene expression and DNA methylation changes in response to hypoxia in toxicant-adapted Atlantic killifish (Fundulus heteroclitus)

Neelakanteswar Aluru et al. bioRxiv. .

Update in

Abstract

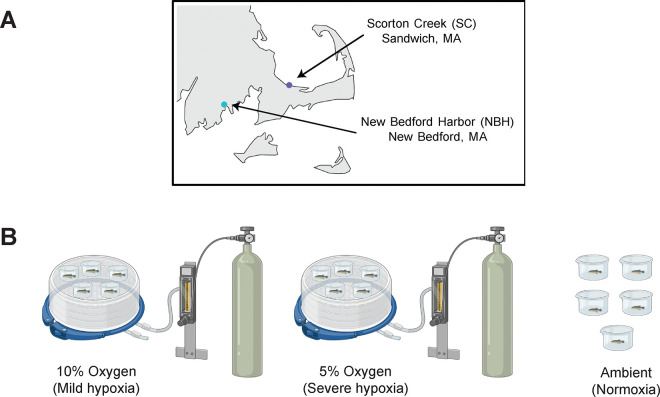
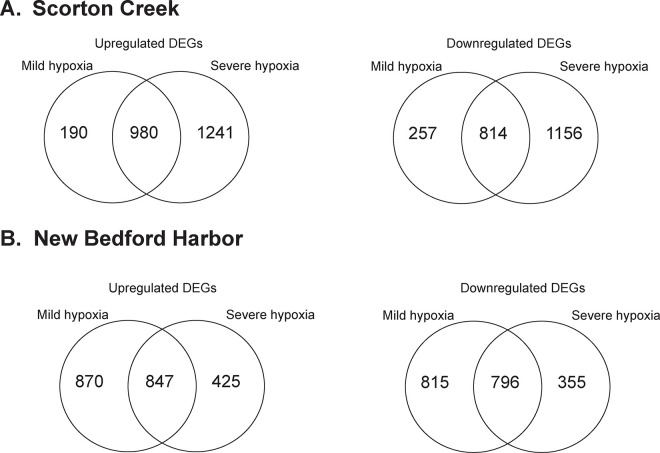
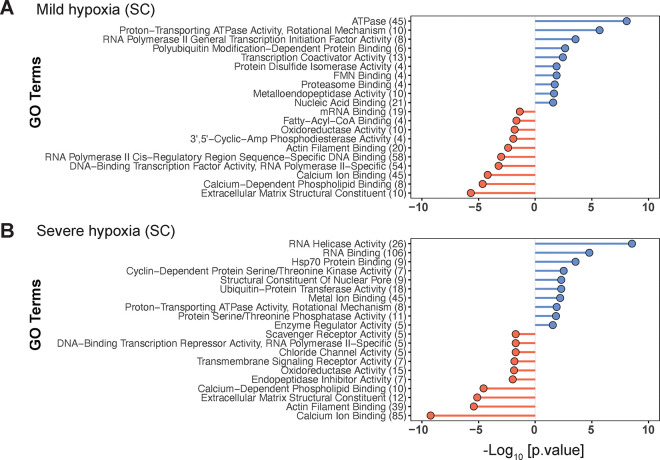
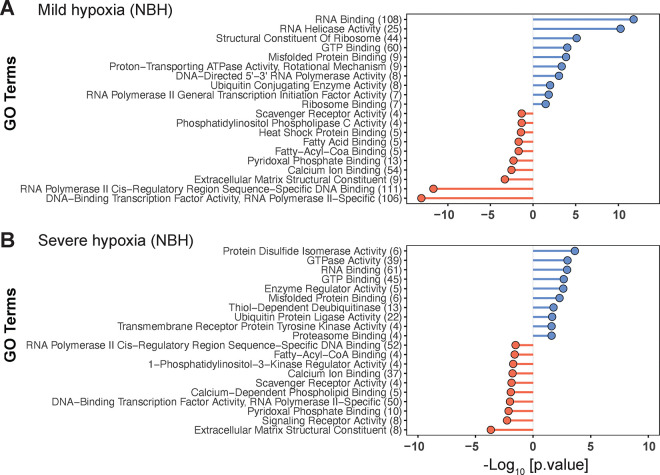
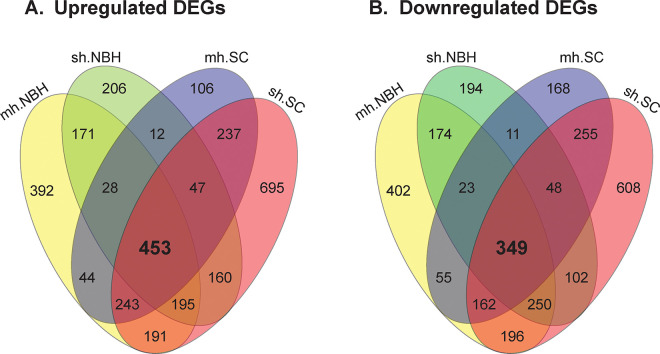
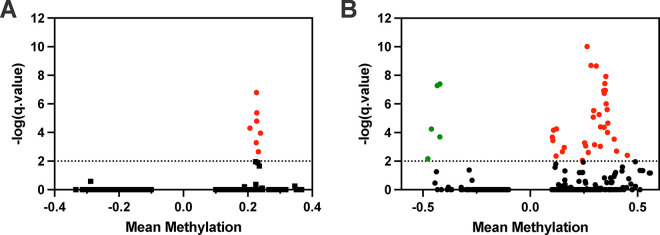
Coastal fish populations are threatened by multiple anthropogenic impacts, including the accumulation of industrial contaminants and the increasing frequency of hypoxia. Some populations of the Atlantic killifish (Fundulus heteroclitus), like those in New Bedford Harbor (NBH), Massachusetts, have evolved a resistance to dioxin-like polychlorinated biphenyls (PCBs) that may influence their ability to cope with secondary stressors. To address this question, we compared hepatic gene expression and DNA methylation patterns in response to mild or severe hypoxia in killifish from NBH and Scorton Creek (SC), a reference population from a relatively pristine environment. We hypothesized that NBH fish would show altered responses to hypoxia due to trade-offs linked to toxicant resistance. Our results revealed substantial differences between populations. SC fish demonstrated a dose-dependent changes in gene expression in response to hypoxia, while NBH fish exhibited a muted transcriptional response to severe hypoxia. Interestingly, NBH fish showed significant DNA methylation changes in response to hypoxia, while SC fish did not exhibit notable epigenetic alterations. These findings suggest that toxicant-adapted killifish may face trade-offs in their molecular response to environmental stress, potentially impacting their ability to survive severe hypoxia in coastal habitats. Further research is needed to elucidate the functional implications of these epigenetic modifications and their role in adaptive stress responses.

Keywords: DNA methylation; Hypoxia; Mummichog; RNAseq; cost of tolerance; evolved resistance.


Figures

Figure 1.
Figure 1.
Experimental overview. (A) Map of Southeastern Massachusetts showing the collection sites of sensitive (Scorton Creek (SC), Sandwich, MA) and resistant (New Bedford Harbor (NBH), New Bedford, MA) Atlantic killifish. (B) Illustration of the experimental setup. Mild and severe hypoxia exposures were conducted by pumping oxygen containing either 5% or 10% air saturation into the chambers, respectively. Control group was maintained outside under ambient conditions.
Figure 2.
Figure 2.
Differentially expressed genes in response to hypoxia in NBH and SC fish. Venn diagrams showing unique and common genes in response to mild and severe hypoxia in (A) SC fish and (B) NBH fish.
Figure 3.
Figure 3.
Gene Ontology (Molecular Function) terms enriched among differentially expressed genes (DEGs) in mild hypoxia (A) and severe hypoxia (B) treatment groups in SC fish. Only top 10 terms enriched among up- and down-regulated genes are shown. Entire list of GO biological process and molecular function terms are provided in the supplementary information. The numbers in the parenthesis represent the number of DEGs represented in each GO term. Detailed description of filtering of GO terms to remove redundancy is described in the materials and methods section. GO terms enriched among upregulated DEGs are in blue and those from downregulated genes are in red.
Figure 4.
Figure 4.
Gene Ontology (Molecular Function) terms enriched among differentially expressed genes (DEGs) in mild hypoxia (A) and severe hypoxia (B) treatment groups in NBH fish. Only top 10 terms enriched among up- and down-regulated genes are shown. Entire list of GO biological process and molecular function terms are provided in the supplementary information. The numbers in the parenthesis represent the number of DEGs represented in each GO term. Detailed description of filtering of GO terms to remove redundancy is described in the materials and methods section. GO terms enriched among upregulated DEGs are in blue and those from downregulated genes are in red.
Figure 5.
Figure 5.
Reaction norm plots showing gene expression patterns in response to two levels of hypoxia in NBH and SC fish. Mean expression (Log counts per million (cpm)) of all the differential expressed genes in response to mild and severe hypoxia were plotted for up- (A) and downregulated (B) genes in NBH and SC fish.
Figure 6.
Figure 6.
Comparison of all treatment groups. Venn diagram of upregulated (A) and downregulated (B) genes in all treatment groups revealed a core set of genes (802 DEGs) altered by hypoxia exposure irrespective of the level of hypoxia and population. GO analysis and heatmap representation of these core genes are provided in the supplementary information.
Figure 7.
Figure 7.
DNA methylation landscape in F. heteroclitus. (A) CpG DNA methylation density plots showing proportion of CpG methylation in different population and treatment groups. Inset shows the density plots of CpG sites with methylation levels below 25%. (B) Percent of methylated (>0% methylation; dark grey) and unmethylated (0% methylated; light grey) CpGs in various population and treatment groups. The average number of methylated and unmethylated CpGs are shown.
Figure 8.
Figure 8.
Volcano plot showing differentially methylated regions (DMRs) in response to (A) 10% (mild) and (B) 5% (severe) hypoxia exposure in New Bedford Harbor fish. Mean methylation difference (x-axis) between severe hypoxia and control group is plotted against q-value (y-axis). Each green and red spot represents a statistically significant hypo- and hypermethylated region, respectively.

Similar articles

References

    1. Wallace RB, Gobler CJ. 2021. The role of algal blooms and community respiration in controlling the temporal and spatial dynamics of hypoxia and acidification in eutrophic estuaries. Marine Pollution Bulletin, 172: 112908. - PubMed
    1. Borowiec BG, Hoffman RD, Hess CD, Galvez F, Scott GR. 2020. Interspecific variation in hypoxia tolerance and hypoxia acclimation responses in killifish from the family Fundulidae. J Exp Biol, 223(Pt 4). - PMC - PubMed
    1. Borowiec BG, McClelland GB, Rees BB, Scott GR. 2018. Distinct metabolic adjustments arise from acclimation to constant hypoxia and intermittent hypoxia in estuarine killifish (Fundulus heteroclitus). J Exp Biol, 221(Pt 23). - PubMed
    1. Borowiec BG, Scott GR. 2020. Hypoxia acclimation alters reactive oxygen species homeostasis and oxidative status in estuarine killifish (Fundulus heteroclitus). J Exp Biol, 223(Pt 13). - PubMed
    1. Reid NM, Proestou DA, Clark BW, Warren WC, Colbourne JK, Shaw JR, Karchner SI, Hahn ME, Nacci D, Oleksiak MF, Crawford DL, Whitehead A. 2016. The genomic landscape of rapid repeated evolutionary adaptation to toxic pollution in wild fish. Science, 354(6317): 1305–1308. - PMC - PubMed

Publication types

LinkOut - more resources