[Preprint]. 2024 Nov 3:2024.11.02.621694.
doi: 10.1101/2024.11.02.621694.

Single-cell DNA methylome and 3D genome atlas of the human subcutaneous adipose tissue

Affiliations

Single-cell DNA methylome and 3D genome atlas of the human subcutaneous adipose tissue

Zeyuan Johnson Chen et al. bioRxiv. .

Update in

  • Single-cell DNA methylome and 3D genome atlas of human subcutaneous adipose tissue.
    Chen ZJ, Das SS, Kar A, Lee SHT, Abuhanna KD, Alvarez M, Sukhatme MG, Wang Z, Gelev KZ, Heffel MG, Zhang Y, Avram O, Rahmani E, Sankararaman S, Laakso M, Heinonen S, Peltoniemi H, Halperin E, Pietiläinen KH, Luo C, Pajukanta P. Chen ZJ, et al. Nat Genet. 2025 Sep;57(9):2238-2249. doi: 10.1038/s41588-025-02300-4. Epub 2025 Aug 20. Nat Genet. 2025. PMID: 40835891 Free PMC article.

Abstract

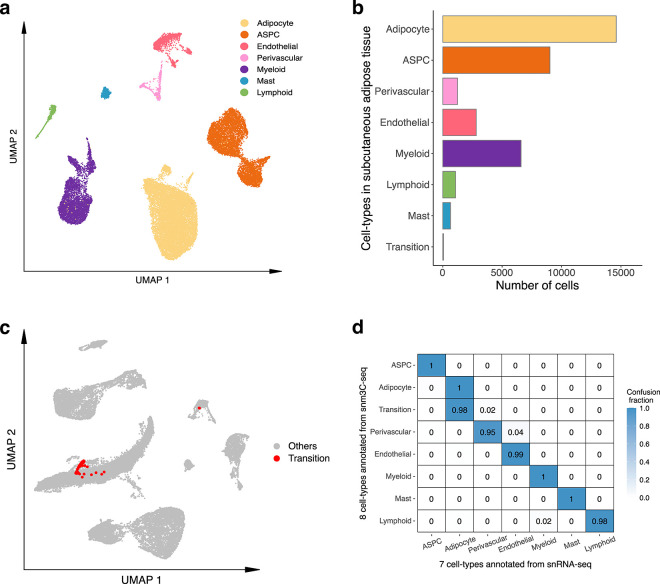
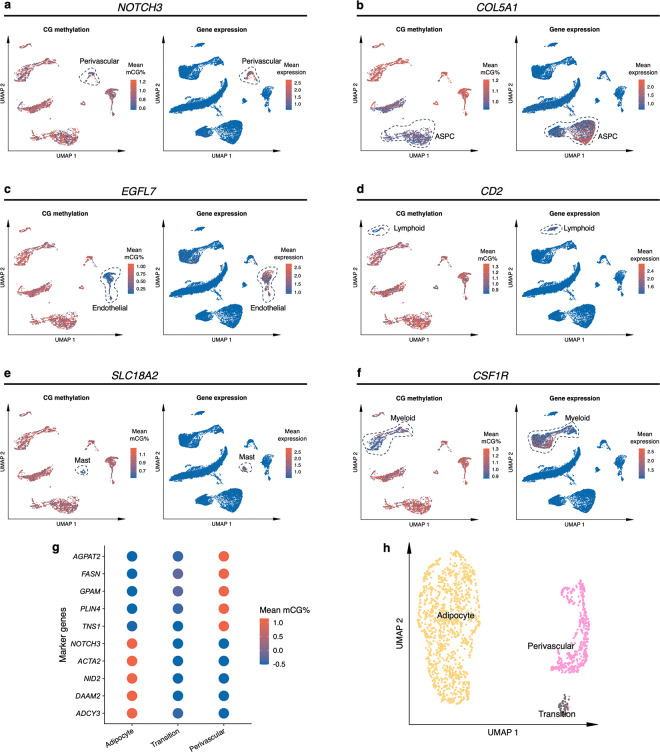
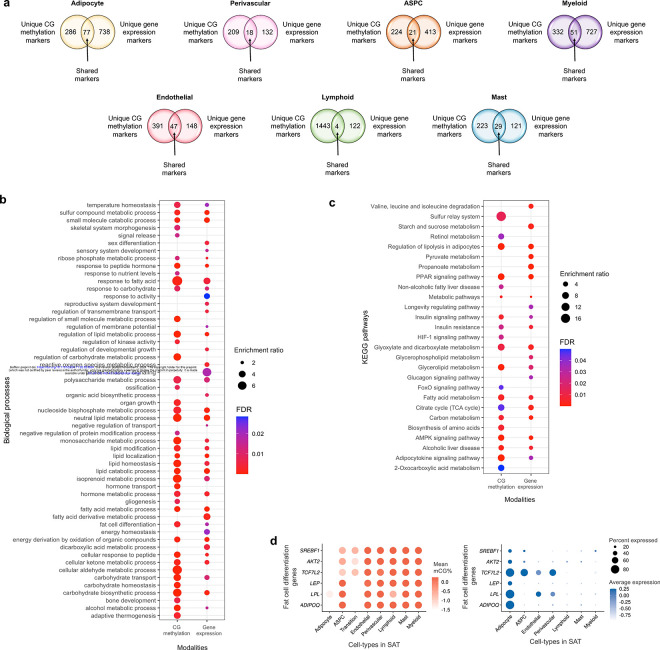
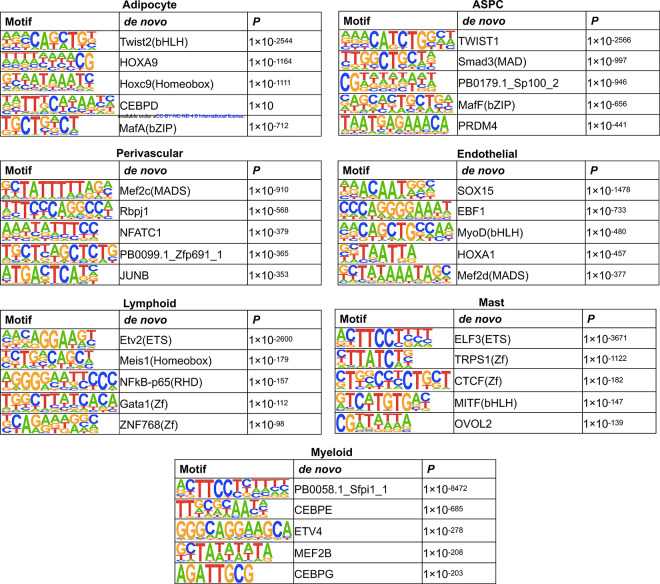
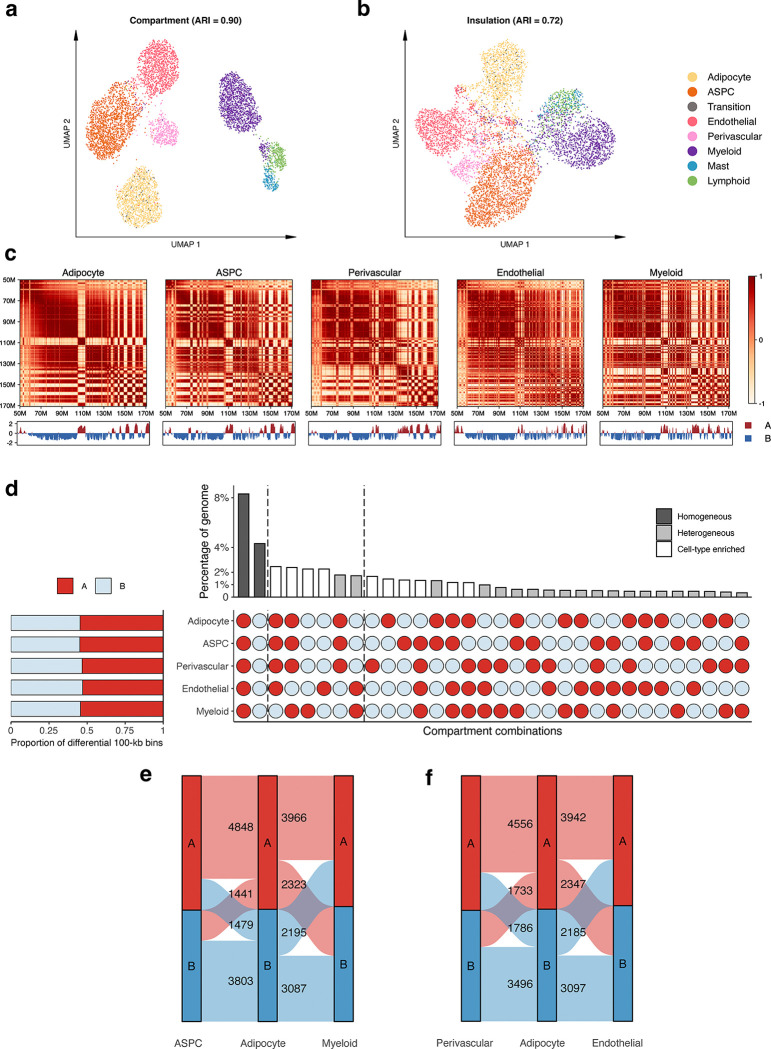
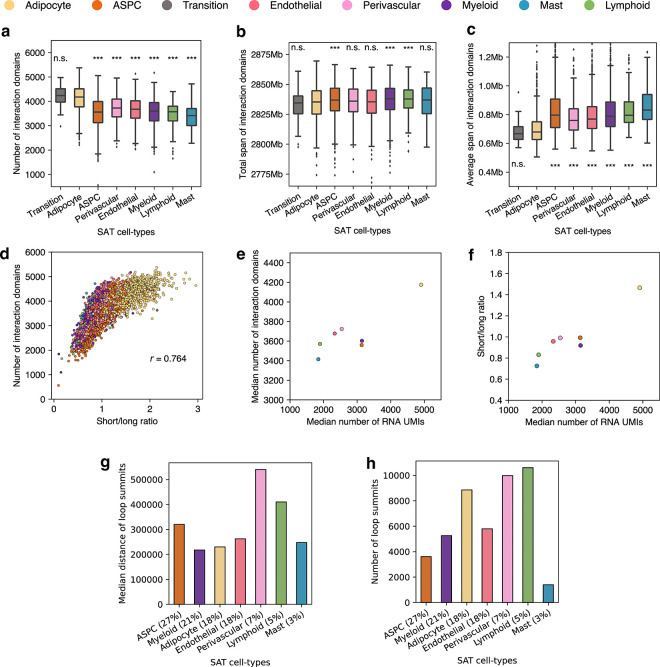
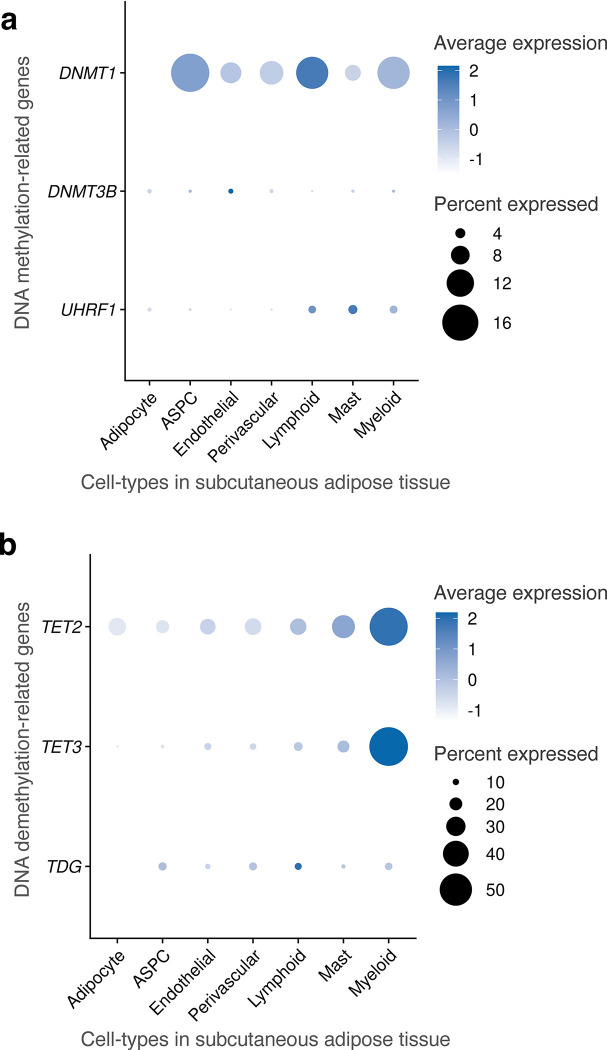
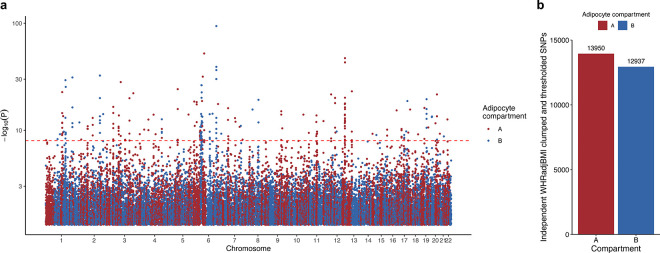
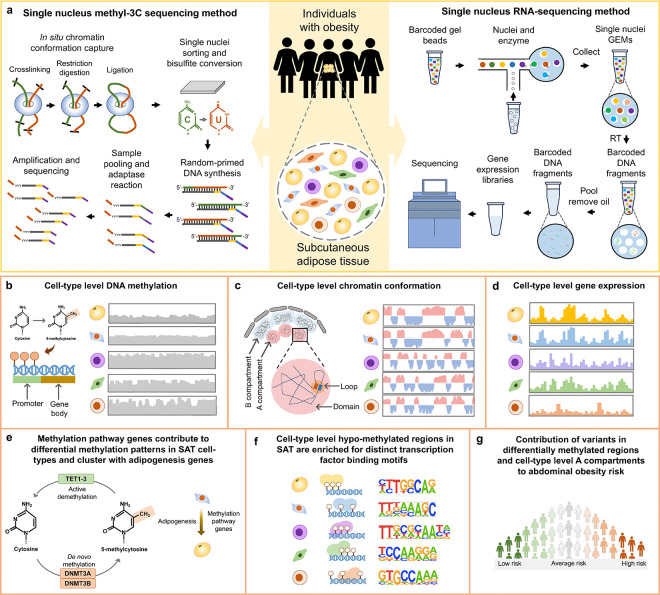
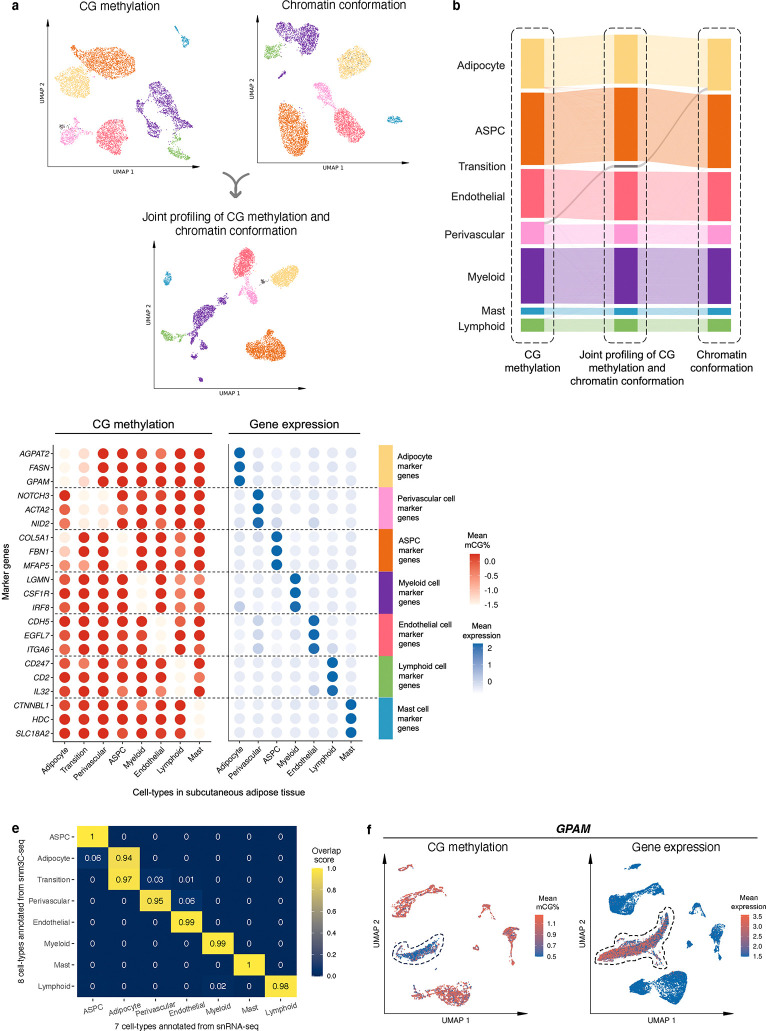
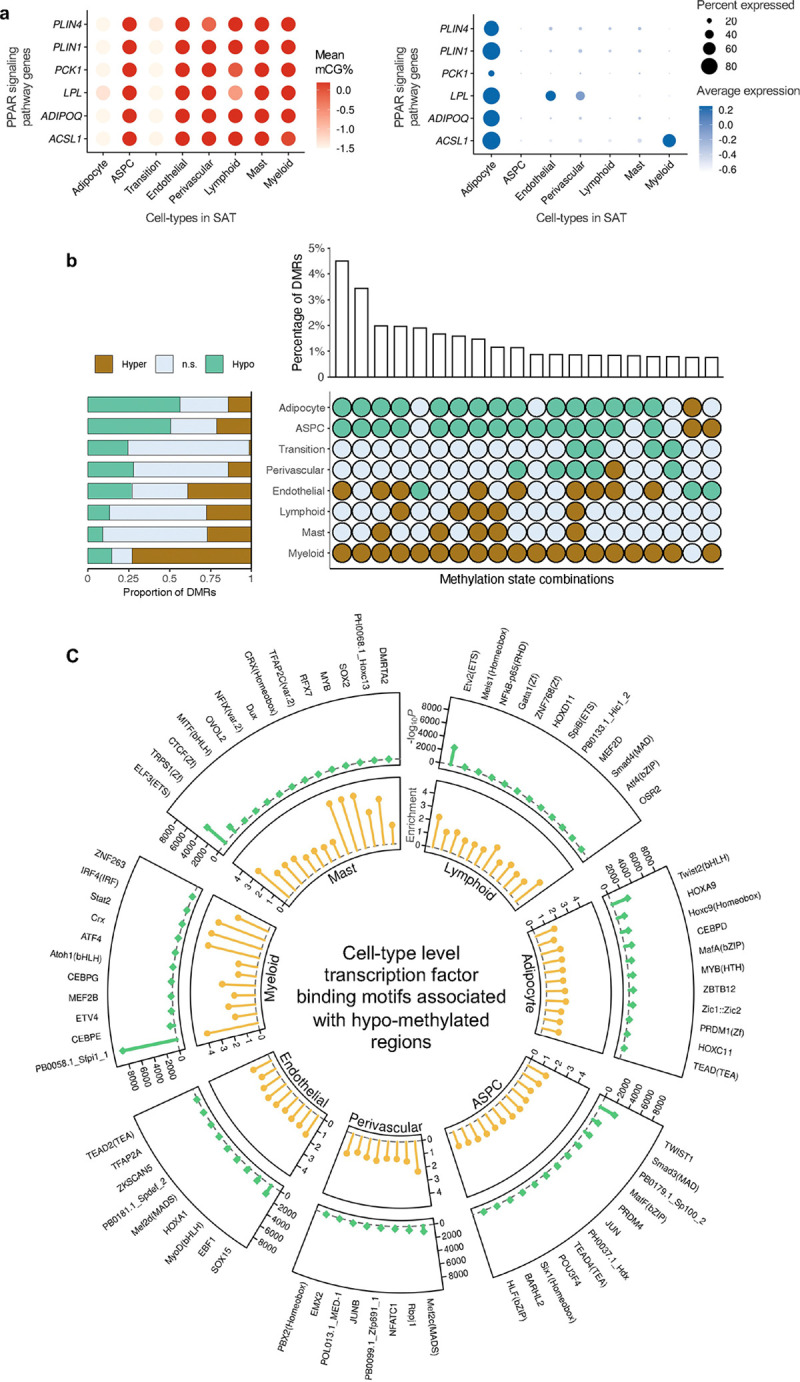
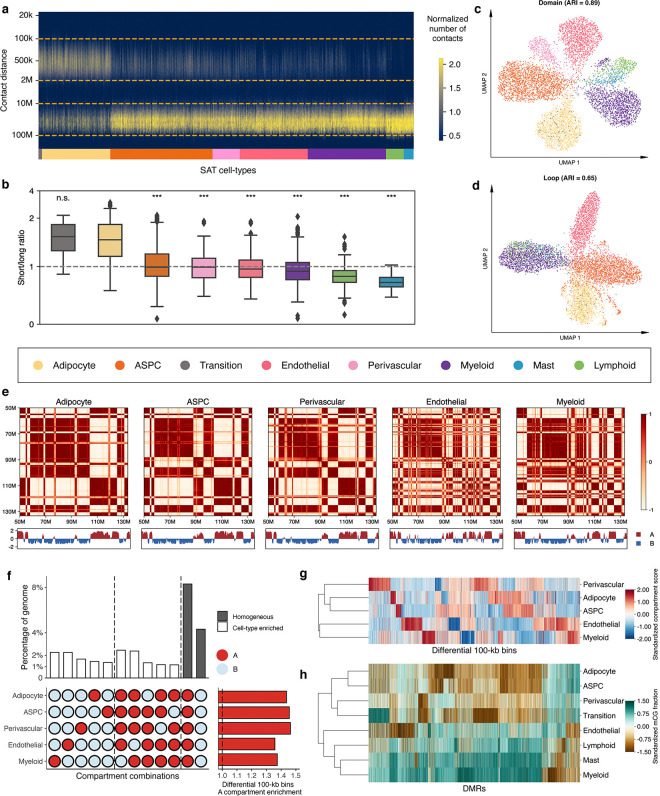
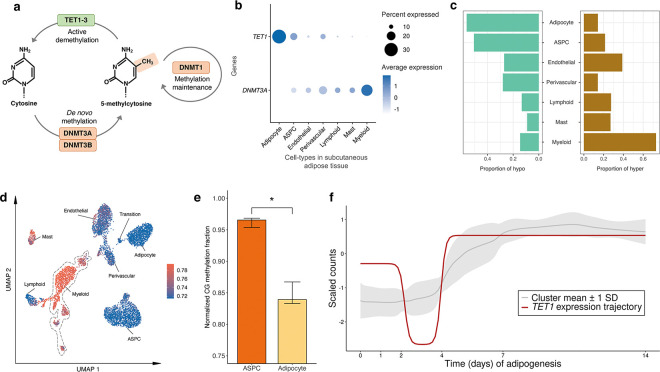
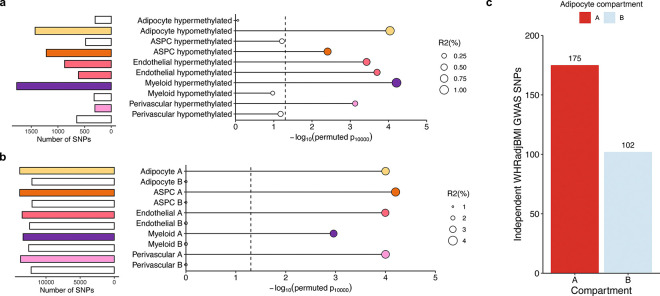
Human subcutaneous adipose tissue (SAT) contains a diverse array of cell-types; however, the epigenomic landscape among the SAT cell-types has remained elusive. Our integrative analysis of single-cell resolution DNA methylation and chromatin conformation profiles (snm3C-seq), coupled with matching RNA expression (snRNA-seq), systematically cataloged the epigenomic, 3D topology, and transcriptomic dynamics across the SAT cell-types. We discovered that the SAT CG methylation (mCG) landscape is characterized by pronounced hyper-methylation in myeloid cells and hypo-methylation in adipocytes and adipose stem and progenitor cells (ASPCs), driving nearly half of the 705,063 detected differentially methylated regions (DMRs). In addition to the enriched cell-type-specific transcription factor binding motifs, we identified TET1 and DNMT3A as plausible candidates for regulating cell-type level mCG profiles. Furthermore, we observed that global mCG profiles closely correspond to SAT lineage, which is also reflected in cell-type-specific chromosome compartmentalization. Adipocytes, in particular, display significantly more short-range chromosomal interactions, facilitating the formation of complex local 3D genomic structures that regulate downstream transcriptomic activity, including those associated with adipogenesis. Finally, we discovered that variants in cell-type level DMRs and A compartments significantly predict and are enriched for variance explained in abdominal obesity. Together, our multimodal study characterizes human SAT epigenomic landscape at the cell-type resolution and links partitioned polygenic risk of abdominal obesity to SAT epigenome.


Figures

Extended Data Figure 1.
Extended Data Figure 1.. Integrative analysis between subcutaneous adipose tissue (SAT) cells profiled by single nucleus methyl-3C sequencing (snm3C-seq) and single nucleus RNA sequencing (snRNA-seq).
a, Dimension reduction of cells (n=29,423) profiled by snRNA-seq and visualized with uniform manifold approximation and projection (UMAP). b, The total number of cells profiled by snm3C-seq and snRNA-seq stratified by the SAT cell-types. c, Co-embedding of snm3C-seq gene-body mCG and snRNA-seq gene expression, visualized with UMAP, highlighting the transition cell-type in red and other SAT cell-types in grey. d, Confusion matrix comparing the concordance between the de novo snm3C-seq annotations (row) and the snRNA-seq-derived annotations (column). The confusion fraction is calculated as the multi-class confusion matrix normalized by the cell counts per row. ASPC indicates adipose stem and progenitor cells.
Extended Data Figure 2.
Extended Data Figure 2.. Gene-body mCG and RNA expression profiles across SAT cell-type marker genes and clustering analysis of the transition cell-type.
a-f, Uniform manifold approximation and projection (UMAP) visualization of the gene-body mCG ratio, normalized per cell (left) and log-transformed counts per million normalized gene expression (right) for perivascular marker gene NOTCH3 (a), ASPC marker gene COL5A1 (b), endothelial cell marker gene EGFL7 (c), lymphoid cell marker gene CD2 (d), mast cell marker gene SLC18A2 (e), and myeloid cell marker gene CSF1R (f). g, Gene-body hypo-methylation of adipocyte marker genes (top 5 rows) and perivascular cell marker genes (bottom 5 rows) across adipocytes, perivascular cells, and the transition cell-type. Dot colors represent the average gene-body mCG ratio normalized per cell. h, Dimension reduction of cells profiled by snm3C-seq and restricted to adipocytes, perivascular cells, and the transition cell-type, using exclusively the 5-kb bin mCG profiles and visualized with UMAP. ASPC indicates adipose stem and progenitor cells.
Extended Data Figure 3.
Extended Data Figure 3.. Comparisons of unique cell-type marker genes in SAT cell-types, and biological processes and functional pathways enriched among the adipocyte marker genes between the gene-body mCG and gene expression modalities.
a, Venn diagrams showing the number of shared and modality-specific unique SAT cell-type marker genes (adipocytes, perivascular cells, ASPCs, myeloid cells, endothelial cells, lymphoid cells, and mast cells) between the gene-body mCG and gene expression modalities. b-c, Dot plots showing significantly (FDR<0.05) enriched biological processes (b) and KEGG functional pathways (c) using unique adipocyte marker genes in gene-body mCG and gene expression modalities. The size of the dot represents the enrichment ratio for biological processes (b) and KEGG functional pathways (c), while the color of the dot indicates FDR (blue is highly significant) (b-c). d, Dot plots of fat cell differentiation biological process genes (ADIPOQ, LPL, LEP, TCF7L2, AKT2, and SREBF1) that are shared adipocyte marker genes between the mCG and gene expression modalities, showing their gene-body mCG (left) and gene expression profiles (right) across the SAT cell-types. The color of the dot represents the mean percentage of mCG (left, red is high) and average expression of genes (right, blue is high), while the size of the dot represents the percentage of cells where the gene is expressed (right). ASPC indicates adipose stem and progenitor cells and FDR, false discovery rate.
Extended Data Figure 4.
Extended Data Figure 4.. Cell-type level hypo-methylated regions are enriched for specific transcription factor (TF) binding motifs
. We show the top five cell-type-specific TF binding motifs (sorted by P) that are enriched among the hypo-methylated regions of the SAT cell-types, identified using HOMER motif enrichment analysis. ASPC indicates adipose stem and progenitor cells.
Extended Data Figure 5.
Extended Data Figure 5.. Cell-type level differences in chromatin conformation of subcutaneous adipose tissue (SAT).
a-b, Uniform manifold approximation and projection (UMAP) visualization of low dimensional embeddings of cells using compartment (a) and insulation scores (d) as features, colored by the snm3C-seq annotation. Adjusted rand index (ARI) evaluates the clustering concordance against snm3C-seq annotation. c, Heatmap visualization of the normalized interaction contact map on chromosome 6 and its corresponding compartment scores across the SAT cell-types. d, Horizontal stacked bar plot (left) showing the marginal proportions of differential 100-kb bins stratified by their annotated A and B compartments in the 5 most abundant SAT cell-types and upset plot (right) showing all compartment combinations across differential 100-kb bins in decreasing order with their corresponding percentages (Homogeneous, Cell-type enriched, and Heterogeneous correspond to unique A or B compartment in 0, 1, or more than 1 cell-types, respectively). e, Sankey diagram breaking down of the numbers of differential 100-kb bins annotated as A (red) and B (blue) compartment belonging to ASPCs (left), adipocytes (middle), and myeloid cells (right). f, Similar to e, except on perivascular cells (left), adipocytes (middle), and endothelial cells (right). ASPC indicates adipose stem and progenitor cells.
Extended Data Figure 6.
Extended Data Figure 6.. Cell-type specificity in interaction domains and loops.
a-c, Box plots visualizing the distribution of the number of interaction domains (a), the total number (b) and the average span (c) of interaction domains detected in each cell, stratified by cell-types. Asterisks indicate the level of statistical significance of a pairwise paired Wilcoxon test against adipocytes; *** indicates adjusted P<0.05 and n.s. denotes non-significant. d, Scatter plot showing the short to long-range interaction ratio per cell against the number of interaction domains detected. Cells are colored by its snm3C-seq annotation. e-f, Scatter plots showing the aggregated cell-type level median number of UMIs detected in cells by snRNA-seq against the median number of interaction domains (e) and the ratio of short to long-range interaction contacts (f) detected in cells by snm3C-seq, colored similarly as in d. g-h, Bar plots showing the median distance (g) and the total number (h) of loop summits detected across the SAT cell-types (x-axis is ordered by the abundance in snm3C-seq). ASPC indicates adipose stem and progenitor cells.
Extended Data Figure 7.
Extended Data Figure 7.. Mean gene expression of DNA methylation- and demethylation-related genes across cell-types in subcutaneous adipose tissue (SAT).
a-b, Dot plot showing expression of (a) DNA methylation genes (DNMT1, DNMT3B, and UHRF1) and (b) DNA demethylation genes (TET2, TET3, and TDG) across subcutaneous adipose tissue (SAT) cell-types. The size of the dot represents the percentage of cells, in which a gene is expressed within a cell-type while the color represents the average expression of each gene across all cells within a cell-type (blue indicates a higher expression). ASPC indicates adipose stem and progenitor cells.
Extended Data Figure 8.
Extended Data Figure 8.. Abdominal obesity -associated variants are enriched for the adipocyte A compartment.
a, The clumped and thresholded variants (r2<0.1, P<0.05) used for the adipocyte compartment PRSs for abdominal obesity (employing waist-hip-ratio adjusted for BMI (WHRadjBMI) as a proxy) are plotted by genomic position against the −log10P from the UK Biobank WHRadjBMI GWAS that we used for the WHRadjBMI PRS base (n=195,863 unrelated Europeans). SNPs landing in the adipocyte A compartment are colored blue, while SNPs landing in the adipocyte B compartment are colored black. b, Bar plot showing the number of independent (r2<0.1) WHRadjBMI-associated variants, passing nominal significance (P<0.05), from the WHRadjBMI GWAS, conducted in 195,863 individuals from the UK Biobank, grouped by the adipocyte compartment assignment.
Figure 1.
Figure 1.. Schematic overview of the study design using single nucleus methyl-3C sequencing and single nucleus RNA-sequencing to profile cell-type level DNA methylation, chromatin conformation, and gene expression in the human subcutaneous adipose tissue (SAT) and partition the genetic risk of abdominal obesity.
a, Illustration of single nucleus methyl-3C sequencing (snm3C-seq) and single nucleus RNA-sequencing (snRNA-seq) on nuclei isolated from SAT biopsies from females with obesity. b-g, Comprehensive analyses of DNA methylation, chromatin conformation, and gene expression profiles across the SAT cell-types to identify cell-type level differences in DNA methylation patterns (b) and chromatin conformation dynamics (c). Subsequently, we used the cell-type level SAT expression data (d) to determine whether methylation pathway genes contribute to the observed differences in methylation patterns in SAT cell-types and longitudinally cluster with adipogenesis pathway genes (e), identify cell-type-specific transcription factor (TF) binding motifs associated with hypo-methylated regions in SAT cell-types (f) as well as (e) to test the contribution of variants in cell-type level differentially methylated regions and A and B compartments to the genetic risk of abdominal obesity (g).
Figure 2.
Figure 2.. Single-nucleus level multi-omic profiles of SAT by jointly profiling methylation and chromatin conformation with snm3C-seq, followed by an integrative analysis with transcriptomic profiles, generated using SAT snRNA-seq.
a, Dimension reduction of cells using 5-kb bin mCG (top left), 100-kb bin chromatin conformation (top right), and jointly integrating mCG and chromatin conformation (bottom), profiled by single nucleus methyl-3C sequencing (snm3C-seq) and visualized with uniform manifold approximation and projection (UMAP). Cells are colored by cell-types of subcutaneous adipose tissue (SAT). b, Sankey diagram showcases the high consistency among the SAT cell-type annotations derived from the 5-kb bin mCG (left), 100-kb bin chromatin conformation (right), and joint profiling of mCG and chromatin conformation (middle), with the exception of the transition cell-type cluster that is annotated as perivascular cells by mCG and adipocytes by chromatin conformation. c-f, Integrative analysis with snRNA-seq, evaluating the concordance of cell-type cluster annotations and cell-type marker genes across the used modalities. c, Comparison of gene-body mCG and gene expression profiles of cell-type marker genes across the matching SAT cell-types, independently identified within the respective modalities, excluding the expression profiles of the transition cell-type cluster that was not identified in the SAT snRNA-seq data. Dot colors represent the average gene-body mCG ratio normalized per cell (left), and the average log-transformed counts per million normalized gene expression (right). d, Co-embedding of snm3C-seq gene-body mCG and snRNA-seq gene expression, visualized with UMAP. Cells are colored by the SAT cell-types identified in c (top) and modalities (bottom). e, Concordance matrix comparing the snm3C-seq and snRNA-seq derived annotations, colored by the overlapping scores between the pairs of the SAT cell-types evaluated in the co-embedding space. f, UMAP visualization of the gene-body mCG ratio (left) and gene expression (right) for one adipocyte marker gene, GPAM, colored per cell similarly as in c. ASPC, adipose stem and progenitor cell.
Figure 3.
Figure 3.. Functional pathways and gene regulatory potential of cell-type level gene-body mCG markers and differentially methylated regions.
a, Dot plots of PPAR signaling pathway genes (ACSL1, ADIPOQ, LPL, PCK1, PLIN1, and PLIN4) that are shared adipocyte marker genes between the gene-body mCG and gene expression modalities, showing their gene-body mCG (left) and gene expression profiles (right) across the SAT cell-types. The color of the dot represents the mean percentage of mCG (left, red is high) and average expression of genes (right, blue is high), while the size of the dot represents the percentage of cells where the gene is expressed (right). b, Horizontal stacked bar plot (left) showing the marginal proportions of assigned methylation states across differentially methylated regions (DMRs) for each SAT cell-type (n.s. denotes non-significant) and upset plot (right) showing the top 20 combinations of methylation states across DMRs in decreasing order with their corresponding percentages. c, Circular plot summarizing the cell-type-specific transcription factor (TF) binding motifs associated with hypo-methylated regions in SAT cell-types. The outermost layer shows the names of cell-type-specific and significantly (P<1×10⁻¹²) enriched TFs in each SAT main cell-type. Track 1 shows the negative logarithmic of the P value (green lollipop) and track 2 shows the enrichment score (yellow lollipop). ASPC, adipose stem and progenitor cell, and FDR, false discovery rate.
Figure 4.
Figure 4.. Analysis of chromatin conformation profiles in subcutaneous adipose tissue (SAT) reveals cell-type level diversity in compartments, domains, and loops.
a, Frequency of contacts per cell against genomic distance. Cells are grouped by SAT cell-types and ordered by the median short to long-range interaction ratios. b, Short to long-range interaction ratios of SAT cell-types, ordered in the same way as in (a). Asterisks indicate the level of statistical significance of pairwise paired Wilcoxon test against adipocytes, and ***indicates −log10P>50 and n.s. denotes non-significant. c-d, Uniform manifold approximation and projection (UMAP) visualization of low dimensional embeddings of cells using domains (c) and loops (d) as features, colored by the snm3C-seq annotation; adjusted rand index (ARI) evaluates the clustering concordance against snm3C-seq annotation. e, Heatmap visualization of the normalized interaction contact map on chromosome 12 and its corresponding compartment scores across SAT cell-types. f, Upset plot (left) visualizing a subset of the differential 100-kb bins (i.e., cell-type-specific and homogeneous compartment combinations) and their corresponding percentages; horizontal stacked bar plot (right) showing the marginal A compartment enrichment of differential 100-kb bins, stratified by cell-types. g, Dendrogram of the 5 most abundant SAT cell-types constructed with compartment scores on differential 100-kb bins. h, Similar to g, except on all annotated SAT cell-types, constructed with mCG fractions across DMRs. ASPC indicates adipose stem and progenitor cell.
Figure 5.
Figure 5.. Analysis of mean gene expression and differentially methylated regions (DMRs) across subcutaneous adipose tissue (SAT) cell-types reveals the potential involvement of DNA methylation pathway genes in regulating cell-type level hyper- and hypo-methylation in SAT.
a, A schematic representation of basic mechanisms and key players in DNA methylation and demethylation. b, Dot plot of TET1 and DNMT3A showing their expression profiles across the SAT cell-types. The size of the dot represents the percentage of cells in which a gene is expressed within a cell-type and the color represents the average expression of each gene across all cells within a cell-type (blue indicates higher expression). c, Proportions of assigned hypo- (left) and hyper-methylated states (right) across DMRs. d, Uniform manifold approximation and projection (UMAP) visualization of the average global mCG ratio in a cell. e, Bar plot reflecting the distribution of normalized mCG fraction across genes that co-cluster with TET1 in (f) for ASPCs and adipocytes. Asterisk indicates the level of statistical significance, *p≤0.05 using a paired Wilcoxon test. f, Longitudinal expression of TET1 is plotted across the 14-day SAT preadipocyte differentiation. The ribbon behind the trajectory of TET1 reflects the mean and standard deviation of the genes that clustered into similar trajectory patterns as TET1 using DPGP. ASPC indicates adipose stem and progenitor cells.
Figure 6.
Figure 6.. Partitioned abdominal obesity PRSs of several cell-type level DMRs and all cell-type level A compartments are enriched for variance explained in abdominal obesity, and 63.2% of non-redundant abdominal obesity GWAS variants land in adipocyte A compartment.
a-b, Lollipop plots depict the incremental variance explained of each cell-type level PRS for abdominal obesity (using waist-hip-ratio adjusted for body mass index (WHRadjBMI) as a proxy) from the (a) DMRs, and (b) A and B compartments. Each lollipop represents a WHRadjBMI PRS, where the dot size corresponds to the incremental variance explained of the PRS. The grey vertical dotted line indicates the cutoff for significant enrichment of incremental variance explained (Pperm10,000<0.05). On the left, horizontal bar-plots depict the number of SNPs used for the PRS construction. We color each bar and lollipop by the cell-type, where PRSs without a significant enriched PRS are outlined in grey without a filling. c, Bar plot showing the number of independent (r2<0.1) WHRadjBMI GWAS variants, passing genome-wide significance (P<5×10⁻⁸), from the WHRadjBMI GWAS, conducted in 195,863 individuals from the UK Biobank, grouped by the adipocyte compartment assignment. We shade each bar by compartment, where the A compartment is colored red and B compartment blue.

References

    1. González-Muniesa P. et al. Obesity. Nat Rev Dis Primers 3, 17034 (2017). - PubMed
    1. Sun J.-Y. et al. Trends in general and abdominal obesity in US adults: Evidence from the National Health and Nutrition Examination Survey (2001–2018). Front Public Health 10, (2022). - PMC - PubMed
    1. Després J.-P. Abdominal obesity: the most prevalent cause of the metabolic syndrome and related cardiometabolic risk. European Heart Journal Supplements 8, B4–B12 (2006).
    1. Glastonbury C. A., Couto Alves A., El-Sayed Moustafa J. S. & Small K. S. Cell-Type Heterogeneity in Adipose Tissue Is Associated with Complex Traits and Reveals Disease-Relevant Cell-Specific eQTLs. Am J Hum Genet 104, 1013–1024 (2019). - PMC - PubMed
    1. Das S. S. et al. Cross-Tissue Single-Nucleus RNA Sequencing Discovers Tissue-Resident Adipocytes Involved in Propanoate Metabolism in the Human Heart. Arterioscler Thromb Vasc Biol 43, 1788–1804 (2023). - PMC - PubMed

Publication types