[Preprint]. 2024 Oct 28:2024.10.23.619858.
doi: 10.1101/2024.10.23.619858.

Altered AP-1, RUNX and EGR chromatin dynamics drive fibrotic lung disease

Affiliations

Altered AP-1, RUNX and EGR chromatin dynamics drive fibrotic lung disease

Eleanor Valenzi et al. bioRxiv. .

Abstract

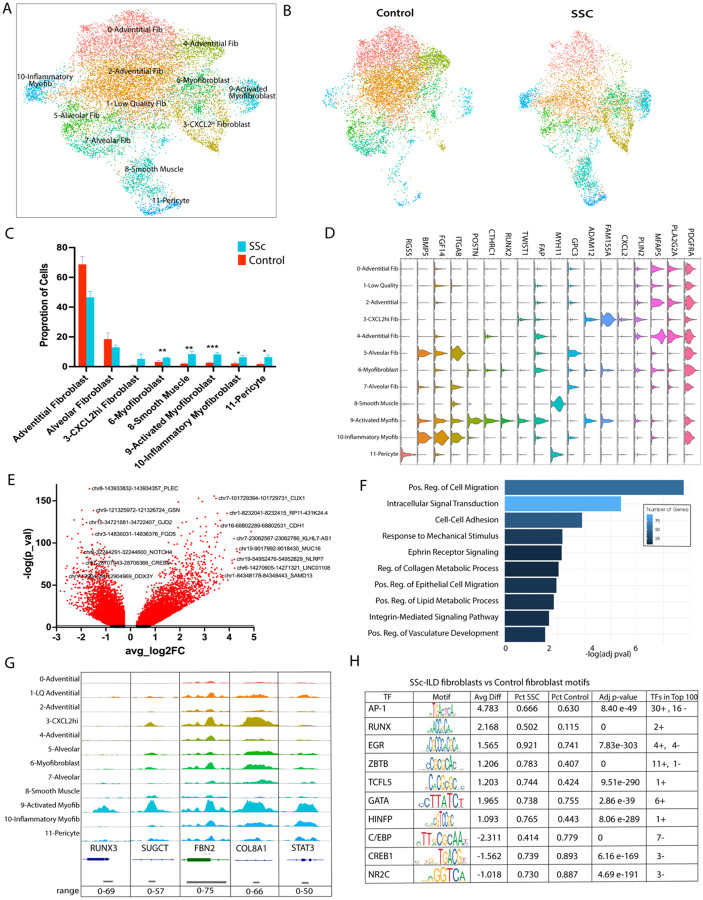
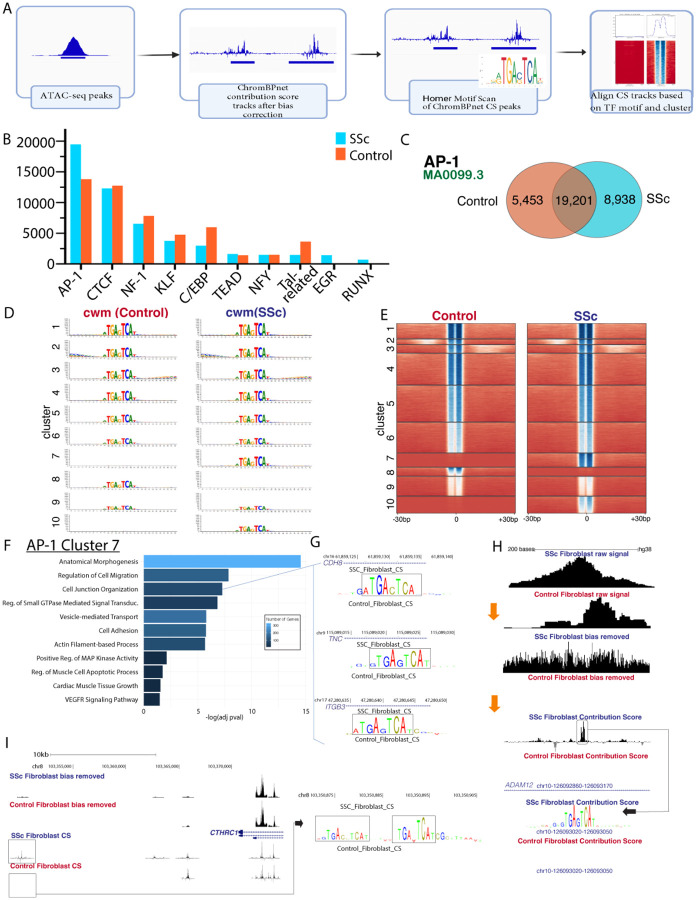
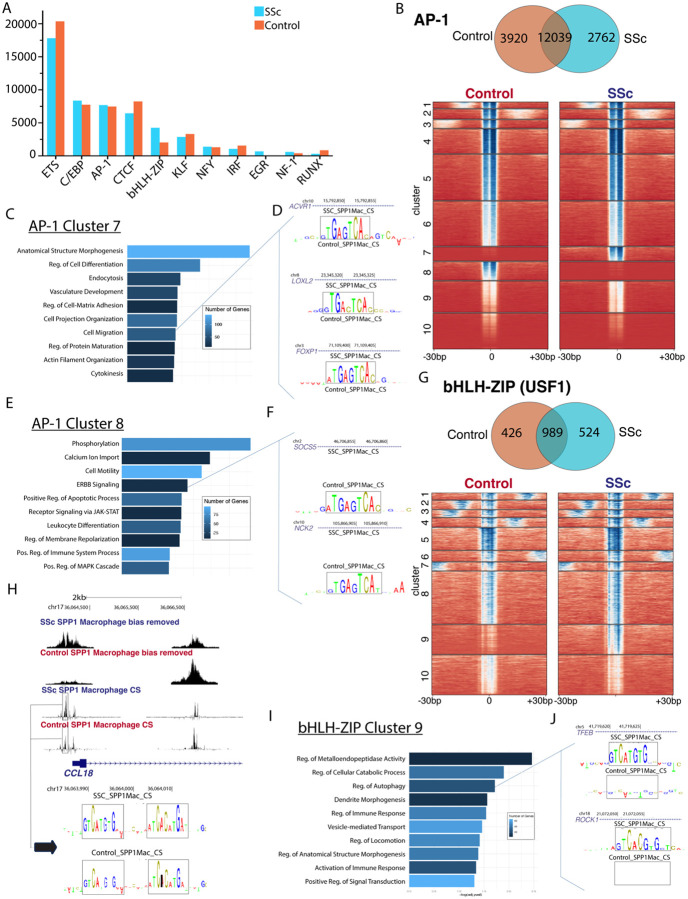
Pulmonary fibrosis, including systemic sclerosis-associated interstitial lung disease (SSc-ILD), involves myofibroblasts and SPP1hi macrophages as drivers of fibrosis. Single-cell RNA sequencing has delineated fibroblast and macrophages transcriptomes, but limited insight into transcriptional control of profibrotic gene programs. To address this challenge, we analyzed multiomic snATAC/snRNA-seq on explanted SSc-ILD and donor control lungs. The neural network tool ChromBPNet inferred increased TF binding at single base pair resolution to profibrotic genes, including CTHRC1 and ADAM12, in fibroblasts and SPP1 and CCL18 in macrophages. The novel algorithm HALO confirmed AP-1, RUNX, and EGR TF activity controlling profibrotic gene programs and established TF-regulatory element-gene networks. This TF action atlas provides comprehensive insights into the transcriptional regulation of fibroblasts and macrophages in healthy and fibrotic human lungs.


Conflict of interest statement

Conflict of Interest RL reports grants from Bristol Meyers Squibb, Formation, Moderna, Regeneron and Pfizer, EV reports grans from Boehringer Ingelheim. RL served or serves as a consultant with Abbvie, Mediar, Bristol Meyers Squibb, Formation, Thirona Bio, Sanofi, Boehringer Ingelheim, Merck, Genentech/Roche, EMD Serono, Morphic, Third Rock Ventures, Bain Capital and Zag Bio. RL sits on independent data safety monitoring committees for Advarra/GSK and Genentech. RL holds stock in Thirona Bio Inc and is president and holds stock in Modumac Therapeutics Inc.

Figures

Figure 1.
Figure 1.
A- Clustering of the 9 SSc and 9 Control samples after filtering, includes 67, 446 nuclei. B- Identification of cell clusters by ATAC pseudobulk in promoter regions of known cell type identifying genes C- Clustering divided by Control versus SSc origin D- Proportion of cells in each cluster originating from SSc versus Control lungs E- Annotation of peak regions for lung clustering. Peaks called per cluster by macs2 with annotation by ChIPseeker F- Number of statistically significant (adj p-val <0.05) differentially accessible regions when comparing SSc versus Control nuclei within each cluster G- Top differentially accessible regions for each cluster
Figure 2.
Figure 2.
A- Subclustering of mesenchymal nuclei B- Mesenchymal nuclei divided by Control versus SSc C- Proportion of mesenchymal nuclei consisting of each cell type at the individual sample level, comparing SSc vs Control. Bar represents the mean with error bar the standard error of the mean. *=0.0106–0.0142, **=p=0.0028–0.0056, ***=p=0.0005; D- Gene expression of select cell type identifiers. E- SSc Fibroblasts vs Control Fibroblasts DARs with labeling of select DARs and the nearest annotated gene F- Pathway enrichment of OCRs more accessible in SSc vs Control fibroblasts G- ATAC pseudobulk by mesenchymal cluster of 5 regions with top DARs in activated myofibroblasts H- Top enriched TF family motifs in SSc-ILD fibroblasts vs Control fibroblasts, ranked by absolute value of average difference and separated into positively and negatively enriched. Final column notes number of TFs in the same class/family present in the top 100, as well as the direction of their enrichment (positive or negative)
Figure 3.
Figure 3.
ChromBPNet analysis of 6880 control fibroblast nuclei and 5039 SSc fibroblast nuclei. A- Graphic representation of analysis pipeline for ATAC pseudobulk ChromBPNet analysis B- Number of seqlets detected by transcription factor family (largest number for each family depicted) in SSc and control fibroblasts by TF-MoDISco genome sampling. C- Number of AP-1 seqlets (as detected for the MA0099.3 FOS::JUN matrix profile) unique to and shared by SSc and control fibroblasts. D- Contribution weighted matrices for SSc and control fibroblasts by cluster E- Heatmap of AP-1 contribution score dot product for each seqlet/chromatin region divided by SSc and control fibroblasts into 10 clusters. Darker blue indicates higher contribution score. F- Pathways enriched by gene ontology for the AP-1 cluster 7 chromatin regions. G- Contribution score track depictions for SSc and control fibroblasts of 3 chromatin regions (annotated to CDH8, TNC, and ITGB3) enriched in the cell junction organization pathway, from AP-1 cluster 7. H- ChromBPNet analysis of ADAM12 intronic region with AP-1 footprinting for SSc and control fibroblast pseudobulk ATAC data. Multiple levels from pseudobulk raw signal, bias removed signal, and contribution score tracks depicted. I- Pseudobulk bias removed signal and contribution score tracks for CTHRC1 region with duplicate AP-1 footprinting in SSc fibroblasts.
Figure 4.
Figure 4.
A- Gene expression of myeloid cell type markers B- SSc SPP1hi Macrophages vs Control SPP1hi Macrophages differentially accessible regions with labeling of select DARs and the nearest annotated gene. C- Pathway enrichment analysis of chromatin regions more accessible in SSc vs Control SPP1hi macrophages. D-TF Motifs enriched in SSc SPP1hi Macrophages vs Control SPP1hi Macrophages, ranked by absolute value of average difference and separated into positively and negatively enriched. Final column notes number of TFs in the same class/family present in the top 100. E- Plot of pseudobulk enriched peaks differentially accessible in SSc SPP1hi Macrophages
Figure 5.
Figure 5.
SPP1hi Macrophage ChromBPNet Analysis of 3968 control nuclei and 3902 SSc nuclei. A- Number of seqlets detected by transcription factor family (largest number for each family depicted) in SSc and control SPP1hi Macrophages by TF-MoDISco genome sampling. B- Number of AP-1 seqlets unique to and shared by SSc and control SPP1hi Macrophages. Heatmap of AP-1 contribution score dot product for each seqlet/chromatin region divided by SSc and control SPP1hi Macrophages into 10 clusters. Darker blue indicates higher contribution score. C- Pathways enriched by gene ontology for the AP-1 cluster 7 chromatin regions. D- Contribution score track depictions for SSc and control SPP1hi Macrophages of 3 chromatin regions (annotated to ACVR1, LOXL2 and FOXP1) enriched in the cell migration pathway, from AP-1 cluster 7. E- Pathways enriched by gene ontology for the AP-1 cluster 8 chromatin regions. - Contribution score track depictions for SSc and control SPP1hi Macrophages of 2 chromatin regions (annotated to SOCS5 and NCK2) enriched in the ERBB signaling pathway, from AP-1 cluster 8. G- Number of bHLH-ZIP seqlets unique to and shared by SSc and control SPP1hi Macrophages. Heatmap of bHLHZIP contribution score dot product for each seqlet/chromatin region divided by SSc and control SPP1hi Macrophages into 10 clusters. Darker blue indicates higher contribution score. H- Pseudobulk bias removed signal and contribution score tracks for CCL18 region with duplicate bHLH-ZIP footprinting in SSc and control SPP1hi Macrophages. I- Pathways enriched by gene ontology for the bHLH-ZIP cluster 9 chromatin regions. J- Contribution score track depictions for SSc and control SPP1hi Macrophages of 2 chromatin regions (annotated to TFEB and ROCK1) enriched in the regulation of autophagy pathway, from bHLH-ZIP cluster 9.
Figure 6.
Figure 6.
A- Graphic representation of analysis pipeline for multiome mesenchymal and myeloid subsets: 1) Metacell creation using paired ATAC-seq and RNA-seq data to decrease sparsity, 2) Cis-regulatory elements identified by regressing the expression level of a gene of interest (DEGs for the same population comparisons) using accessibility values of peaks located within 250kbp of the transcription start site. Enriched TFs then identified in the differentially accessible CREs. 3)TF regulatory networks constructed by integrating both CRE-gene and CRE-TF relationships. B- Multiome samples fibroblast clustering (smooth muscle, pericytes, and doublet nuclei excluded from this umap) C- Visualization of Milo differential abundance testing results: each point represents a neighborhood, and points are colored according to the log fold change (logFC) in cell abundance between disease and control cells. Red indicates neighborhood enriched in SSc condition and blue indicates neighborhood enriched control condition D- RNA velocity of multiome fibroblasts demonstrating suggested differentiation of myofibroblasts from both alveolar and adventitial subpopulations E- Gene regulatory networks for top enriched TFs (ranked by adj p-value) in SSc fibroblasts vs Control fibroblasts. DEGs for this comparison were generated from a larger scRNA-seq dataset of 17 SSc and 13 control lungs. Only DEGs with abslog2FC >1 are depicted. F- Multiome samples myeloid clustering with cell type identifications G-Visualization of Milo differential abundance testing results. Red indicates neighborhood enriched in SSc condition and blue indicates neighborhood enriched control condition H-RNA velocity of multiome SSc myeloid cells I-Gene regulatory networks for top enriched TFs (ranked by adj p-value) in SSc SPP1hi macrophages vs Control SPP1hi macrophages. DEGs for this comparison were generated from a larger scRNA-seq dataset of 17 SSc and 13 control lungs. Only DEGs with abslog2FC >1 are depicted.

Similar articles

Cited by

References

    1. Fabre T. et al. Identification of a broadly fibrogenic macrophage subset induced by type 3 inflammation. Sci Immunol 8, eadd8945, doi:10.1126/sciimmunol.add8945 (2023). - DOI - PubMed
    1. Coulis G. et al. Single-cell and spatial transcriptomics identify a macrophage population associated with skeletal muscle fibrosis. bioRxiv, doi:10.1101/2023.04.18.537253 (2023). - DOI - PMC - PubMed
    1. Bevan L. et al. Specific macrophage populations promote both cardiac scar deposition and subsequent resolution in adult zebrafish. Cardiovasc Res 116, 1357–1371, doi:10.1093/cvr/cvz221 (2020). - DOI - PMC - PubMed
    1. Rotem I. et al. Osteopontin promotes infarct repair. Basic Res Cardiol 117, 51, doi:10.1007/s00395-022-00957-0 (2022). - DOI - PubMed
    1. Shirakawa K. et al. MerTK Expression and ERK Activation Are Essential for the Functional Maturation of Osteopontin-Producing Reparative Macrophages After Myocardial Infarction. J Am Heart Assoc 9, e017071, doi:10.1161/JAHA.120.017071 (2020). - DOI - PMC - PubMed

Publication types