[Preprint]. 2024 Nov 3:2024.11.02.621692.
doi: 10.1101/2024.11.02.621692.

Pyramidal cell types and 5-HT2A receptors are essential for psilocybin's lasting drug action

Affiliations

Pyramidal cell types and 5-HT2A receptors are essential for psilocybin's lasting drug action

Ling-Xiao Shao et al. bioRxiv. .

Update in

Abstract

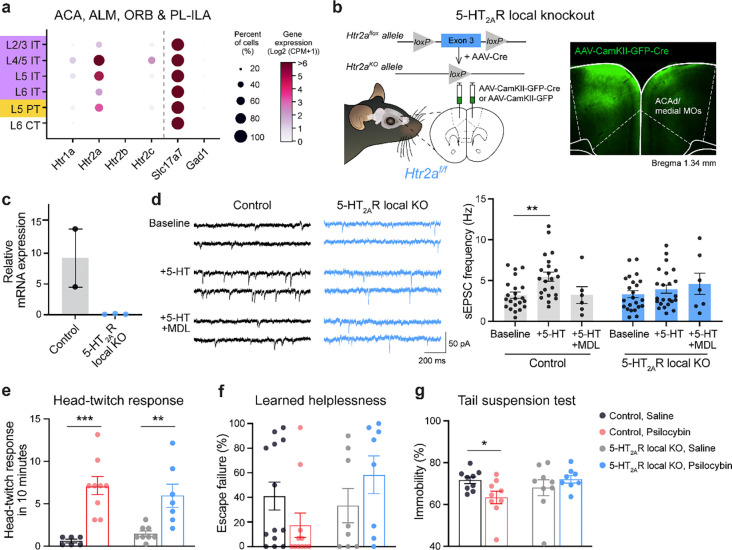
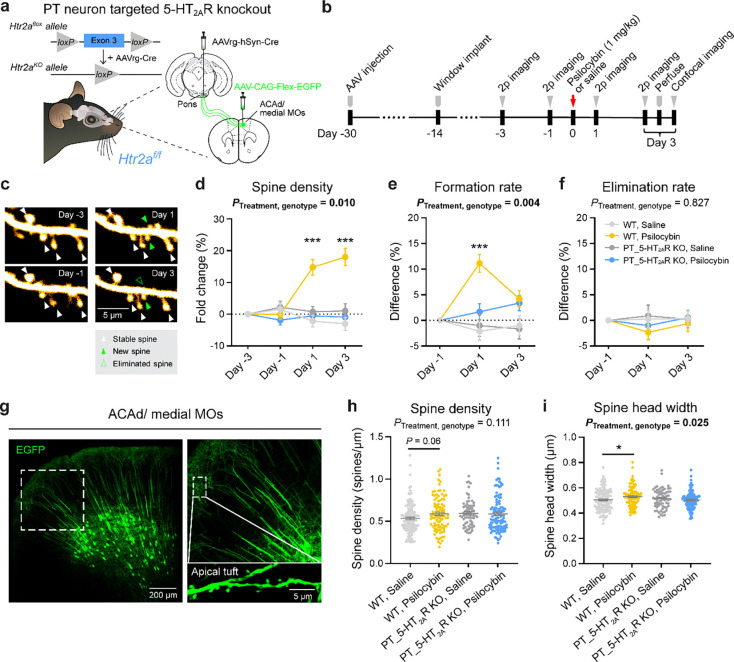
Psilocybin is a serotonergic psychedelic with therapeutic potential for treating mental illnesses1-4. At the cellular level, psychedelics induce structural neural plasticity5,6, exemplified by the drug-evoked growth and remodeling of dendritic spines in cortical pyramidal cells7-9. A key question is how these cellular modifications map onto cell type-specific circuits to produce psychedelics' behavioral actions10. Here, we use in vivo optical imaging, chemogenetic perturbation, and cell type-specific electrophysiology to investigate the impact of psilocybin on the two main types of pyramidal cells in the mouse medial frontal cortex. We find that a single dose of psilocybin increased the density of dendritic spines in both the subcortical-projecting, pyramidal tract (PT) and intratelencephalic (IT) cell types. Behaviorally, silencing the PT neurons eliminates psilocybin's ability to ameliorate stress-related phenotypes, whereas silencing IT neurons has no detectable effect. In PT neurons only, psilocybin boosts synaptic calcium transients and elevates firing rates acutely after administration. Targeted knockout of 5-HT2A receptors abolishes psilocybin's effects on stress-related behavior and structural plasticity. Collectively these results identify a pyramidal cell type and the 5-HT2A receptor in the medial frontal cortex as playing essential roles for psilocybin's long-term drug action.

Keywords: Psychedelic; dendritic spines; depression; frontal cortex; serotonin; structural plasticity.


Conflict of interest statement

Competing interests A.C.K. has been a scientific advisor or consultant for Boehringer Ingelheim, Empyrean Neuroscience, Freedom Biosciences, and Psylo. A.C.K. has received research support from Intra-Cellular Therapies. The other authors report no financial relationships with commercial interests.

Figures

Fig. 1:
Fig. 1:. Psilocybin induces structural plasticity in both PT and IT types of frontal cortical pyramidal neurons.
a, Pyramidal tract (PT) and intratelencephalic (IT) neurons have different long-range projections. b-c, Viral strategy to express EGFP selectively in PT neurons in the medial frontal cortex. AAVrg, AAV serotype retrograde. d-e, Similar to b-c for IT neurons. CP, caudoputamen. f-g, Longitudinal two-photon microscopy. h, Example field of view, tracking the same apical tuft dendrites for 65 days after psilocybin. i, Density of dendritic spines in the apical tuft of PT neurons after psilocybin (yellow; 1 mg/kg, i.p.) or saline (gray) across days, expressed as fold-change from baseline in first imaging session (day −3). Mean and s.e.m. across dendrites. j, Spine formation rate determined by number of new and existing spines in consecutive imaging sessions across two-day interval, expressed as difference from baseline in first interval (day −3 to day −1). k, Similar to j for elimination rate. l-n, Similar to i-k for IT neurons after psilocybin (purple) or saline (light purple). There was no cell-type difference in psilocybin’s effect on spine density, formation rate, or elimination rate (p-values for interaction effect of treatment × cell type, indicated in plots, mixed effects model). *, p < 0.05. ***, p < 0.001, post hoc with Bonferroni correction for multiple comparisons. Sample size n values are provided in Methods. Statistical analyses are provided in Supplementary Table 1.
Fig. 2:
Fig. 2:. PT neurons are essential for psilocybin’s effects on stress-related behaviors.
a, Inhibitory chemogenetic receptor (hM4DGi) expressed in PT neurons in the medial frontal cortex of Fezf2-CreER mice. b, Similar to a for IT neurons in PlexinD1-CreER mice. c, Head-twitch response. d, Effect of PT neuron inactivation during psilocybin (1 mg/kg, i.p.) or saline administration. Circle, individual animal. Mean and s.e.m. e, Similar to d for IT neurons. f, Learned helplessness. g, Effect of PT neuron inactivation during psilocybin or saline administration (interaction effect of treatment × DREADD: P < 0.001, two-factor ANOVA). Circle, individual animal. Mean and s.e.m. h, Similar to g for IT neurons. i, Tail suspension test. j, Effect of PT neuron inactivation during psilocybin or saline administration on subsequent proportion of time spent immobile (interaction effect of treatment × DREADD: P < 0.001, two-factor ANOVA). Circle, individual animal. Mean and s.e.m. k, Similar to j for IT neurons. *, p < 0.05. ***, p < 0.001, post hoc with Bonferroni correction for multiple comparisons. Sample size n values are provided in Methods. Statistical analyses are provided in Supplementary Table 1.
Fig. 3:
Fig. 3:. Psilocybin elevates the number of Ca2+ transients in dendritic branches and spines of PT neurons.
a, Two-photon microscopy of spontaneous dendritic calcium signals in awake mice. b, Viral strategy to express GCaMP6f selectively in PT neurons in the medial frontal cortex and example in vivo image. c, Similar to b for IT neurons. d, ΔF/F0 from a PT dendritic branch before and after saline or, from a different branch, before and after psilocybin (1 mg/kg, i.p.). Inset (right), magnified view of the boxed area (left). e, Fractional change in the rate of calcium events detected in PT dendritic branches after psilocybin (yellow) or saline (gray). f, The raw rates of calcium events, averaged across dendritic branches in the same field of view, after psilocybin (yellow) or saline (gray). Each circle is a field of view. g-i, Similar to d-f for IT dendritic branches. j-l, Similar to d-f for PT dendritic spines. m-o, Similar to d-f for IT dendritic spines. **, p < 0.01. ***, p < 0.001, post hoc with Bonferroni correction for multiple comparisons. Sample size n values are provided in Methods. Statistical analyses are provided in Supplementary Table 1.
Fig. 4:
Fig. 4:. Psilocybin acutely increases firing in a subset of PT neurons in vivo.
a, Neuropixels recording of ChR2-expressing neurons in Fezf2-CreER and PlexinD1-CreER mice. b, Timeline, including pre-drug (−30 – 0 min) and post-drug (0 – 60 min) periods. c, Probe tracks recovered from histology and rendered in Allen Mouse Brain Common Coordinate Framework. Green, ACAd and MOs. d, Spike raster of tagged neurons. Blue, laser stimulation. Inset, average waveform. e, Time of first spike relative to onset of laser for all tagged neurons. Yellow, Fezf2-CreER. Purple, PlexinD1-CreER. f, Mean pre-drug firing rates of all tagged neurons. g, Heatmaps showing activity for all tagged neurons in Fezf2-CreER mice before and after saline or psilocybin. Firing rate of each neuron was converted to z-score by normalizing based on its pre-drug firing rate. h, Mean pre- and post-drug firing rates for all tagged (yellow) and untagged other neurons (gray) in Fezf2-CreERmice. Each dot represents one neuron. i-j, Similar to g-h for PlexinD1-CreER mice. PBonf: Bonferroni corrected value. Sample size n values are provided in Methods. Statistical analyses are provided in Supplementary Table 1.
Fig. 5:
Fig. 5:. 5-HT2A receptors in medial frontal cortex mediate psilocybin’s alleviating effect on stress-related behaviors.
a, Single-cell transcript counts summed from the mouse ACA, ALM, ORB, and PL-ILA regions, extracted from the SMART-Seq data from Allen Institute. b, Viral injection strategy for inducing 5-HT2A receptor knockout or control in GFP+ cells in medial frontal cortex. Inset, post hoc histology. c, Htr2a mRNA levels in GFP+ cells quantified using qPCR following FACS. Circle, individual animal. d, Whole-cell voltage-clamp recordings of spontaneous EPSCs from GFP+ layer 5 pyramidal neurons in baseline, after bath application of 20 μM 5-HT, or after bath application of 20 μM 5-HT and 100 nM MDL100,907. Circle, individual cell. e, Head-twitch response measured in control animals after saline (gray) or psilocybin (red) and in animals with bilateral medial frontal cortex-specific 5-HT2A receptor knockout after saline (light gray) or psilocybin (blue). Circle, individual animal. Mean and s.e.m. f, Similar to e for learned helplessness. g, Similar to e for tail suspension. *, p < 0.05. **, p < 0.01. ***, p < 0.001. Sample size n values are provided in Methods. Statistical analyses are provided in Supplementary Table 1.
Fig. 6:
Fig. 6:. 5-HT2A receptor is required for psilocybin-induced structural plasticity in PT neurons
a, Viral injection strategy for inducing conditional 5-HT2A receptor knockout and GFP expression for imaging in frontal cortical PT neurons. b, Longitudinal two-photon microscopy followed by confocal imaging. c, Example field of view, tracking the same apical tuft dendrites before and after psilocybin. d, Density of dendritic spines in the apical tuft of PT neurons across days, expressed as fold-change from baseline in first imaging session (day −3), in wild type mice after saline (light gray) or psilocybin (yellow) and in mice with PT neuron-targeted 5-HT2A receptor knockout after saline (gray) or psilocybin (blue). Mean and s.e.m. across dendrites. Post hoc test compared WT:saline and WT:psilocybin groups. e, Spine formation rate determined by number of new and existing spines in consecutive imaging sessions across two-day interval, expressed as difference from baseline in first interval (day −3 to day −1. Interaction effect of treatment × cell type: P = 0.004, mixed effects model). f, Similar to e for elimination rate. g, Example field of view imaging apical tufts using confocal microscopy. h, Density of dendritic spines in the apical tuft of PT neurons in wild type mice after saline (light gray) or psilocybin (yellow) and in mice with PT neuron-targeted 5-HT2A receptor knockout after saline (gray) or psilocybin (blue). Circle, individual dendritic segment. Mean and s.e.m. i, Similar to h for spine head width (interaction effect of treatment × genotype: P =0.025, two-factor ANOVA). *, p < 0.05. ***, p < 0.001, post hoc with Bonferroni correction for multiple comparisons. Sample size n values are provided in Methods. Statistical analyses are provided in Supplementary Table 1.

References

    1. Goodwin G. M. et al. Single-Dose Psilocybin for a Treatment-Resistant Episode of Major Depression. N Engl J Med 387, 1637–1648 (2022). 10.1056/NEJMoa2206443 - DOI - PubMed
    1. Davis A. K. et al. Effects of Psilocybin-Assisted Therapy on Major Depressive Disorder: A Randomized Clinical Trial. JAMA Psychiatry 78, 481–489 (2021). 10.1001/jamapsychiatry.2020.3285 - DOI - PMC - PubMed
    1. Carhart-Harris R. et al. Trial of Psilocybin versus Escitalopram for Depression. N Engl J Med 384, 1402–1411 (2021). 10.1056/NEJMoa2032994 - DOI - PubMed
    1. Bogenschutz M. P. et al. Percentage of Heavy Drinking Days Following Psilocybin-Assisted Psychotherapy vs Placebo in the Treatment of Adult Patients With Alcohol Use Disorder: A Randomized Clinical Trial. JAMA Psychiatry 79, 953–962 (2022). 10.1001/jamapsychiatry.2022.2096 - DOI - PMC - PubMed
    1. Ly C. et al. Psychedelics Promote Structural and Functional Neural Plasticity. Cell Rep 23, 3170–3182 (2018). 10.1016/j.celrep.2018.05.022 - DOI - PMC - PubMed

Additional References

    1. Matho K. S. et al. Genetic dissection of the glutamatergic neuron system in cerebral cortex. Nature 598, 182–187 (2021). 10.1038/s41586-021-03955-9 - DOI - PMC - PubMed
    1. Feng G. et al. Imaging neuronal subsets in transgenic mice expressing multiple spectral variants of GFP. Neuron 28, 41–51 (2000). - PubMed
    1. Choi W. et al. Serotonin signals through a gut-liver axis to regulate hepatic steatosis. Nat Commun 9, 4824 (2018). 10.1038/s41467-018-07287-7 - DOI - PMC - PubMed
    1. Tervo D. G. et al. A Designer AAV Variant Permits Efficient Retrograde Access to Projection Neurons. Neuron 92, 372–382 (2016). 10.1016/j.neuron.2016.09.021 - DOI - PMC - PubMed
    1. Shamash P., Carandini M., Harris K. D. & Steinmetz N. A. A tool for analyzing electrode tracks from slice histology. biorxiv (2018). 10.1101/447995 - DOI

Publication types

LinkOut - more resources