[Preprint]. 2024 Oct 29:2024.10.29.620861.
doi: 10.1101/2024.10.29.620861.

Directed evolution of the multicopper oxidase laccase for cell surface proximity labeling and electron microscopy

Affiliations

Directed evolution of the multicopper oxidase laccase for cell surface proximity labeling and electron microscopy

Song-Yi Lee et al. bioRxiv. .

Update in

Abstract

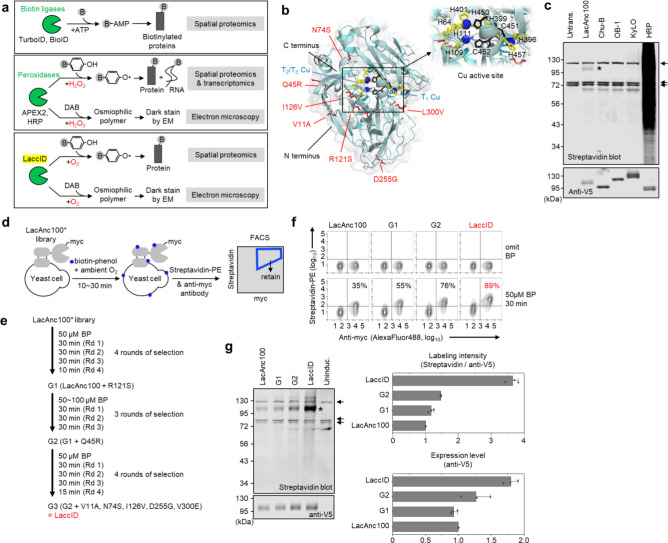
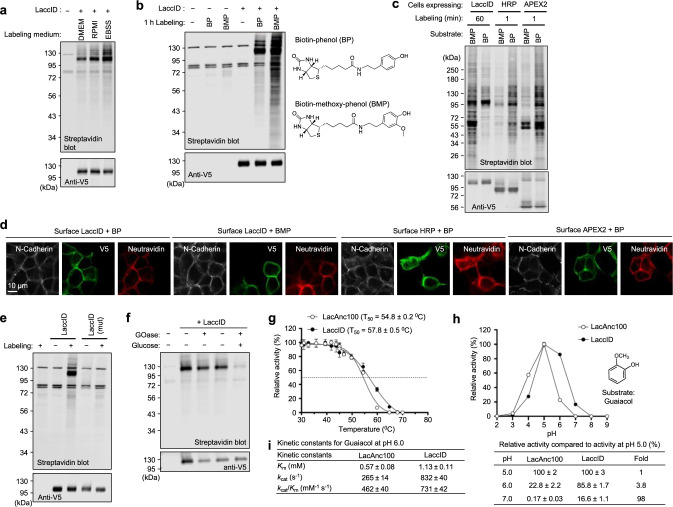
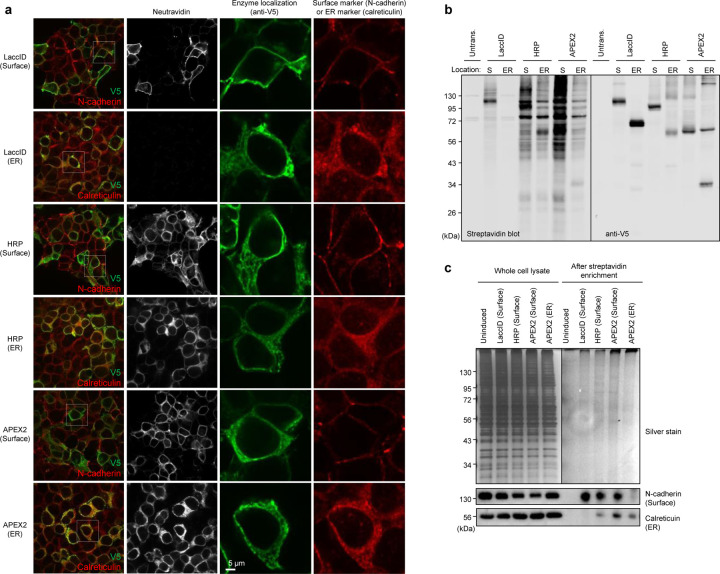
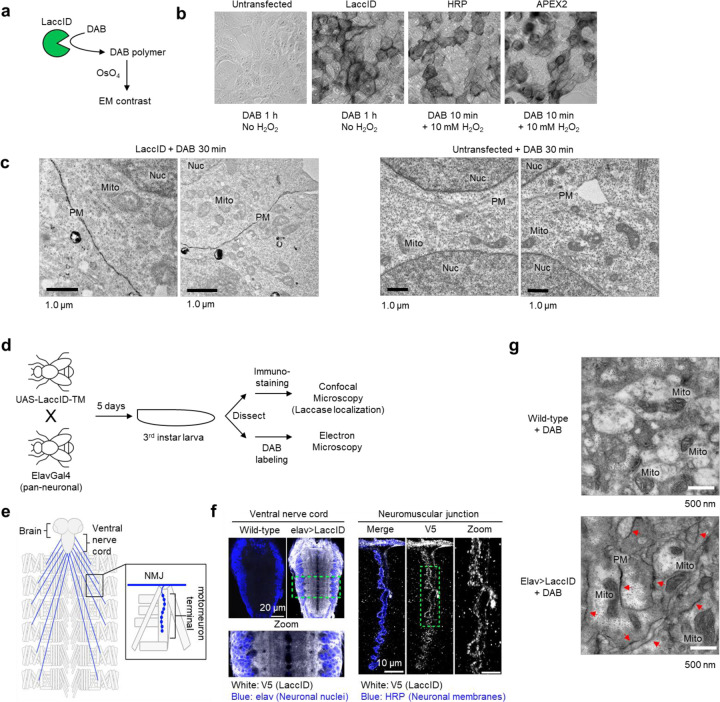
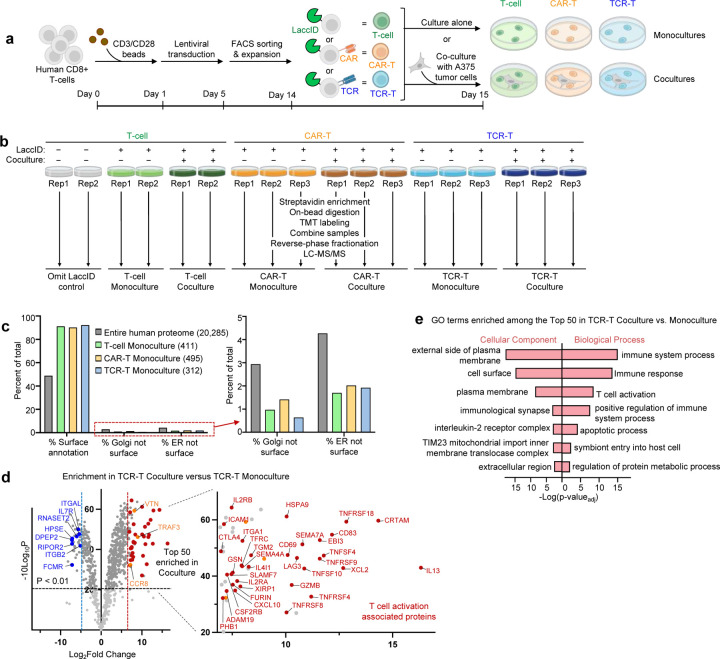
Enzymes that oxidize aromatic substrates have shown utility in a range of cell-based technologies including live cell proximity labeling (PL) and electron microscopy (EM), but are associated with drawbacks such as the need for toxic H2O2. Here, we explore laccases as a novel enzyme class for PL and EM in mammalian cells. LaccID, generated via 11 rounds of directed evolution from an ancestral fungal laccase, catalyzes the one-electron oxidation of diverse aromatic substrates using O2 instead of toxic H2O2, and exhibits activity selective to the surface plasma membrane of both living and fixed cells. We show that LaccID can be used with mass spectrometry-based proteomics to map the changing surface composition of T cells that engage with tumor cells via antigen-specific T cell receptors. In addition, we use LaccID as a genetically-encodable tag for EM visualization of cell surface features in mammalian cell culture and in the fly brain. Our study paves the way for future cell-based applications of LaccID.


Figures

Figure 1.
Figure 1.. Directed evolution of LaccID.
(a) LaccID is versatile, like APEX2, because it can be used for proximity labeling as well as electron microscopy (EM). LaccID is also minimally toxic, like TurboID, because it uses O2 instead of toxic H2O2. Grey B, biotin. DAB, diaminobenzidine. (b) AlphaFold2-predicted structure of LaccID. Four copper atoms (blue) are distributed in two copper centers (one Cu atom in type I and three Cu atoms in type II/III centers). Cu-coordinating sidechains (Histidines 64, 109, 111, 396, 399, 401, 457) are shown in yellow, residues involved in electron transfer (His451, Cys452, His453) in black, and seven mutations introduced by directed evolution in red. (c) Initial screening of 4 laccase candidates: LacAnc100, ChU-B, OB-1, and KyLO. Enzymes were fused to the transmembrane (TM) domain of human CD4 for expression on the surface of HEK293T cells. Labeling was performed for 1 h with 500 μM biotin-phenol (BP), then cell lysates were analyzed by streptavidin blotting. For comparison, HRP labeling was 1 min with 500 μM BP μM and 1 mM H2O2. *Self-labeling of LacAnc100. Arrows point to endogenous biotinylated proteins. Untrans., untransfected. (d) Yeast surface display selection scheme. PE, phycoerythrin. (e) Selection conditions used over three generations of directed evolution. The winning clone from each generation was named G1, G2, and G3, respectively. G3 is LaccID. (f) FACS density plots summarizing the progress of directed evolution. Yeast cells displaying LacAnc100 or G1-G3 (LaccID) were compared by labelling with 50 μM BP for 30 min, then staining with streptavidin-PE and anti-myc antibody. This experiment was performed three times with similar results. Percentages calculated as fraction of myc+ cells with streptavidin-PE staining above background. (g) Comparison of LacAnc100 and evolved clones on the surface of HEK293T cells. Expression of cell surface-targeted constructs was induced with doxycycline overnight, then labeled for 1 h with 500 μM BP in EBSS. Asterisk indicates self-labeling of LaccID. Arrows point to endogenous biotinylated proteins. Uninduc., uninduced. This experiment was performed three times with similar results. Right: quantification of streptavidin blot data (n = 3 biological replicates each; error bars, s.d.).
Figure 2.
Figure 2.. Characterization of LaccID.
(a) LaccID labeling in different cell culture media. HEK293T cells expressing surface LaccID were labeled for 2 h with 500 μM BP. (b) LaccID labeling with BP versus BMP (biotin-methoxy-phenol). HEK293T cells expressing surface LaccID were labeled for 1 h with 500 μM probe in EBSS. This experiment was performed three times with similar results. (c) LaccID comparison to HRP and APEX2 on the surface of HEK293T cells. For LaccID, labeling was performed with 500 μM BP in EBSS or 500 μM BMP in RPMI. For HRP and APEX2, labeling was performed with 500 μM BP and 1 mM H2O2 in DMEM. LaccID molecular weight is 53 kD without glycosylation. (d) Confocal imaging of cells labeled as in c. N-cadherin stain is shown as a plasma membrane marker. Neutravidin detects biotinylated proteins. Anti-V5 detects enzyme expression. (e) Mutation of the HCH motif (His450, Cys451, His452) abolishes LaccID activity. HEK293T cells expressing LaccID or mutant LaccID were labelled for 1 h with 500 μM BP in EBSS. This experiment was performed three times with similar results. (f) LaccID requires O2. HEK293T cells expressing surface LaccID were labeled with 500 μM BP in PBS for 1 h. Glucose oxidase (GOase) and glucose were used to deplete oxygen in the culture media. (g) Thermal stability of LacAnc100 and LaccID. Purified enzymes were incubated in citrate-phosphate pH 6.0 buffer at temperatures ranging from 30 to 70 °C, then assayed for activity at pH 4.0 with ABTS substrate. Three technical replicates each; error bars, s.d. (h) pH-activity profile for LacAnc100 and LaccID. Purified enzymes were assayed in Britton and Robinson buffer at the indicated pH with the substrate guaiacol. Conversion to product was measured by Abs470. Additional data with other substrates (ABTS, 2,6-dimethoxyphenol, p-coumaric acid, and sinapic acid) in Supplementary Figs. 5c–d. (i) Kinetic constants for LacAnc100 and LaccID at pH 6.0 with guaiacol. Additional data with other substrates in Supplementary Fig. 5e.
Figure 3.
Figure 3.. LaccID is selectively active on the cell surface.
(a) Confocal imaging of enzymes targeted to the cell surface or ER lumen of HEK293T cells. LaccID samples were labeled with BP for 1 h in EBSS. HRP and APEX samples were labeled for 1 min with BP and H2O2 in DMEM. The cells were then fixed and stained with anti-V5 antibody to detect expression, neutravidin-AF647 to detect biotinylated proteins, and organelle markers as indicated. This experiment was performed twice with similar results. (b) Promiscuous biotinylation activity of enzymes at the surface (S) or in the ER lumen of HEK293T cells. Cells were labeled with BP as in a, then blotted with streptavidin and anti-V5 antibody. APEX2 molecular weight is 30.9 kD and the higher band may be a crosslinked dimer. (c) Western blot detection of proteins enriched by LaccID, HRP, or APEX, targeted to the cell surface or ER lumen. Lysate from HEK293T cells labeled as in a were enriched with streptavidin beads, and eluates were blotted for a surface marker protein (N-cadherin) or ER lumen marker protein (calreticulin).
Figure 4.
Figure 4.. LaccID is a genetically encoded electron microscopy tag.
(a) LaccID generates EM contrast by catalyzing the oxidative polymerization of DAB, which recruits electron-dense osmium that appears dark on EM micrographs. (b) LaccID-catalyzed DAB staining in fixed cells. HEK293T cells expressing surface LaccID, HRP, or APEX2 were fixed using 2% (vol/vol) glutaraldehyde, stained with DAB for indicated times, and imaged by brightfield microscopy. (c) EM imaging of HEK293T cells expressing LaccID targeted to the cell surface via fusion to the transmembrane domain of CD4. Cells were fixed using 2% glutaraldehyde, incubated with DAB for 30 min, then post-fixed with 1% osmium tetroxide for one hour. Images are representatives of >3 fields of view. PM, plasma membrane. Nuc, nucleus. Mito, mitochondria. Right: Negative control with LaccID expression omitted. (d) Generation of neuron-specific LaccID transgenic flies. TM, transmembrane domain of CD2. (e) Schematic of the larval Drosophila central nervous system and the innervation of body wall muscles by motor neuron axons. LaccID is expressed in neurons of the brain and ventral nerve cord (VNC). Inset shows motorneuron axons leaving the VNC to innervate muscles at neuromuscular junctions (NMJs), which are visualized by confocal microscopy in f. (f) Representative confocal images of anti-V5 immunostained LaccID (epitope tagged with V5) in the VNC or NMJ. Neuronal nuclei and membranes were labeled with anti-elav and anti-HRP, respectively. Boxed regions are magnified to show LaccID expression in neuronal cell bodies and neuropil in the VNC (left) and at a motor neuron terminal (right). (g) Representative EM images of DAB-stained fly ventral nerve cord (VNC). Fixed VNC tissues from fly larvae were stained with Ce-DAB2 for 75 min, followed by post-fixation with 1% osmium tetroxide for 1 h. Red arrows indicate plasma membrane labeling in LaccID-expressing samples (Elav>LaccID). Additional fields of view and cerium detection by electron energy loss spectroscopy (EELS) and energy-filtered TEM are in Supplementary Figs. 8c, d, e.
Figure 5.
Figure 5.. LaccID mapping of the T cell surface proteome in the presence of tumor cells.
(a) Cocultures were established between LaccID-expressing T cells and A375 melanoma tumor cells. The tumor cells were positive for the NY-ESO-1 tumor antigen, while T cells expressed a CAR (orange) or TCR (blue) directed towards the same antigen, or neither (green). (b) Design of 18-plex TMT proteomic experiment. All samples were treated with BMP for 2 hours prior to quenching, lysis, and streptavidin enrichment of LaccID-labeled proteins. (c) LaccID enriches cell surface proteins in all three monoculture samples. Golgi and ER-resident proteins (lacking cell surface annotation) are de-enriched. (d) Volcano plot comparing LaccID-labeled TCR-T cocultures to monocultures. Proteins with prior literature connections to T cell activation are colored red, those with indirect connections are colored orange, and previously-annotated downregulated proteins are colored blue. Details in Supplementary Table 3. (e) Gene ontology terms enriched in top 50 TCR-T coculture vs. monoculture dataset.

References

    1. Qin W., Cho K.F., Cavanagh P.E. & Ting A.Y. Deciphering molecular interactions by proximity labeling. Nature Methods 18, 133–143 (2021). - PMC - PubMed
    1. Lam S.S. et al. Directed evolution of APEX2 for electron microscopy and proximity labeling. Nature Methods 12, 51–54 (2015). - PMC - PubMed
    1. Loh K.H. et al. Proteomic Analysis of Unbounded Cellular Compartments: Synaptic Clefts. Cell 166, 1295–1307.e1221 (2016). - PMC - PubMed
    1. Branon T.C. et al. Efficient proximity labeling in living cells and organisms with TurboID. Nature Biotechnology 36, 880–887 (2018). - PMC - PubMed
    1. Roux K.J., Kim D.I., Raida M. & Burke B. A promiscuous biotin ligase fusion protein identifies proximal and interacting proteins in mammalian cells. J Cell Biol 196, 801–810 (2012). - PMC - PubMed

Publication types

LinkOut - more resources