[Preprint]. 2024 Oct 31:2024.10.28.620093.
doi: 10.1101/2024.10.28.620093.

Mapping intratumoral myeloid-T cell interactomes at single-cell resolution reveals targets for overcoming checkpoint inhibitor resistance

Affiliations

Mapping intratumoral myeloid-T cell interactomes at single-cell resolution reveals targets for overcoming checkpoint inhibitor resistance

Kate Bridges et al. bioRxiv. .

Abstract

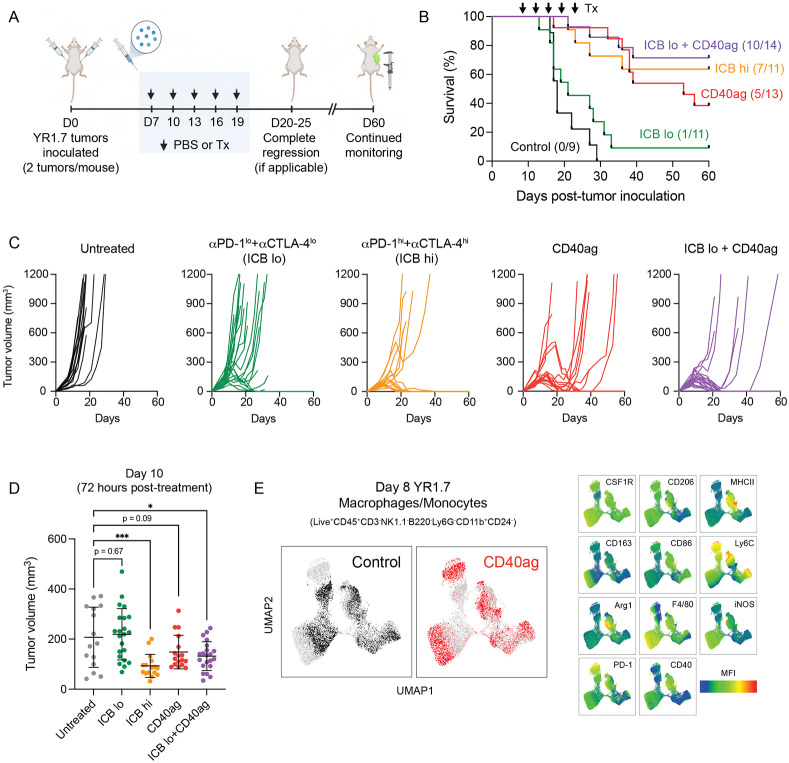
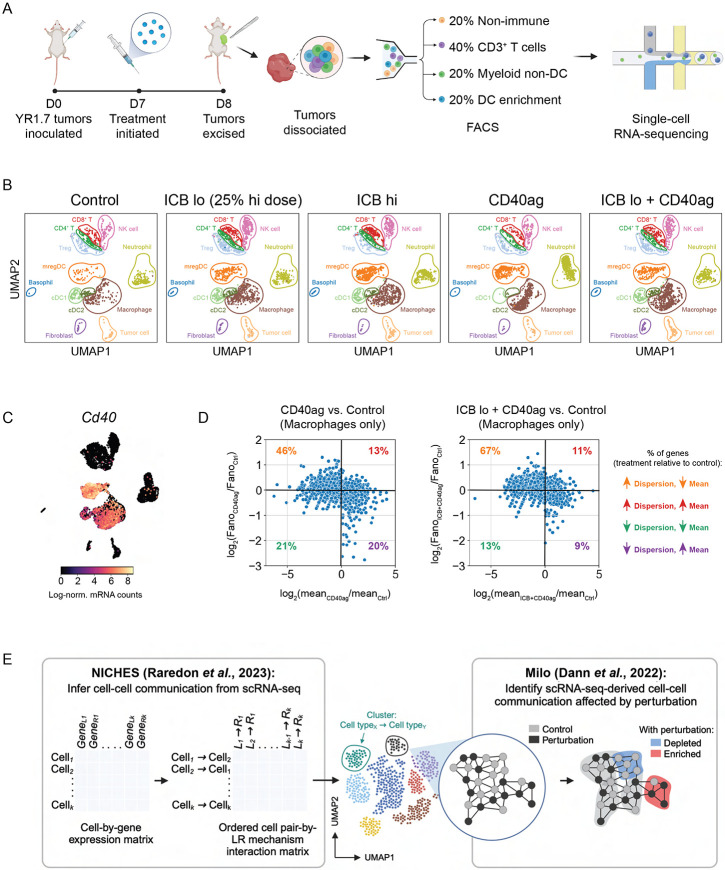
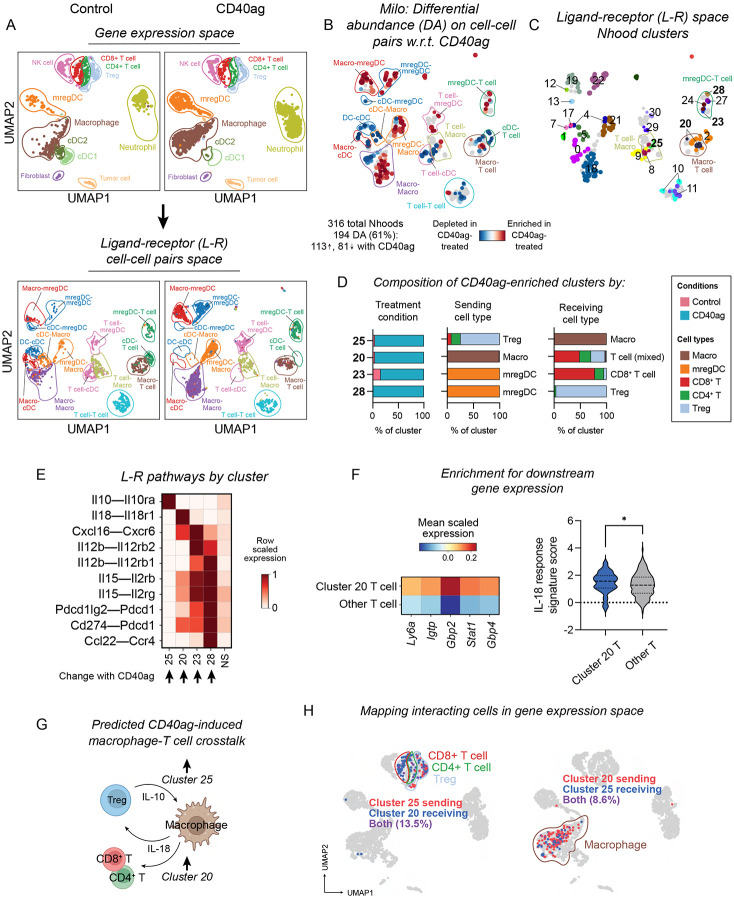
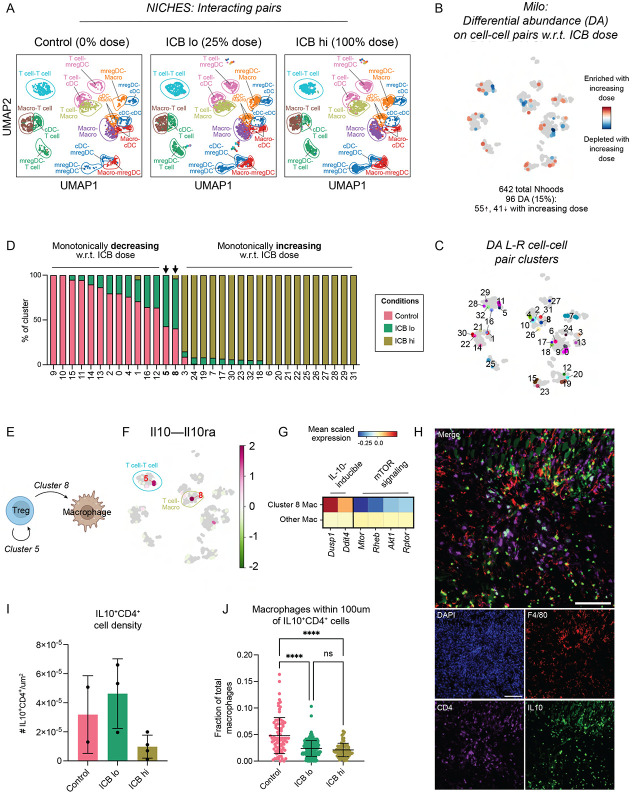
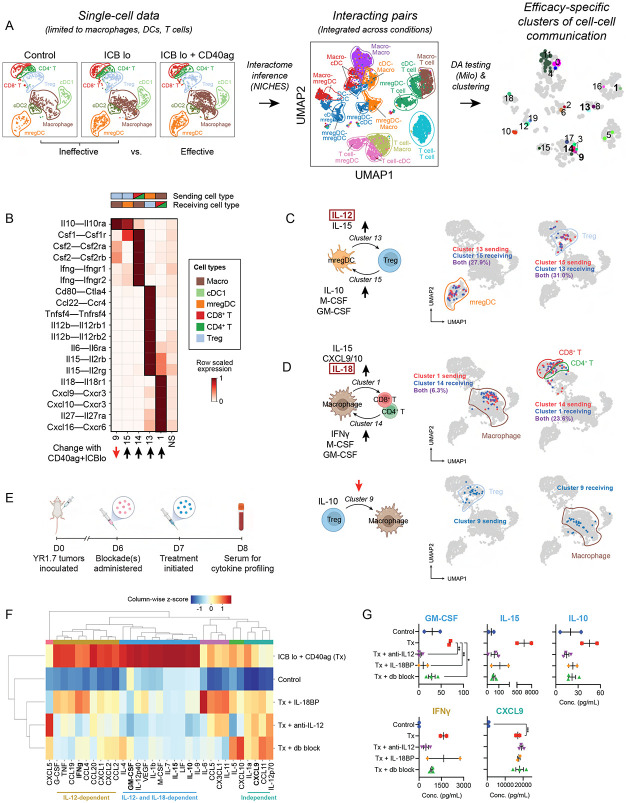
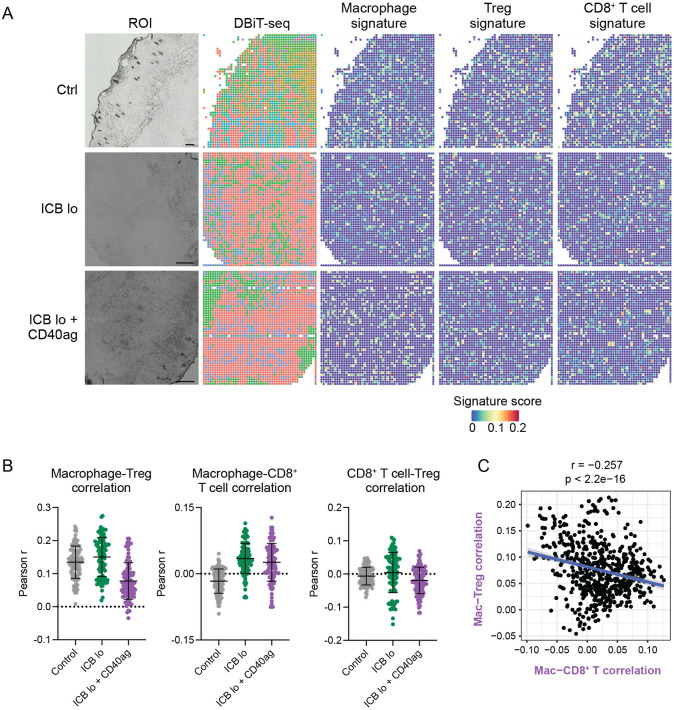
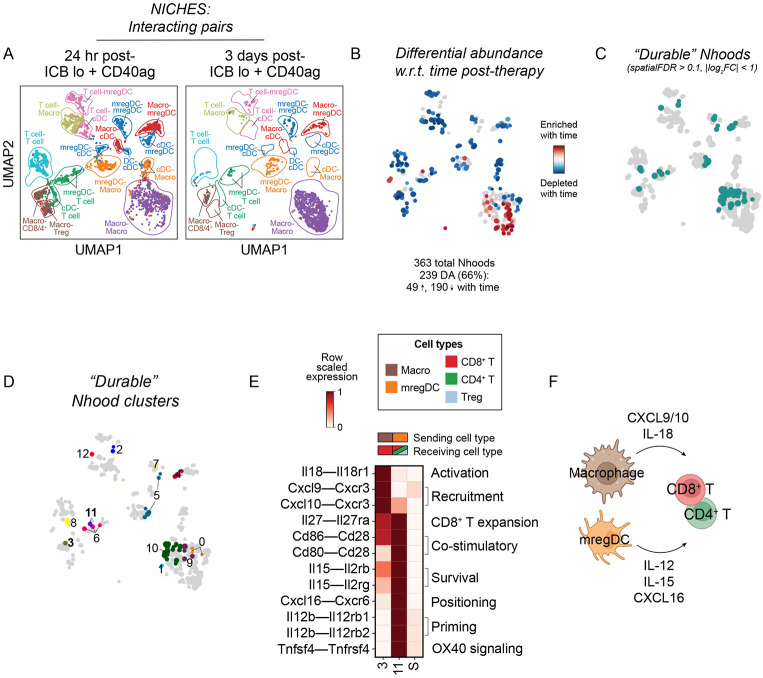
Effective cancer immunotherapies restore anti-tumor immunity by rewiring cell-cell communication. Treatment-induced changes in communication can be inferred from single-cell RNA-sequencing (scRNA-seq) data, but current methods do not effectively manage heterogeneity within cell types. Here we developed a computational approach to efficiently analyze scRNA-seq-derived, single-cell-resolved cell-cell interactomes, which we applied to determine how agonistic CD40 (CD40ag) alters immune cell crosstalk alone, across tumor models, and in combination with immune checkpoint blockade (ICB). Our analyses suggested that CD40ag improves responses to ICB by targeting both immuno-stimulatory and immunosuppressive macrophage subsets communicating with T cells, and we experimentally validated a spatial basis for these subsets with immunofluorescence and spatial transcriptomics. Moreover, treatment with CD40ag and ICB established coordinated myeloid-T cell interaction hubs that are critical for reestablishing antitumor immunity. Our work advances the biological significance of hypotheses generated from scRNA-seq-derived cell-cell interactomes and supports the clinical translation of myeloid-targeted therapies for ICB-resistant tumors.

Keywords: cancer immunotherapy; cell-cell communication; immune checkpoint blockade; mregDCs; single-cell RNA-sequencing (scRNA-seq); spatial transcriptomics; tumor microenvironment (TME); tumor-associated macrophages.


Conflict of interest statement

DECLARATION OF INTERESTS W. Damsky reports personal fees from Pfizer, Incite, Eli Lilly, TWI Biotechnology, Fresenius Kabi, Epiarx Diagnostics, and Boehringer Ingelheim; research support from Pfizer, Advanced Cell Diagnostics/Bio-techne, Abbvie, Bristol Myers Squibb, and Incite; and licensing fees from EMD/Millipore/Sigma outside the submitted work. H. Kluger reports grants from Apexigen and grants and personal fees from Bristol Myers Squibb during the conduct of the study; grants and personal fees from Merck, personal fees from Iovance, nonfinancial support from Celldex, as well as personal fees from Clinigen, Shionogi, Chemocentryx, Calithera, GigaGen, Signatera, GI Reviewers, Teva and Pliant Therapeutics outside the submitted work. R. Fan is scientific founder and adviser for IsoPlexis, Singleron Biotechnologies and AtlasXomics. S.M. Kaech reports personal fees and other support from Affini-T Therapeutics and EvolveImmune Therapeutics, and personal fees from Arvinas and Pfizer outside the submitted work. M. Bosenberg reports grants from AstraZeneca during the conduct of the study. The remaining authors declare no competing interests.

Figures

Figure 1.
Figure 1.. CD40ag combines with ICB to control growth of YR1.7 melanoma tumors.
(A) Schematic describing treatment regimen for survival experiments. WT C57Bl/6J mice were inoculated s.c. with YR1.7 melanoma cells at day 0 (2 tumors per mouse). Treatments by were administered by i.p. injection and were initiated on day 7 and repeated every three days, for a total of five doses. Tumor growth was monitored through 60 days post-tumor inoculation. Created with BioRender.com. (B) Kaplan-Meier survival curves for YR1.7-bearing mice either left untreated (n=9, dark grey), or treated with high dose ICB (n=11, orange), low dose ICB (n=11, green), CD40ag monotherapy (n=13, red), or ICB lo + CD40ag (n=14, purple). (C) Corresponding tumor volume (mm3) curves over time for survival data shown in (B). (D) Tumor volume at day 10 (72 hours post-therapy initiation if applicable) for control, ICB lo-treated, ICB hi-treated, CD40ag-treated, and CD40ag+ICB lo-treated tumors. Summary data is represented as mean ± SD. *p < 0.05, ***p < 0.001 denotes statistical significance by one-way ANOVA with Holm-Sidak multiple comparisons correction (calculated in GraphPad). (E) Two-dimensional UMAP embedding summarizing expression of an 11-dimensional panel of macrophage phenotype markers measured by flow cytometry by macrophages and monocytes (Live+CD45+CD3NK1.1B220Ly6GCD11b+CD24) sorted from 8-day YR1.7 tumors either left untreated (black) or treated with CD40ag (red) (data collection at 24 hours post-treatment if applicable). Plots to the left are colored by treatment condition, while the plots to the right are colored by mean fluorescence intensity (MFI) for each indicated surface marker, showing in detail the rapid phenotypic changes induced by CD40ag in TAMs.
Figure 2.
Figure 2.. scRNA-seq emphasizes heterogeneity in myeloid-specific responses to immunotherapy.
(A) Schematic describing treatment regimen and sorting strategy for single-cell RNA-sequencing (scRNA-seq) data collection. WT C57Bl/6J mice were inoculated with YR1.7 melanomas at day 0 (4 tumors from 2 mice per treatment group). Treatments were administered a single time at day 7, and tumors were excised and dissociated for sequencing 24 hours post-treatment at day 8. Prior to sequencing, tumors were FACS-sorted into four populations: CD45 (tumor and stroma), CD45+CD3+ (T cells), CD45+CD3CD19XCR1+ and CD45+CD3CD19CCR7+ (DC subsets), and CD45+CD3CD19XCR1CCR7 (other myeloid cells). These four populations were then recombined at a 1:2:1:1 ratio and submitted for scRNA-seq. Created with BioRender.com. (B) UMAP embedding of control, ICB lo-treated, ICB hi-treated, CD40ag-treated, and ICB lo + CD40ag-treated scRNA-seq samples (n=4 tumors per group) separated by treatment condition and colored by cell type assigned by a neural network-based classifier. (C) UMAP plot as in (B) colored by Cd40 expression. Cd40 transcripts were primarily expressed by myeloid cell types, including macrophages and dendritic cell subsets. (D) Scatter plots comparing macrophage-specific log-fold changes in mean gene expression (x-axis) and Fano factor (y-axis) for CD40ag monotherapy (left) or ICB lo + CD40ag (right) relative to control. Each dot represents a gene that was highly variable (mean ≥ 0.0125, dispersion ≥ 0.5) in macrophages across treatment conditions (E) Schematic depicting our computational strategy for inference and comparison of scRNA-seq-derived cell-cell communication networks. We use the novel combination of NICHES for cell-cell communication inference and Milo for differential abundance testing to efficiently compare predicted interaction networks across experimental conditions and identify treatment-specific ligand-receptor interactions from scRNA-seq. Created with BioRender.com.
Figure 3.
Figure 3.. Analyzing cell-cell communication at single-cell resolution uncovers candidate interactions that could limit efficacy of CD40ag monotherapy.
(A) UMAP embeddings of (top) single cells and (bottom) NICHES interactomes for control and CD40ag monotherapy-treated YR1.7 samples separated by treatment condition and colored by (top) cell type or (bottom) broad cell type pair. Cell type pairs are ordered to reflect cell type 1 (sender)-cell type 2 (receiver). (B) UMAP embedding of 316 Milo-assigned ‘neighborhoods’ (nhoods) of cell-cell pairs colored by differential abundance result w.r.t. treatment. Grey nhoods were not differentially abundant (n=127), while blue (n=81) and red (n=113) nhoods decreased and increased in frequency, respectively, with CD40ag treatment. (C) UMAP embedding of differentially abundant nhoods (n=194) colored by grouping for downstream analyses. (D) Stacked bar graphs summarizing the cell-cell pairs which make up differentially abundant clusters 25, 20, 23, and 28 by (left) treatment condition, (center) sending cell type, and (right) receiving cell type. (E) Heatmap of per-row scaled interaction scores for selected differentially predicted ligand-receptor axes (y-axis) across clusters 25, 20, 23, and 28 and compared to all non-differentially abundant neighborhoods (i.e., NS) (x-axis). (F) (Left) Heatmap summarizing mean scaled expression of the top 5 CD8+ T cell-specific IL-18 signature genes (via the Immune Dictionary). (Right) Violin plot summarizing distributions of single-cell-level average expression of the top 25 CD8+ T cell-specific IL-18 signature genes (via the Immune Dictionary) minus average expression of randomly sampled reference genes (i.e., ‘IL-18-response signature score’). Both plots compare expression or signature score for receiving T cells (cluster 20) versus all other T cells across treatments. *p < 0.05 denotes statistical significance by Mann-Whitney U test (calculated with GraphPad). (G) Schematic illustrating macrophage-T cell communication that we predict to be acutely upregulated with CD40ag monotherapy relative to control. (H) UMAP embedding as in (A, top) colored by T cells (left) and macrophage (right) predicted to interact in clusters 20 and 25.
Figure 4.
Figure 4.. Immunosuppressive cell-cell communication between Tregs and macrophages in enriched with ineffective ICB dose.
(A) UMAP embedding of NICHES interactomes for control, ICB lo- and ICB hi-treated samples separated by treatment condition and colored by broad cell type pair. (B) UMAP embedding of 642 Milo-assigned ‘neighborhoods’ (nhoods) of cell-cell pairs colored by differential abundance result w.r.t. ICB dose. Grey nhoods were not differentially abundant (n=546), while blue (n=41) and red (n=55) nhoods decreased and increased in frequency, respectively, with increased ICB dose. (C) UMAP embedding of differentially abundant nhoods (n=96) colored by grouping for downstream analyses. (D) Stacked bar graph summarizing the cell-cell pairs which make up each differentially abundant cluster in (C) by treatment condition. (E) Schematic describing Treg-to-Treg (Cluster 5) and Treg-to-macrophage (Cluster 8) communication predicted by our pipeline to be upregulated with ICB lo treatment relative to control and ICB hi. (F) UMAP embedding of NICHES interactomes grouped into Milo-derived nhoods and colored by predicted interaction score along Il10 – Il10ra as averaged across single cell-cell pairs in each nhood. (G) Heatmap summarizing mean scaled expression of IL-10-inducble genes Dusp1 and Ddit4 and mTOR pathway component-encoding genes Mtor, Rheb, Akt1, and Rtpor in receiving macrophages (cluster 8) versus all other macrophages across treatments. (H) Representative image of an 8-day untreated YR1.7 tumor inoculated in a B6.129S6-Il10tm1Flv/J mouse, stained for nuclei (DAPI, blue), F4/80 (red), CD4 (purple), and IL10 (GFP). Scale bars are 100μm. (I) Bar graph demonstrating quantification of CD4+IL-10+ T cell density (absolute number of CD4+IL-10-GFP+ cells divided by tumor area [μm2]) from control (pink), ICB lo- (green) and ICB hi-treated (yellow) tumor slices (n=2-4 regions from 1 tumor per treatment condition). Summary data is presented as mean ± SD. (J) Scatter plot demonstrating the fraction of total macrophages (F4/80+) within 100 μm of CD4+IL-10+ T cells from control (pink), ICB lo- (green) and ICB hi-treated (yellow) tumor slices. Summary data is presented as mean ± SD. ****p < 0.0001 by Kruskal-Wallis test (calculated in GraphPad).
Figure 5.
Figure 5.. Single-cell resolved cell-cell interaction analysis shows that CD40ag combines with ICB to activate a coordinated cytokine-chemokine network between DCs, macrophages, and T cells.
(A) UMAP embeddings of macrophages, DC subsets, and T cell subsets in gene expression space (left); and of corresponding NICHES interactomes (center) colored by broad cell type pair and (right) grouped into nhoods for differential abundance testing and colored by cluster for downstream analyses. Interactomes across experimental conditions (Control, ICB lo, ICB lo + CD40ag) are combined into a single visualization. (B) Heatmap depicting per-row scaled interaction scores for selected differentially predicted ligand-receptor axes (y-axis) across clusters 9, 15, 14, 13, 16, and 1 and compared to all non-differentially abundant neighborhoods (i.e., NS) (x-axis). The key above the heatmap distinguishes which cell type sender-receiver pairs are involved in each highlighted cluster. (C-D) UMAP embeddings as in (A, left) colored by (C) mregDCs (left) and Tregs (right) predicted to interact in clusters 13 and 15, (D, top) macrophages (left) and T cells (right) predicted to interact in clusters 1 and 14, and by (D, bottom) Tregs (left) and macrophages (right) predicted to interact in cluster 9. (E) Schematic illustrating the timeline of serum collection for peripheral blood cytokine and chemokine (C/C) profiling from ICB lo + CD40ag-treated YR1.7 tumor-bearing WT C57Bl/6J mice which had been previously treated with IL-12 and/or IL-18 blockade. Created with BioRender.com. (F) Hierarchical clustering of average C/C data from YR1.7 tumor-bearing mice either left untreated (n=3), or treated with ICB lo + CD40ag (n=2, abbreviated Tx in figure), Tx + IL18BP-Fc (n=2), Tx + anti-IL12 Ab (n=3), or Tx + anti-IL12 Ab + IL18BP-Fc (n=3). C/Cs were grouped into 6 modules for downstream analyses. (G) Example plots of peripheral blood cytokine expression levels for GM-CSF, IL-15, IL-10, IFNg, and CXCL9, from samples shown in (F). Summary data is presented as mean ± SEM. *p < 0.05, **p < 0.01 by ordinary one-way ANOVA with Dunnett’s multiple comparisons testing (calculated in GraphPad). Only showing significant results for comparisons between Tx and other conditions.
Figure 6.
Figure 6.. ICB and CD40ag acutely and differentially alter immune spatial orientation and inflammatory signaling.
(A) DBiT-seq spatial transcriptomics analysis of YR1.7 tumors harvested from mice 24 hours post-treatment where applicable. Left: Region of interest (ROI). Middle: DBiT-seq spots. Right: macrophage, Treg, and CD8+ T cell signature scores for each pixel in the spatial transcriptomics spot map demonstrating the presence of each cell type in the TME. Scale bars are 200 μm. (B) Scatter plots demonstrating per-pixel Pearson correlation coefficients between (left) macrophage and Treg signature scores, (middle) macrophage and CD8+ T cell signature scores, and (right) CD8 + T cell and Treg signature scores for 100 20x20 grids randomly sampled from each DBiT-seq sample (control – grey, ICB lo – green, ICB lo + CD40ag – purple). Summary data is presented as mean ± SD. (C) Scatter plot comparing correlation between macrophage and CD8+ T cell signature scores (x-axis) to correlation between macrophage and Treg signature scores (y-axis) for corresponding 1000 20x20 grids randomly sampled from the ICB lo + CD40ag-treated DBiT-seq sample.
Figure 7.
Figure 7.. Characterization of ‘durable’ therapy-induced interactions across time.
(A) UMAP embedding of NICHES interactomes for ICB lo+CD40ag-treated samples collected at 24- and 72-hours post-treatment separated by timepoint and colored by broad cell type pair. (B) UMAP embedding of 363 Milo-assigned ‘neighborhoods’ (nhoods) of cell-cell pairs colored by differential abundance result w.r.t. time post-treatment. Grey nhoods were not differentially abundant (n=124), while blue (n=190) and red (n=49) nhoods decreased and increased in frequency, respectively, with time post-treatment. (C-D) UMAP embedding as in (B) colored by ‘durable’ nhoods (spatialFDR > 0.1, abs(log2FC) < 1), which were grouped into 13 clusters for downstream analysis. (E) Heatmap depicting per-row scaled interaction scores for selected ligand-receptor axes (y-axis) across ‘durable’ clusters 3 and 11 and compared to all differentially abundant neighborhoods (i.e., S) (x-axis). The key above the heatmap distinguishes which cell type sender-receiver pairs are involved in each highlighted cluster. (F) Schematic illustrating myeloid-T cell communication predicted to be durably upregulated with ICB lo + CD40ag.

References

    1. Keren L., Bosse M., Marquez D., Angoshtari R., Jain S., Varma S., Yang S.-R., Kurian A., Valen D.V., West R., et al. (2018). A Structured Tumor-Immune Microenvironment in Triple Negative Breast Cancer Revealed by Multiplexed Ion Beam Imaging. Cell 174, 1373–1387.e19. 10.1016/j.cell.2018.08.039. - DOI - PMC - PubMed
    1. Walsh L.A., and Quail D.F. (2023). Decoding the tumor microenvironment with spatial technologies. Nat Immunol 24, 1982–1993. 10.1038/s41590-023-01678-9. - DOI - PubMed
    1. Lee J., Kim D., Kong J., Ha D., Kim I., Park M., Lee K., Im S.-H., and Kim S. (2024). Cell-cell communication network-based interpretable machine learning predicts cancer patient response to immune checkpoint inhibitors. Science Advances 10, eadj0785. 10.1126/sciadv.adj0785. - DOI - PMC - PubMed
    1. Bridges K., and Miller-Jensen K. (2022). Mapping and Validation of scRNA-Seq-Derived Cell-Cell Communication Networks in the Tumor Microenvironment. Front Immunol 13, 885267. 10.3389/fimmu.2022.885267. - DOI - PMC - PubMed
    1. Dimitrov D., Türei D., Garrido-Rodriguez M., Burmedi P.L., Nagai J.S., Boys C., Ramirez Flores R.O., Kim H., Szalai B., Costa I.G., et al. (2022). Comparison of methods and resources for cell-cell communication inference from single-cell RNA-Seq data. Nat Commun 13, 3224. 10.1038/s41467-022-30755-0. - DOI - PMC - PubMed

Publication types