[Preprint]. 2024 Nov 1:2024.10.29.620732.
doi: 10.1101/2024.10.29.620732.

Tenascin-C from the tissue microenvironment promotes muscle stem cell self-renewal through Annexin A2

Affiliations

Tenascin-C from the tissue microenvironment promotes muscle stem cell self-renewal through Annexin A2

Mafalda Loreti et al. bioRxiv. .

Abstract

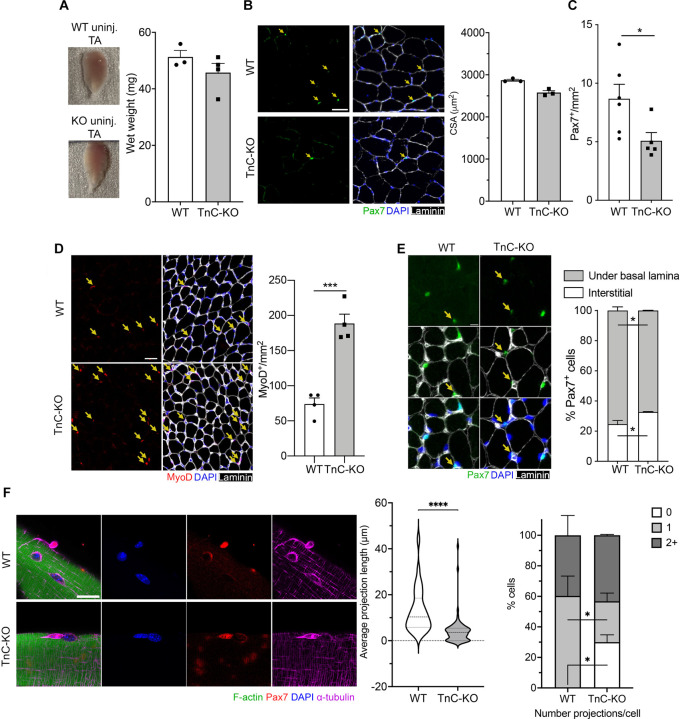
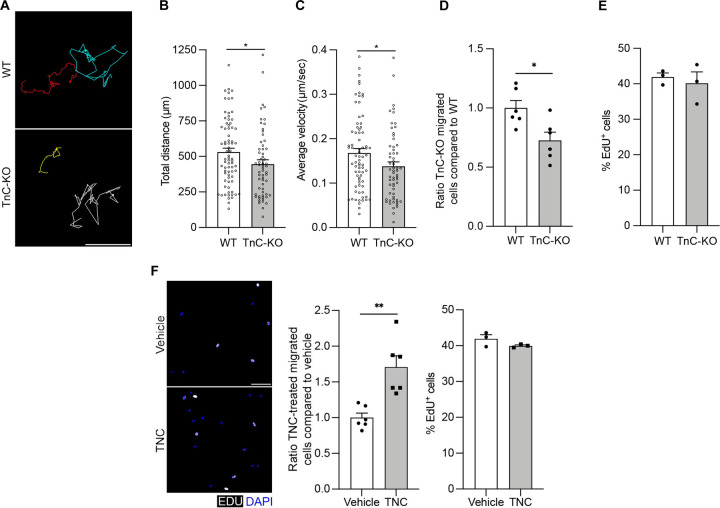
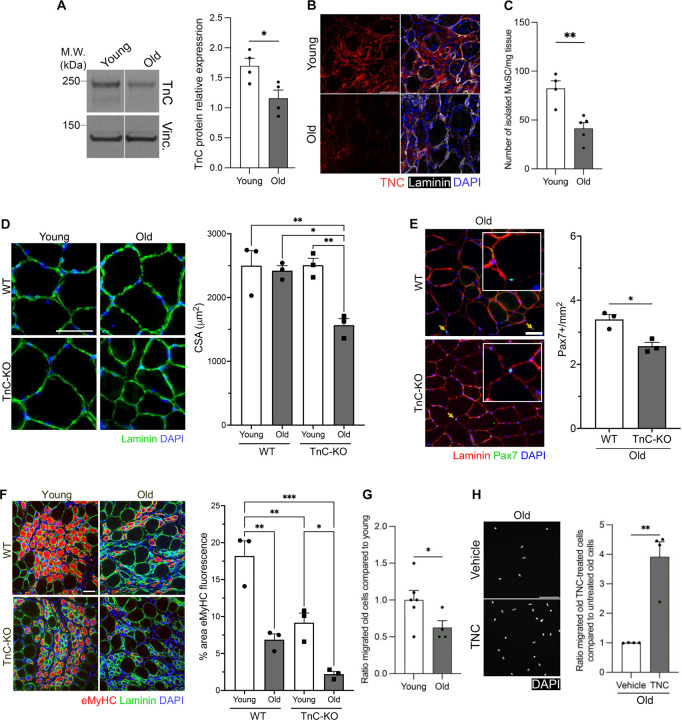
Skeletal muscle tissue self-repair occurs through the finely timed activation of resident muscle stem cells (MuSC). Following perturbation, MuSC exit quiescence, undergo myogenic commitment, and differentiate to regenerate the injured muscle. This process is coordinated by signals present in the tissue microenvironment, however the precise mechanisms by which the microenvironment regulates MuSC activation are still poorly understood. Here, we identified Tenascin-C (TnC), an extracellular matrix (ECM) glycoprotein, as a key player in promoting of MuSC self-renewal and function. We show that fibro-adipogenic progenitors (FAPs) are the primary cellular source of TnC during muscle repair, and that MuSC sense TnC signaling through cell the surface receptor Annexin A2. We provide in vivo evidence that TnC is required for efficient muscle repair, as mice lacking TnC exhibit a regeneration phenotype of premature aging. We propose that the decline of TnC in physiological aging contributes to inefficient muscle regeneration in aged muscle. Taken together, our results highlight the pivotal role of TnC signaling during muscle repair in healthy and aging skeletal muscle.


Conflict of interest statement

COMPETING FINANCIAL INTERESTS The authors declare no competing financial interests.

Figures

Figure 1.
Figure 1.. TnC is required for MuSC quiescence and pool maintenance
(A) Whole tibialis anterior (TA) muscles from wild type (WT) and TnC knockout (TnC-KO) adult (3–6 months old) mice and quantification of their wet weight (mg) (n≥3). (B)Representative immunofluorescence (IF) images of uninjured TA muscle cross-sections from WT and TnC-KO adult (3–4 months old) mice (Pax7, green; laminin, gray; DAPI, blue). Scale bar = 50 µm. Quantification of the cross-sectional area (CSA) in µm2 (n=3). (C) Quantification of the number of Pax7+ nuclei per mm2 (n≥5 mice). (D) IF images of cross-sections from P14 TA muscles of WT and TnC-KO adult (3–4 months old) mice (MyoD, red; laminin, gray; DAPI, blue). Scale bar= 50 µm. Quantification of the number of MyoD+ nuclei per mm2 (n=4). (E) Representative IF images of cross-sections from uninjured TA muscles of WT and TnC-KO P14 mice for quantification of Pax7+ cell localization (Pax7, green; laminin, gray; DAPI, blue). Scale bar= 10 µm. Quantification of Pax7+ cell localization under the basal lamina (quiescent) or in the interstitial space (activated) in WT versus TnC-KO muscles (n≥4). (F) Representative IF images of WT and TnC-KO freshly isolated myofibers from adult mice (F-actin, green; Pax7, red; α-tubulin, magenta; DAPI, blue). Scale bar= 20 µm. Quantification of the distribution of quiescence projection length, and the number of projections per cell (n=3). Data are represented as mean ± SEM; *p<0.05, ***p<0.001, ****p<0.0001, t test (A, B, C, D, E, F); *p<0.05, Two-way ANOVA (E, F). Data are represented as the median with quartiles; ****p<0.0001, t test (F).
Figure 2.
Figure 2.. TnC expression peaks a 5DPI and promotes MuSC self-renewal
(A) Representative Western blot of TnC expression kinetics in uninjured and regenerating whole muscle protein lysates from adult (3–6 months old) mice and quantification (n=3). (B) Representative immunofluorescence (IF) images of cross-sections from uninjured and injured (5 DPI, and 14 DPI) TA muscles of WT adult mice (TnC red, DAPI blue). Scale bar= 50 µm. (C) Representative IF images for embryonic myosin heavy-chain (eMyHC) of injured TA muscles (5 DPI) in adult WT and TnC-KO mice (eMyHC, green; laminin, gray; DAPI, blue). Scale bar= 50 µm. Quantification of the cross-sectional area (CSA) (n=4). (D) Representative IF images of Pax7+ cells in injured (5 DPI) TA muscles in adult WT and TnC-KO mice (Pax7, green; laminin, gray; DAPI, blue). Scale bar= 50 µm. Quantification of the number of Pax7+ nuclei per mm2 (n=4). (E) Representative IF images of MyoD+ cells in injured (5 DPI) TA muscles in adult WT and TnC-KO mice (MyoD, red; laminin, gray; DAPI, blue). Scale bar= 50 µm. Quantification of MyoD+ cells per mm2 (n=3). (F) Representative IF images of Pax7+ cells in injured (30 DPI) or double-injured (30 DPI + 30 PDI) TA muscles in adult WT and TnC-KO mice (Pax7, green; laminin, red; DAPI, blue) (Scale bar= 50 µm) and quantification per mm2 (n=3). Data are represented as mean ± SEM; *p<0.05, one-way ANOVA (A); *p<0.05, **p<0.01, t test (C, D, E); *p<0.05, Two-way ANOVA (F).
Figure 3.
Figure 3.. TnC from the tissue microenvironment is required for MuSC function
(A) scRNA-seq analysis of TnC expression at 5 DPI TA muscles of adult WT mice. Data originally from Oprescu et al., 2020. (B, C) TnC mRNA expression dynamics in MuSC and FAPs from uninjured and regenerating TA muscles at different DPIs (0.5 – 21). Data originally from Oprescu et al., 2020. (D, E) TnC mRNA expression dynamics in MuSC and FAPs in uninjured and at 3 and 7 DPIs with qPCR. (F, G) Sender-Receiver Probability Heatmap of the tenascin signaling network in uninjured and 5 DPI TA muscles. Data originally from Oprescu et al., 2020. (H, I) Chord diagrams representing incoming signaling to MuSC in uninjured and 5 DPI TA muscles. Data originally from Oprescu et al., 2020. (J) IF images representing the contribution of transplanted RFP-labeled WT MuSC from adult 3 months old donor mice to regenerating TA muscles of WT or TnC-KO age-matched recipient mice (regenerating fibers – RFP, red, DAPI blue) (Scale bar= 50 µm) and quantification of RFP+ myofibers (n≥3 mice). (K) Representative IF images of WT MuSC/WT FAP co-cultures from adult mice (Pax7, green; TnC, red; DAPI, blue). Yellow arrows indicate TnC in MuSC. Scale bar= 50 µm. (L) Representative IF images of WT MuSC monocultures (Pax7, red; DAPI blue) (scale bar= 50 µm) and co-cultures of MuSC and FAPs from WT and TnC-KO adult mice (Pax7, green; TnC, red; DAPI, blue) (Scale bar= 50 µm). Quantification of Pax7+ cells normalized on WT MuSC monoculture. Data are represented as mean ± SEM; **p<0.01, ***p<0.001, one-way ANOVA (D, E), *p<0.05, t test (J), *p<0.05, one-way ANOVA (L).
Figure 4.
Figure 4.. TnC signals through Annexin A2 to maintain MuSC in quiescence
(A) Violin plots depicting the different expression dynamics AnxA2, Pax7, and Pdgfra at different DPIs (0, 3.5, 5, 21) in MuSC and FAPs (online available dataset). (B) Western blot analysis for Annexin A2 on TnC-immunoprecipitated 5 DPI TA muscle protein lysate samples. (C) Validation by immunofluorescence (IF) of Annexin A2 expression in WT MuSC in vitro (Pax7, green; Annexin A2, red; DAPI, blue) (Scale bar= 20µm). (D) Dot plot representing the changes in the relative expression of TnC and the percentages of TnC expressing cellpopulations within Pax7+/AnxA2+ and Pax7+/AnxA2 MuSC and Pdgfra+/AnxA2+ and Pdgfra+/AnxA2 FAPs in uninjured TA muscles and across different timepoints (3.5, 5, 21 DPI). Data originally from Oprescu et al., 2020. (E) Representative IF images of GFP control and AnxA2 knockdown (KD) being treated or not with recombinant TnC (48h treatment) (GFP, green; Pax7, red; DAPI, blue) (scale bar= 50 µm) and quantification of Pax7+ cells normalized on non-treated GFP control MuSC (n=3, Nfov=30). Data are represented as mean ± SEM; ****p<0.0001, one-way ANOVA (E).
Figure 5.
Figure 5.. TnC promotes MuSC migration in vitro
(A) Representative images of time-lapse microscopy to track cultured MuSC from adult WT and TnC-KO mice. Scale bar= 50 µm. (B) Quantification of total distance covered (n= 3, Ncell≥75). (C) Quantification of average velocity of cells (n= 3, Ncell≥75). (D) Quantification of migrated TnC-KO cells through transwell matrix normalized on WT (n=6). (E) Quantification of the percentage of proliferating cells through EdU staining (timepoint= 48 hours) (n=3). (F) Representative immunofluorescence (IF) images of migrated WT MuSC from adult (3–5 months old) mice with or without recombinant TnC treatment (EdU gray, DAPI blue) (scale bar= 50 µm). Quantification of normalized migrated TnC-KO cells through transwell matrix after TnC treatment (timepoint= 48 hours) (n=6) and quantification of the percentage of proliferating cells through EdU staining (timepoint= 48 hours) (n=3). Data are represented as mean ± SEM; *p<0.05 and **p<0.01, t test.
Figure 6.
Figure 6.. TnC declines with aging and is required for muscle maintenance and regeneration of aged skeletal muscles.
(A) Western blot for TnC on young (3–5 months old) and old (18–26 months old) WT mice and quantification of TnC protein relative expression (n=4). (B) Representative immunofluorescence (IF) images of 5 DPI TA muscles of young and old mice (TnC red; laminin gray; DAPI blue). Scale bar= 50 µm.. (C) Quantification of the number of FACS isolated MuSC per mg of muscle tissue in young and old mice (n≥4 mice).. (D) Representative IF images of cross-sections of uninjured TA muscles from young (4–6 months old) and old WT (23–29 months old) and TnC-KO mice (laminin, green; DAPI, blue) (scale bar= 50 µm) and quantification of the cross-sectional area (CSA) in µm2 (n=3).. (E) Representative IF images of cross-sections of uninjured TA muscles from old WT and TnC-KO mice (Pax7, green; laminin, red; DAPI blue) (scale bar= 50 µm) for Pax7+ cell quantification (n=3).. (F) Representative IF images of cross-sections of injured (5 DPI) TA muscles from young and old WT and TnC-KO mice (laminin, green; eMyHC, red; DAPI, blue) (scale bar= 50 µm) and quantification of the percentage of regenerating area (eMyHC+) (n=3).. (G) Quantification of migrated aged WT MuSC through transwell matrix (48 hours culture) normalized on WT young mice (n≥4).. (H) Representative IF images of migrated cells with or without recombinant TnC treatment (timepoint= 48 hours) (DAPI, gray) (scale bar= 50 µm) and quantification of migrated aged WT MuSC through transwell matrix after TnC treatment normalized on control non-treated cells (n=4 mice).. Data are represented as mean ± SEM; *p<0.05, **p<0.01, t test (A, C, E, G, H), *p<0.05, **p<0.005, ***p<0.0001, one-way ANOVA (D, F).

References

    1. Dumont N.A., Wang Y.X., and Rudnicki M.A. (2015). Intrinsic and extrinsic mechanisms regulating satellite cell function. Development 142, 1572–1581. 10.1242/dev.114223. - DOI - PMC - PubMed
    1. Yin Y., He G.J., Hu S., Tse E.H.Y., and Cheung T.H. (2024). Muscle stem cell niche dynamics during muscle homeostasis and regeneration. Curr Top Dev Biol 158, 151–177. 10.1016/bs.ctdb.2024.02.008. - DOI - PubMed
    1. Majchrzak K., Hentschel E., Honzke K., Geithe C., and von Maltzahn J. (2024). We need to talk-how muscle stem cells communicate. Front Cell Dev Biol 12, 1378548. 10.3389/fcell.2024.1378548. - DOI - PMC - PubMed
    1. Joe A.W., Yi L., Natarajan A., Le Grand F., So L., Wang J., Rudnicki M.A., and Rossi F.M. (2010). Muscle injury activates resident fibro/adipogenic progenitors that facilitate myogenesis. Nat Cell Biol 12, 153–163. 10.1038/ncb2015. - DOI - PMC - PubMed
    1. Uezumi A., Fukada S., Yamamoto N., Takeda S., and Tsuchida K. (2010). Mesenchymal progenitors distinct from satellite cells contribute to ectopic fat cell formation in skeletal muscle. Nat Cell Biol 12, 143–152. 10.1038/ncb2014. - DOI - PubMed

Publication types

LinkOut - more resources