[Preprint]. 2024 Nov 3:2024.10.31.621399.
doi: 10.1101/2024.10.31.621399.

Metabolic regulation of RNA methylation by the m6A-reader IGF2BP3

Affiliations

Metabolic regulation of RNA methylation by the m6A-reader IGF2BP3

Gunjan Sharma et al. bioRxiv. .

Update in

  • IGF2BP3 redirects glycolytic flux to promote one-carbon metabolism and RNA methylation.
    Sharma G, Gutierrez M, Jones AE, Kapoor S, Jaiswal AK, Neeb ZT, Rios A, Dorairaj P, Thaxton ML, Lin TL, Tran TM, Kabbani LES, Ritter AJ, Scherer GM, Sorrentino JP, Stiles L, Hoeve JT, Damoiseaux RD, Garg NK, Divakaruni AS, Sanford JR, Rao DS. Sharma G, et al. Cell Rep. 2025 Oct 28;44(10):116330. doi: 10.1016/j.celrep.2025.116330. Epub 2025 Sep 26. Cell Rep. 2025. PMID: 41015030 Free PMC article.

Abstract

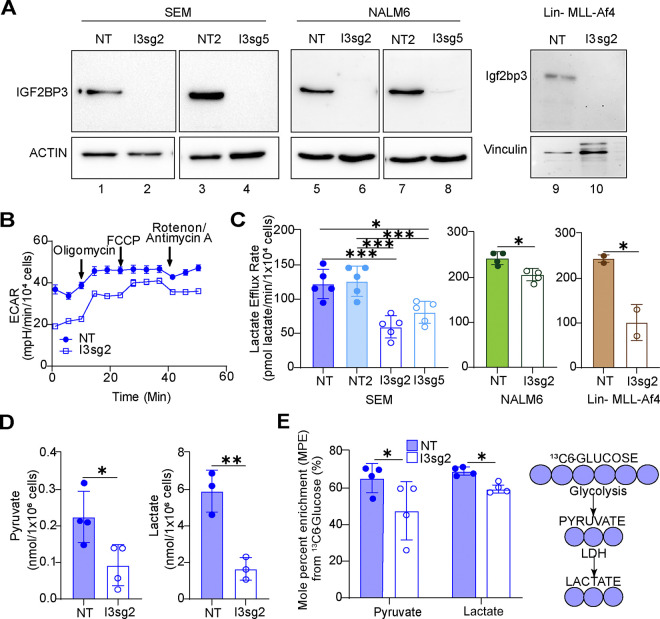
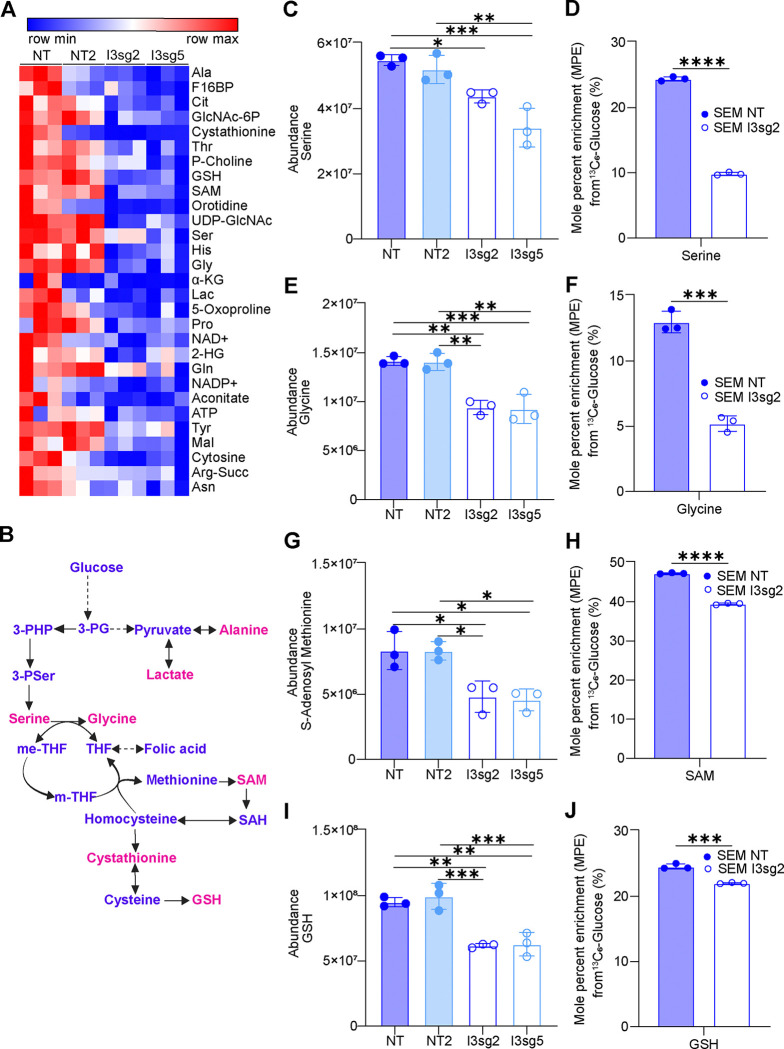
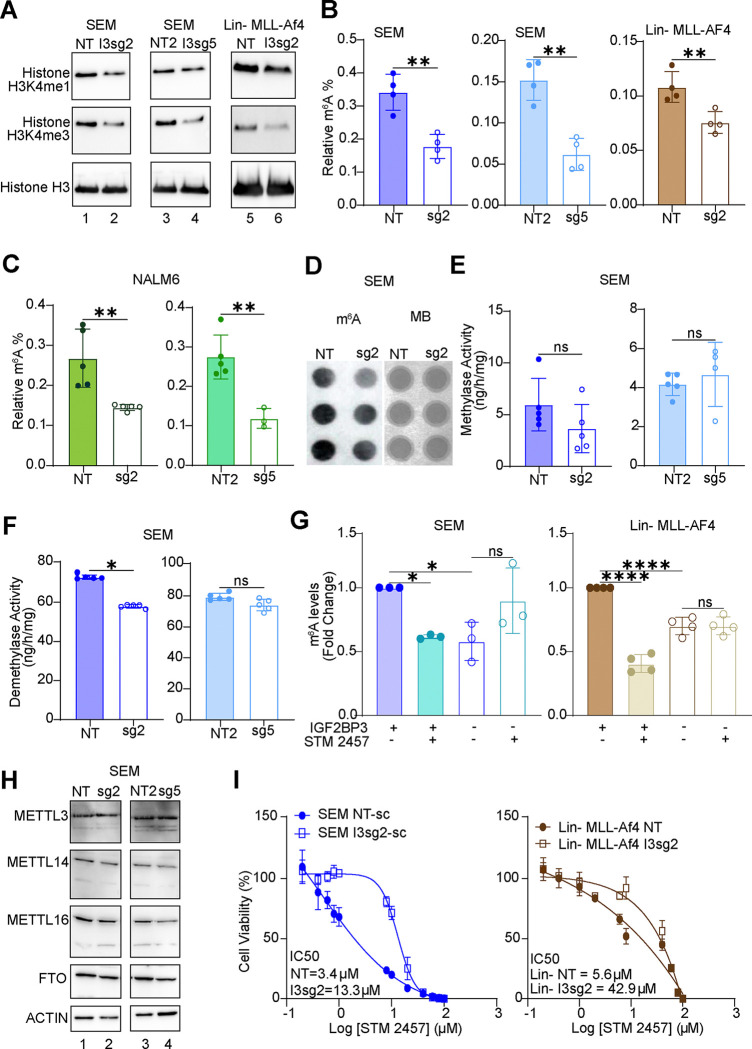
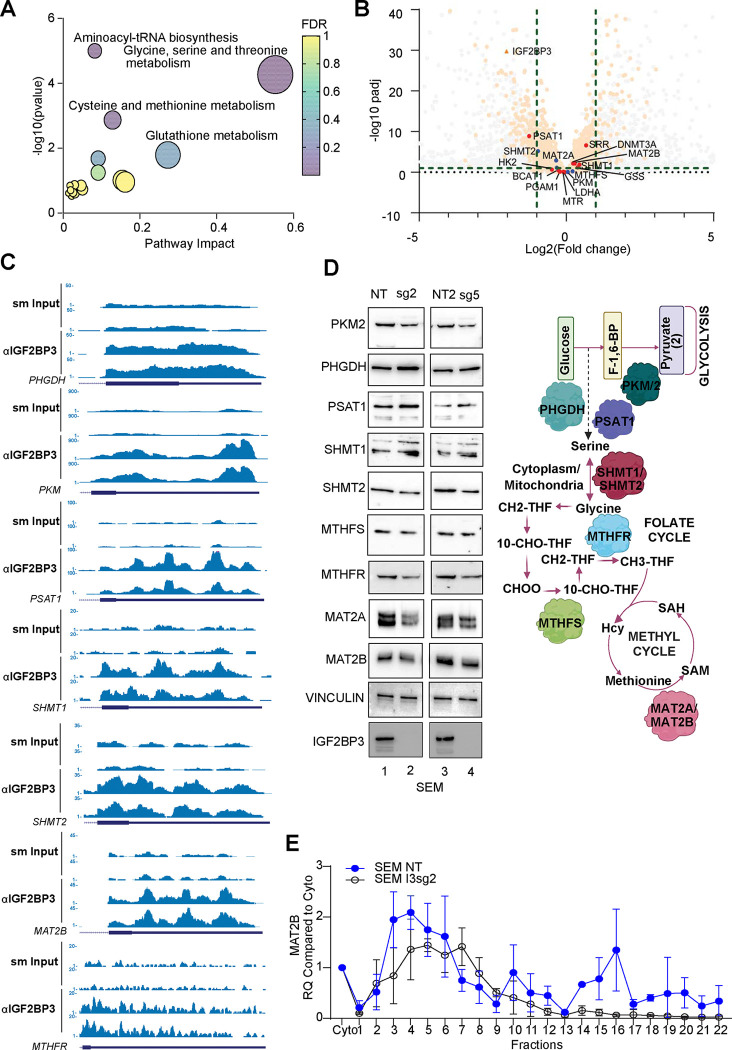
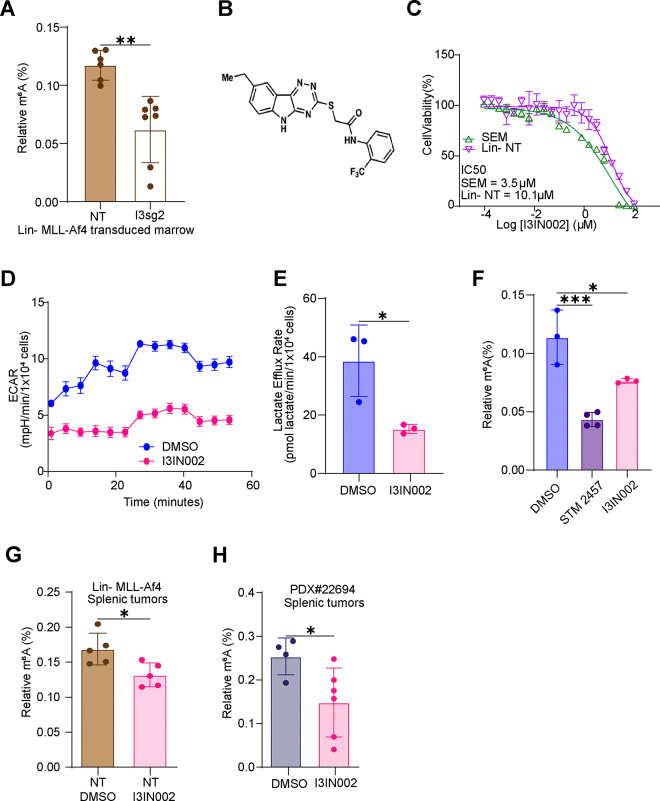
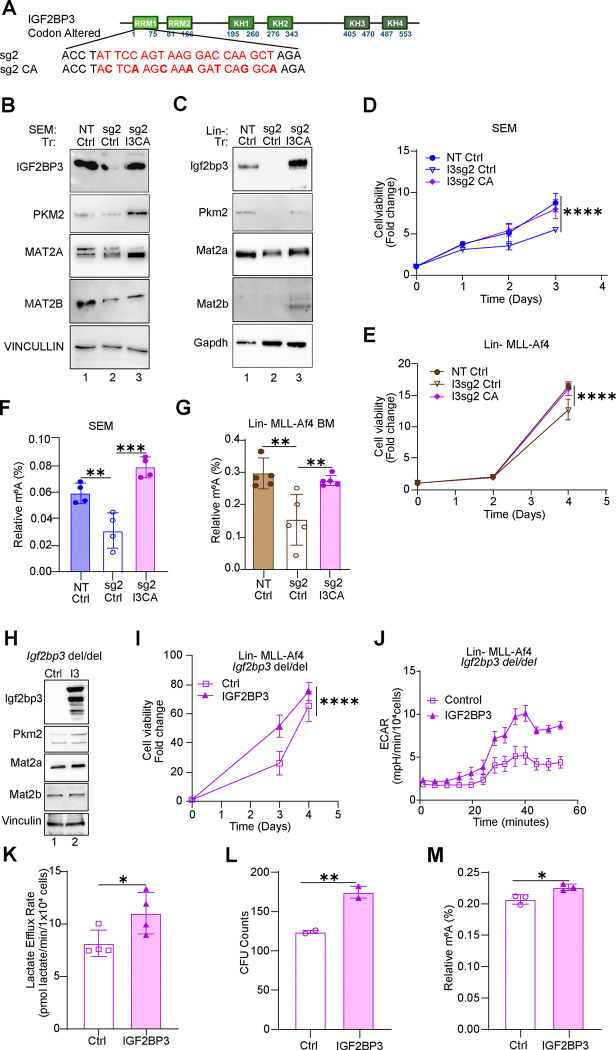
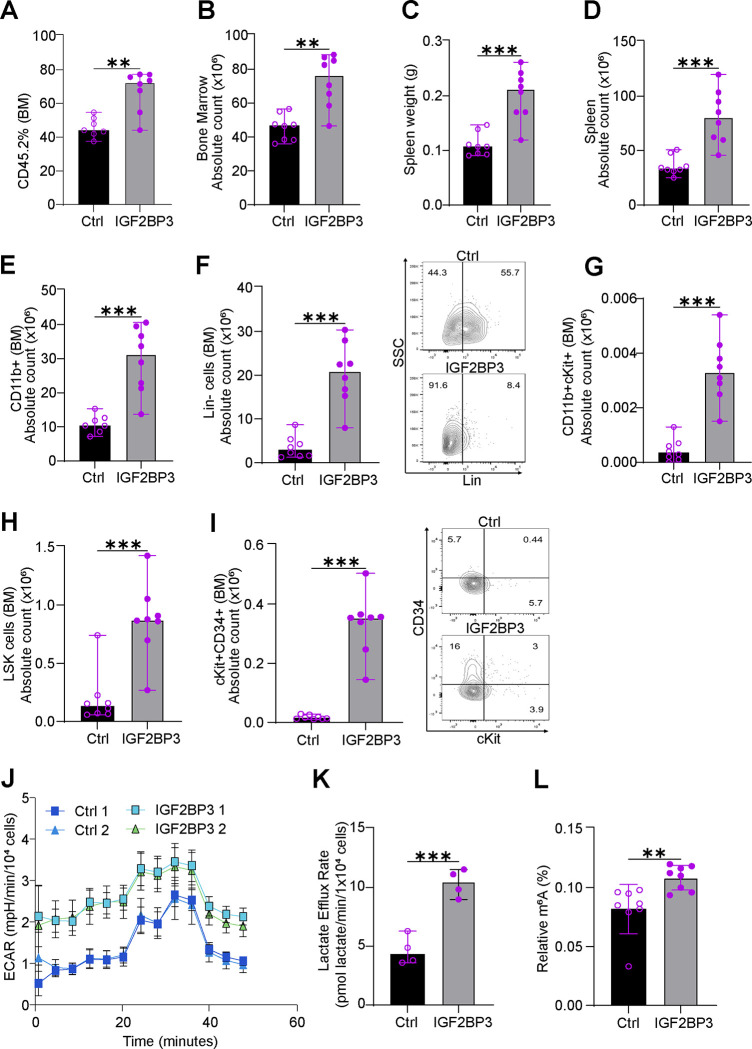
The interplay of RNA modifications - deposited by "writers", removed by "erasers" and identified by RNA binding proteins known as "readers" - forms the basis of the epitranscriptomic gene regulation hypothesis. Recent studies have identified the oncofetal RNA-binding protein IGF2BP3 as a "reader" of the N6-methyladenosine (m6A) modification and crucial for regulating gene expression. Yet, how its function as a reader overlaps with its critical oncogenic function in leukemia remains an open question. Here, we report the novel finding that the reader IGF2BP3 reprograms cellular metabolism, resulting in an altered ability of the "writers" to modify the epitranscriptome. In leukemia cells, IGF2BP3 supports increased glycolytic flux and one-carbon metabolism, leading to increased production of S-adenosyl methionine (SAM), a key substrate for methylation reactions within the cell. IGF2BP3 directly regulates the translation of MAT2B, the regulatory subunit of the methionine-adenosyltransferase complex, which is the final enzyme in a pathway leading to SAM production. This, in turn, results in increased m6A modifications on RNA, resulting in positive feedback regulation. This novel mechanism illustrates how metabolism mutually acts with epitranscriptomic modifications, underscoring the pervasive impact of IGF2BP3 in gene regulatory mechanisms governing a broad range of cancer-specific processes.


Conflict of interest statement

CONFLICT OF INTEREST DISCLOSURES DSR has served as a consultant to AbbVie, a pharmaceutical company that develops and markets drugs for hematologic disorders. DSR, MLT and AKJ are inventors on a patent application that includes the compound I3IN-002.

Figures

Figure 1.
Figure 1.. IGF2BP3 impacts glycolytic metabolism in B-acute lymphoblastic leukemia cells.
A. Western blots for IGF2BP3-deleted (I3sg2, I3sg5) in SEM, NALM6 and Lin-/MLL-Af4 murine cells. B. Seahorse XF Extracellular acidification rate (ECAR) kinetic trace in control and IGF2BP3-deleted SEM cells (I3sg2). C. Aggregate lactate efflux rates from Seahorse XF Analysis in control (NT, NT2) versus IGF2BP3-deleted (I3sg2, I3sg5) in SEM, NALM6 and Lin-/MLL-Af4 murine cells. D. Pyruvate and Lactate amounts measured by GC-MS in control versus IGF2BP3-deleted (I3sg2) SEM cells E. Incorporation of carbon from 13C-labeled glucose into pyruvate and lactate, measured as mole percent enrichment (MPE) from GC-MS experiments. All data are n>3 biological replicates. *, p<0.05; **, p<0.01; ***, p<0.001.
Figure 2.
Figure 2.. IGF2BP3 supports one-carbon metabolism pathways that serve as methyl donors.
A. Heatmap depicting significantly altered metabolites from control versus IGF2BP3-deleted SEM cells, as indicated, using targeted analysis of polar central carbon metabolites by LC-MS. Shown are metabolites with a consistent change in both IGF2BP3-deleted lines. B. Schematic of metabolites that are produced in one-carbon metabolism. C-J. Intracellular abundance and steady-state incorporation of carbon from 13C-labeled glucose, measured as mole percent enrichment (MPE), into one-carbon pathway metabolites serine, glycine, S-adenosyl-methionine (SAM) and glutathione (GSH) in control versus IGF2BP3-deleted SEM cells. All data are n>3 biological replicates. *, p<0.05; **, p<0.01; ***, p<0.001.
Figure 3.
Figure 3.. IGF2BP3 regulates N6-methyladenosine marks in RNA.
A. Western blot analysis of histone methylation (H3K4me1 and H3K4me4) in SEM and Lin-MLL-Af4 cells, control or deficient for IGF2BP3. B. ELISA measurement of m6A modification on RNA isolated from SEM and Lin-MLL-Af4 cells as above. C. ELISA measurement of m6A modification on RNA isolated from NALM6 cells, control or deficient for IGF2BP3. D. Dot blot analysis of m6A modification (left) and methylene blue staining in SEM cells, control or deficient for IGF2BP3. E. RNA m6A methylase activity (colorimetric assay, expressed as enzymatic activity) in SEM cells, control or deficient for IGF2BP3. F. RNA m6A demethylase activity (colorimetric assay, expressed as enzymatic activity) in SEM cells, control or deficient for IGF2BP3. G. ELISA measurement of m6A modification on RNA isolated from control or IGF2BP3-deficient SEM and Lin-MLL-Af4 cells, following treatment with METTL3 inhibitor STM2457 at 5 μM concentration. H. Western blot analysis of RNA m6A-methylase and demethylase enzymes in SEM cells, control or deficient for IGF2BP3. I. Cell viability assays (Cell Titer Glo) on control versus IGF2BP3 deleted SEM (left) and Lin-MLL-Af4 cells (right) cells treated with STM2457. Cells were grown for 3 days in the presence of inhibitor prior to measurement of cell viability.
Figure 4.
Figure 4.. IGF2BP3 regulates translation of metabolic genes.
A. MetaboAnalyst-based pathway enrichment analysis of consistently differentially regulated metabolites in SEM cells with knockout of IGF2BP3. B. Volcano plot showing differentially expressed genes and IGF2BP3 targets defined by eCLIP analysis (dots exceeding the thresholds depicted by dashed lines), Putative IGF2BP3 targets which were differentially expressed are highlighted as transparent orange, IGF2BP3 metabolic targets which were identified using Skipper (see ref.) are highlighted in red, while metabolic targets that were not IGF2BP3 are in blue. Grey dots are not IGF2BP3 targets. Green dashed lines mark the significant cutoffs for diff. expression (−1/1) and sig pvalue (1). C. Genome browser snapshots of eCLIP read coverage across some putative IGF2BP3 target genes. Depicted are the genes with key roles in glycolysis and one-carbon metabolism and map to the enriched terms in (A). D. Western Blot analysis of key genes in metabolic pathways (left) and simplified schematic depiction of genes that control metabolic pathways altered in IGF2BP3-depleted cells. E. 10–45% Sucrose gradient fractionation of cytosolic extracts from control or IGF2BP3-depleted SEM cells. MAT2B mRNA distribution was measured by RT-qPCR.
Figure 5.
Figure 5.. IGF2BP3 loss of function impacts glycolytic metabolism and m6A RNA modifications in vivo.
A. ELISA Measurement of m6A modification from murine bone marrow isolated following transplantation with Lin-MLL-Af4 bone marrow (see ref.) B. Chemical structure of I3IN-002 C. IC50 based on cell viability, measured by CellTiterGlo, in SEM and Lin− cells, following treatment with I3IN-002. D. Seahorse XF Extracellular acidification rate (ECAR) kinetic trace in SEM cells treated with vehicle or I3IN-002, a small molecule inhibitor of IGF2BP3. E. Aggregate lactate efflux rates from Seahorse XF Analysis in SEM cells treated with vehicle of I3IN-002. F. ELISA measurement of m6A RNA modifications in SEM cells treated with vehicle, STM2457, or I3IN-002. G. ELISA measurement of m6A RNA modifications in splenic tumors isolated from mice transplanted with Lin-MLL-Af4 cells, subsequently treated in vivo with I3IN-002. H. ELISA measurement of m6A RNA modifications in splenic tumors isolated from mice transplanted with human PDX B-ALL cells, subsequently treated in vivo with I3IN-002.
Figure 6.
Figure 6.. Re-expression of IGF2BP3 recovers metabolism, cell growth and RNA m6A modifications.
A. MSCV-based construct showing bases altered to render it insensitive to sg2-mediated CRISPR/Cas9 activity (“codon-altered”, I3CA) B. Western blot analysis of enforced expression of IGF2BP3 in SEM cells that were previously deleted for IGF2BP3. NT/Ctrl, SEM cells sufficient for IGF2BP3, transduced with control vector; sg2/MIG, SEM cells deleted for IGF2BP3, transduced with control vector; sg2/I3CA, SEM cells deleted for IGF2BP3 then transduced with codon-altered IGF2BP3. Additionally, Western blot analysis for PKM2, MAT2A, MAT2B in SEM cells is shown. C. Western blot analysis of enforced expression of IGF2BP3 in Lin-/MLL-Af4 cells that were previously deleted for IGF2BP3. NT/Ctrl, cells sufficient for IGF2BP3, transduced with control vector; sg2/MIG, cells deleted for IGF2BP3, transduced with control vector; sg2/I3CA, cells deleted for IGF2BP3 then transduced with codon-altered IGF2BP3. Additionally, Western blot analysis for PKM2, MAT2A, MAT2B in SEM cells is shown. D. Cell growth curves measured by Cell Titer Glo, over three days in SEM cells, notated as in (B). E. Cell growth curves measured by Cell Titer Glo over three days in Lin-/MLL-Af4 cells, notated as in (C). F. ELISA measurement of m6A modification in RNA isolated from SEM cells notated as in (B). G. ELISA Measurement of m6A modification in RNA isolated from Lin-MLL-Af4 cells notated as in (E). H. Western blot analysis of Lin− cells from Igf2bp3del/del mice. Briefly, cells were isolated from mice with a germline deletion of Igf2bp3, transformed with MLL-Af4, and then subjected to transduction with MSCV-based constructs carrying the wild-type murine Igf2bp3. Proteins that were analyzed are: Igf2bp3, Myc, Mat2a, Mat2b and Actin. I. Cell growth, measured by Cell titer Glo, over 4 days, in Igf2bp3del/del Lin-MLL-Af4 cells with enforced IGF2BP3 expression as above. J. Seahorse XF Extracellular acidification rate (ECAR) kinetic trace in cells described above. K. Aggregate lactate efflux rates from Seahorse XF Analysis in cells described above. L. Colony formation assays from Lin-MLL-Af4 cells as described above. M. ELISA measurement of m6A modification on RNA isolated from Igf2bp3del/del Lin-MLL-Af4 cells with enforced IGF2BP3 expression as above.
Figure 7.
Figure 7.. IGF2BP3 promotes glycolytic metabolism and m6A RNA modifications in vivo.
A. Percentage engraftment of CD45.2 Lin− cells in bone marrow from Igf2bp3del/del mice transduced with MLL-Af4 re-expressing empty vector (Ctrl) or IGF2BP3 in the two groups at 6 weeks. B. Quantitation of bone marrow count in mice transplanted with MLL-Af4 re-expressing empty vector (Ctrl) or IGF2BP3 in the two groups at 6 weeks. C. Spleen weights of mice transplanted with MLL-Af4 re-expressing empty vector (Ctrl) or IGF2BP3 in the two groups at 6 weeks. D. Quantitation of spleen cell count in mice transplanted with MLL-Af4 re-expressing empty vector (Ctrl) or IGF2BP3 in the two groups at 6 weeks. E. Quantitation of bone marrow CD11b+ cell count in mice transplanted with MLL-Af4 re-expressing empty vector (Ctrl) or IGF2BP3 in the two groups at 6 weeks. F. Quantitation of bone marrow Lin− cell count along with representative FACS plots in mice transplanted with MLL-Af4 re-expressing empty vector (Ctrl) or IGF2BP3 in the two groups at 6 weeks. G. Quantitation of bone marrow CD11b+cKit+ cell count in mice transplanted with MLL-Af4 re-expressing empty vector (Ctrl) or IGF2BP3 in the two groups at 6 weeks. H. Quantitation of bone marrow LSK (Lin−cKit+Sca1−) cell count in mice transplanted with MLL-Af4 re-expressing empty vector (Ctrl) or IGF2BP3 in the two groups at 6 weeks. I. Quantitation of bone marrow CD11b+Sca1− (potential LIC; Tran et al.) cell count in mice transplanted with MLL-Af4 re-expressing empty vector (Ctrl) or IGF2BP3 in the two groups at 6 weeks. J. Seahorse XF Extracellular acidification rate (ECAR) kinetic trace for bone marrow cells isolated from the empty vector (Ctrl) or IGF2BP3 re-expression group at 6 weeks (n = 4, each group; for representation n = 2). K. Aggregate lactate efflux rates from Seahorse XF Analysis in cells described above. L. ELISA measurement of m6A RNA modifications in splenic tumors isolated from mice transplanted with MLL-Af4 re-expressing empty vector (Ctrl) or IGF2BP3 in the two groups at 6 weeks. All data are n = 2 biological replicates. *, p<0.05; **, p<0.01; ***, p<0.001.

References

    1. Desrosiers R., Friderici K., and Rottman F. (1974). Identification of methylated nucleosides in messenger RNA from Novikoff hepatoma cells. Proc Natl Acad Sci U S A 71, 3971–3975. 10.1073/pnas.71.10.3971. - DOI - PMC - PubMed
    1. Wang X., Zhao B.S., Roundtree I.A., Lu Z., Han D., Ma H., Weng X., Chen K., Shi H., and He C. (2015). N(6)-methyladenosine Modulates Messenger RNA Translation Efficiency. Cell 161, 1388–1399. 10.1016/j.cell.2015.05.014. - DOI - PMC - PubMed
    1. Wang Y., and Zhao J.C. (2016). Update: Mechanisms Underlying N(6)-Methyladenosine Modification of Eukaryotic mRNA. Trends Genet 32, 763–773. 10.1016/j.tig.2016.09.006. - DOI - PMC - PubMed
    1. Roundtree I.A., Evans M.E., Pan T., and He C. (2017). Dynamic RNA Modifications in Gene Expression Regulation. Cell 169, 1187–1200. 10.1016/j.cell.2017.05.045. - DOI - PMC - PubMed
    1. Meyer K.D., Saletore Y., Zumbo P., Elemento O., Mason C.E., and Jaffrey S.R. (2012). Comprehensive analysis of mRNA methylation reveals enrichment in 3’ UTRs and near stop codons. Cell 149, 1635–1646. 10.1016/j.cell.2012.05.003 S0092-8674(12)00536-3 [pii]. - DOI - PMC - PubMed

Publication types

LinkOut - more resources