[Preprint]. 2024 Oct 28:2024.10.27.620502.
doi: 10.1101/2024.10.27.620502.

Transcriptional profiles of murine oligodendrocyte precursor cells across the lifespan

Affiliations

Transcriptional profiles of murine oligodendrocyte precursor cells across the lifespan

Dongeun Heo et al. bioRxiv. .

Update in

Abstract

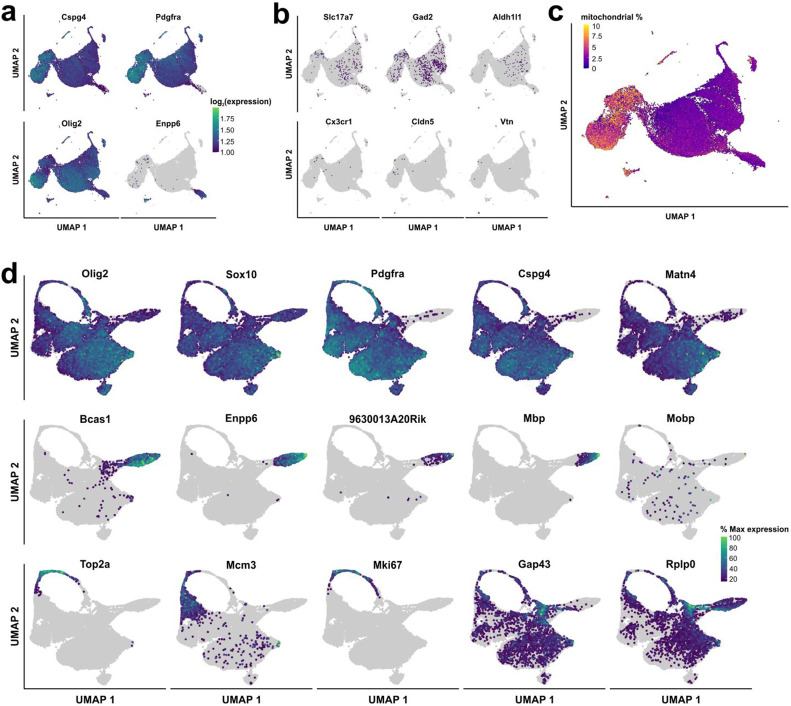
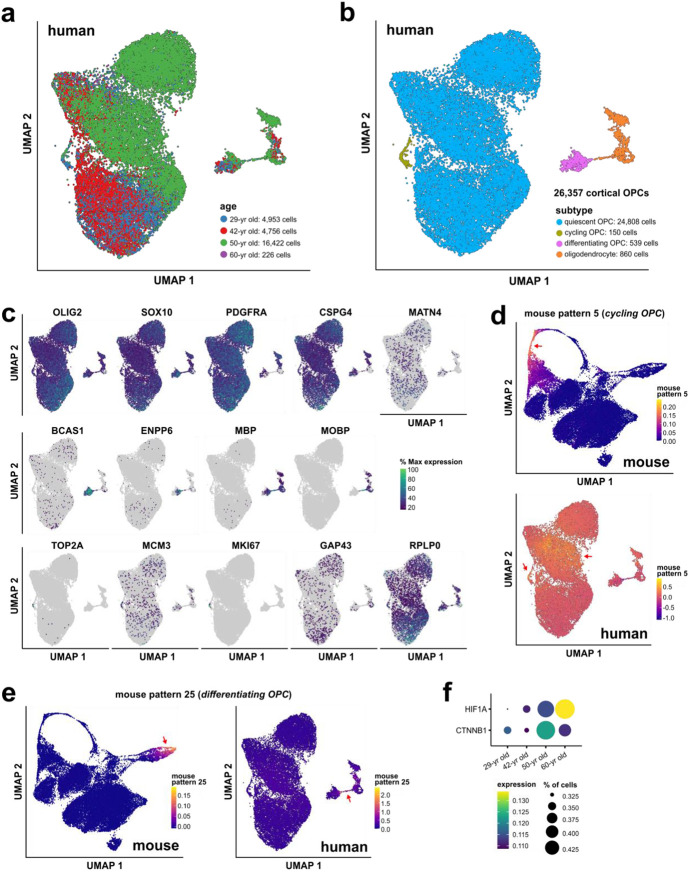
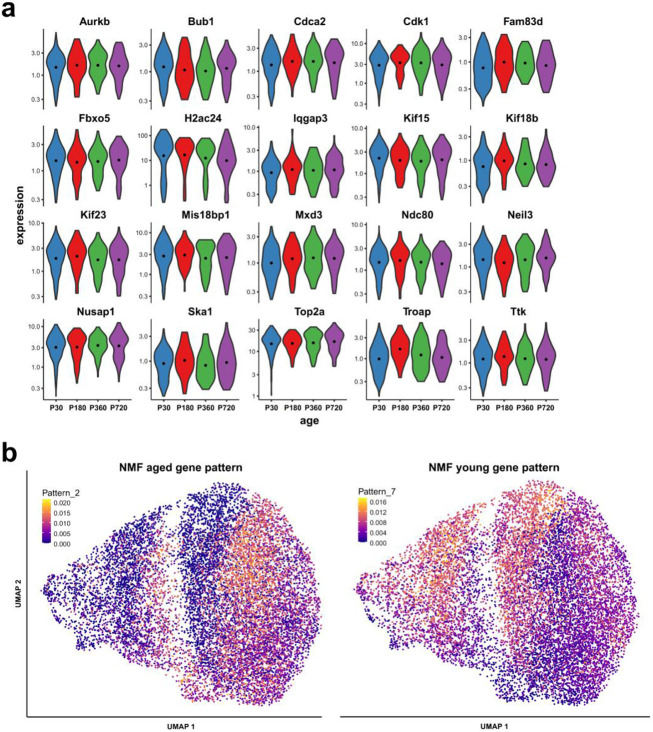
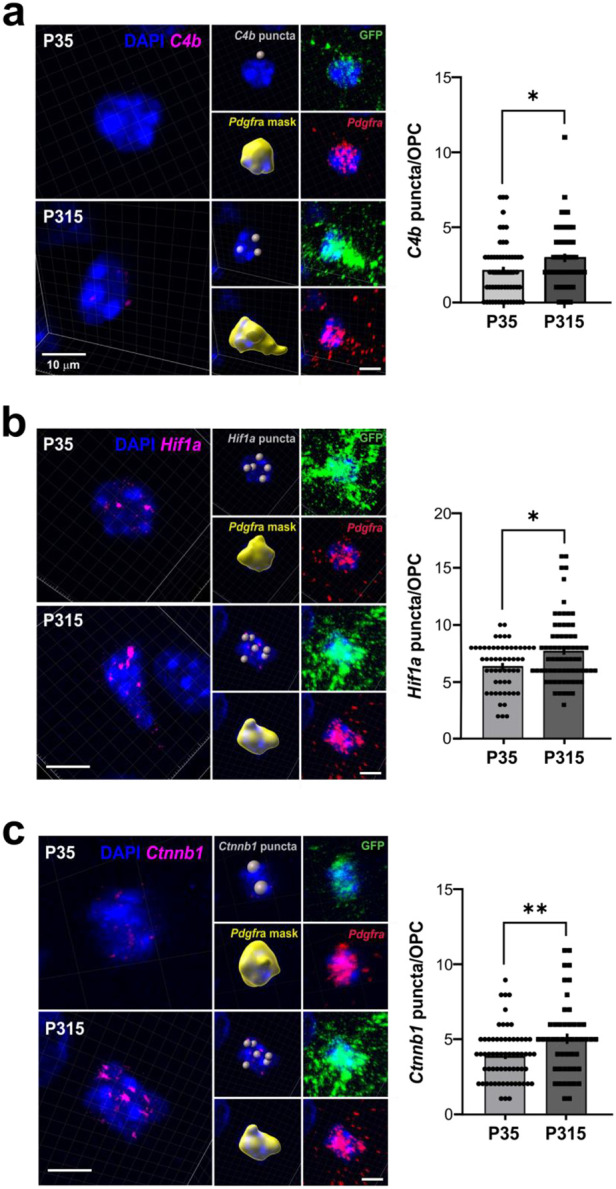
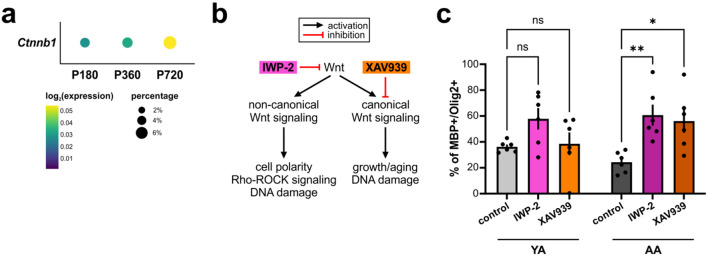
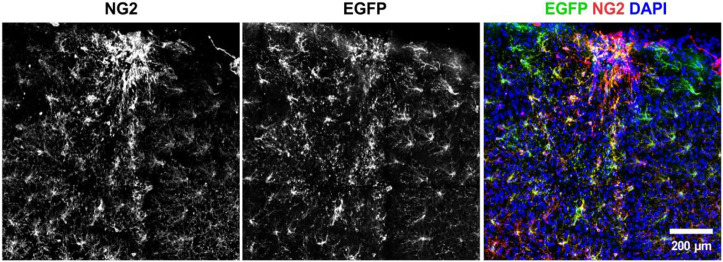
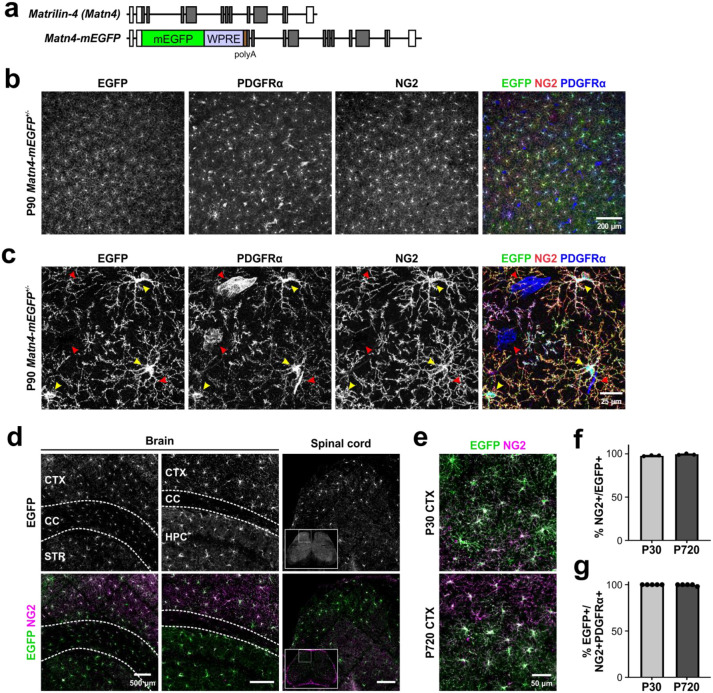
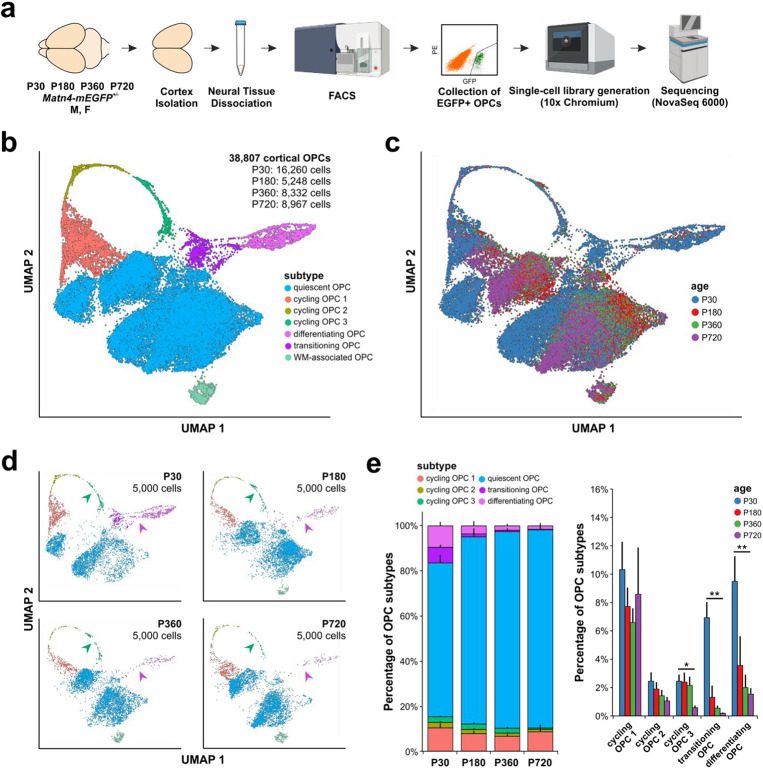
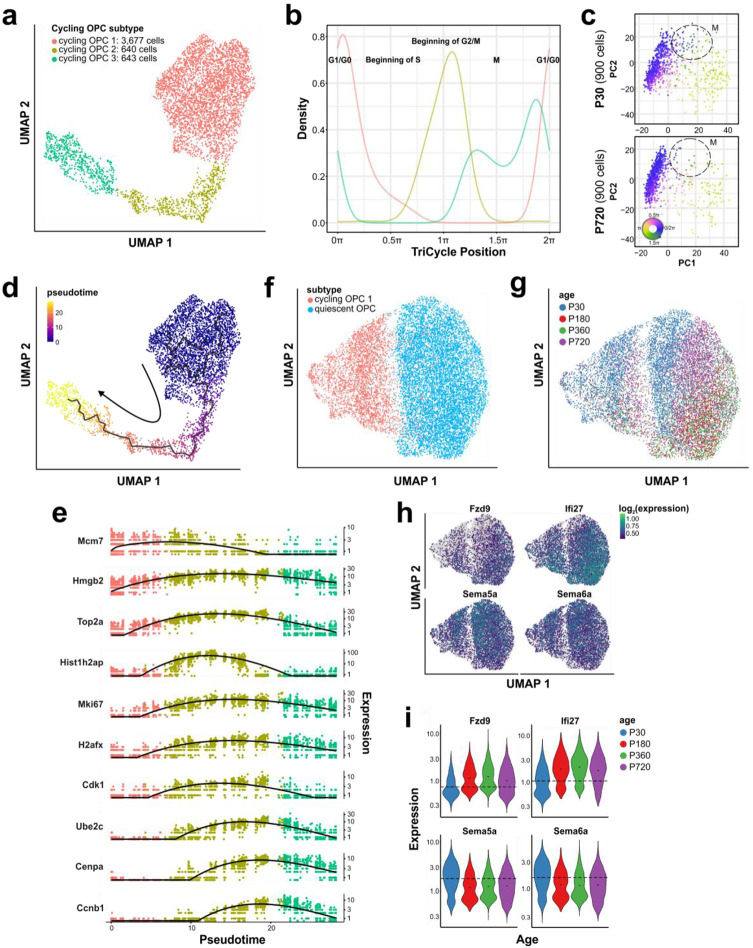
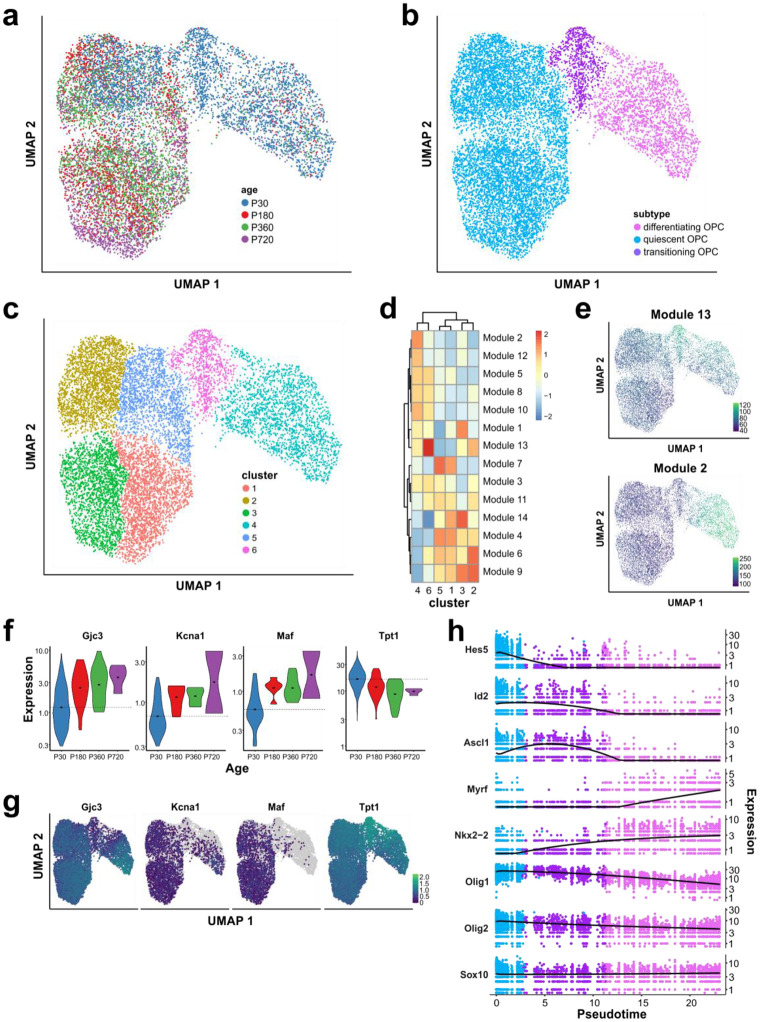
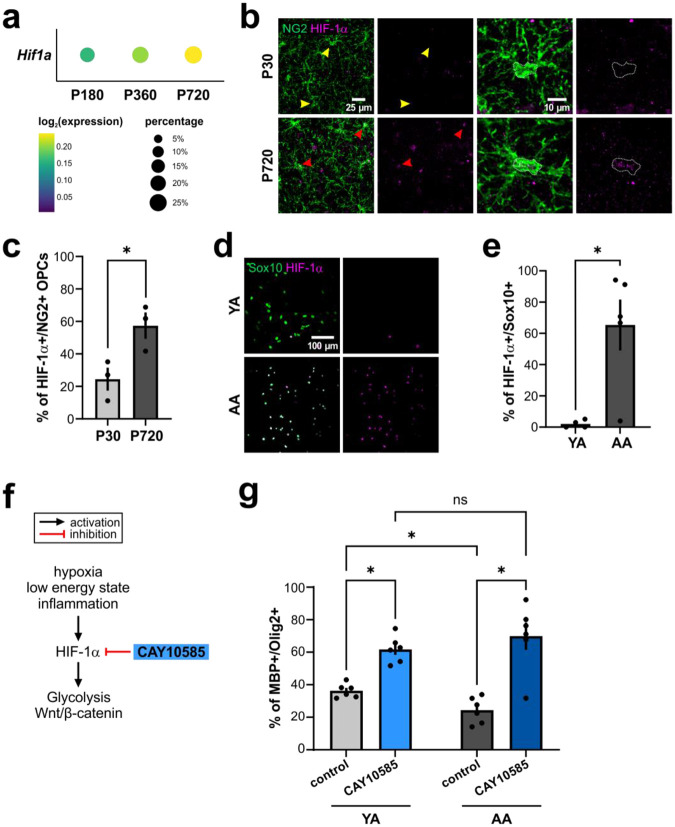
Oligodendrocyte progenitor cells (OPCs) are highly dynamic, widely distributed glial cells of the central nervous system (CNS) that are responsible for generating myelinating oligodendrocytes during development. By also generating new oligodendrocytes in the adult CNS, OPCs allow formation of new myelin sheaths in response to environmental and behavioral changes and play a crucial role in regenerating myelin following demyelination (remyelination). However, the rates of OPC proliferation and differentiation decline dramatically with aging, which may impair homeostasis, remyelination, and adaptive myelination during learning. To determine how aging influences OPCs, we generated a novel transgenic mouse line that expresses membrane-anchored EGFP under the endogenous promoter/enhancer of Matrilin-4 (Matn4-mEGFP) and performed high-throughput single-cell RNA sequencing, providing enhanced resolution of transcriptional changes during key transitions from quiescence to proliferation and differentiation across the lifespan. Comparative analysis of OPCs isolated from mice aged 30 to 720 days, revealed that aging induces distinct inflammatory transcriptomic changes in OPCs in different states, including enhanced activation of HIF-1α and Wnt pathways. Inhibition of these pathways in acutely isolated OPCs from aged animals restored their ability to differentiate, suggesting that this enhanced signaling may contribute to the decreased regenerative potential of OPCs with aging. This Matn4-mEGFP mouse line and single-cell mRNA datasets of cortical OPCs across ages help to define the molecular changes guiding their behavior in various physiological and pathological contexts.


Figures

Extended Data Figure 1 –
Extended Data Figure 1 –. Matn4-mEGFP expression is restricted to OPCs and a subset of neurons.
a. Matn4 expression is specific to OPCs and newly-formed oligodendrocytes (NFO) in 6-7 week-old mouse V1 cortex (reanalysis of a publicly available scRNA-seq dataset). b. Genotyping result of Matn4-mEGFP mouse line. Wildtype (wt) band size is 178 bp whereas the mutant, knock-in band size is 356 bp. c. EGFP signal in the optic nerve of Matn4-mEGFP mouse line is restricted to NG2+ PDGFRα+ OPCs. d. Matn4-mEGFP is also expressed by hippocampal granule cells and neurons in the somatosensory cortex barrel field and retrosplenial cortex. e. Matn4-mEGFP signal is absent from Iba1+ microglia and GFAP+ astrocytes. f. In vivo imaging of GFP+ cells in Matn4-mEGFP, NG2-mEGFP, and Pdgfra-CreER; RCE mouse lines. None of the vascular cells (red arrowheads) express EGFP in the cortex of Matn4-mEGFP mice.
Extended Data Figure 2 –
Extended Data Figure 2 –. Preprocessing of the OPC scRNA-seq dataset.
a. Expression of oligodendrocyte lineage cell genes in the uncleaned dataset. Most cells in the dataset express Cspg4, Pdgfra, and Olig2 (OPCs) or Enpp6 and Olig2 (differentiating OPCs). b. Only a small group of cells that were FACS isolated from Matn4-mEGFP mouse line express non-oligodendrocyte lineage cell genes. c. UMAP plot of uncleaned dataset colorized by the percentage of mitochondrial-related genes (cutoff at 10%). Those cells with relatively high mitochondrial gene ratio (> 5%) were removed for downstream analyses. d. Expression of classic oligodendrocyte lineage marker genes (oligodendrocyte lineage: Olig2, Sox10; OPC: Pdgfra, Cspg4, Matn4; differentiating OPC: Bcas1, Enpp6, 9630013A20Rik; oligodendrocyte: Mbp, Mobp) as well as the subtype marker genes identified in this study (Cycling OPC: Top2a, Mcm3, Mki67; Transitioning OPC: Gap43, Rplp0) in the cleaned, preprocessed, final dataset.
Extended Data Figure 3 –
Extended Data Figure 3 –. Fluorescent in situ hybridization (FISH) for Cycling and Differentiating OPC subtypes.
a. FISH for Top2a, Pdgfra, and Sox10 to identify Cycling OPC in situ in postnatal day 9 (P9) mouse brain. b. Comparison of the density of Cycling OPC in highly myelinated, somatosensory cortex (SS) and that in sparsely myelinated, temporal association cortex (TEA). c. Quantification of the density of Cycling OPC (Top2a+ Pdgfra+) in SS and TEA. d. FISH for LncOL1 to identify Differentiating OPC in situ in P74 mouse brain. e. Quantification of the frequency of LncOL1+ Differentiating OPC in SS and TEA.
Extended Data Figure 4 –
Extended Data Figure 4 –. Reanalysis of human OPCs in Siletti et al. (2023) dataset
a. UMAP plot of the dataset colorized by their four age groups (blue: 29-yr old, red: 42-yr old, green: 50-yr old, and purple: 60-yr old). b. UMAP plot of 26,357 human cortical OPCs colorized by their identified subtypes (quiescent OPC, cycling OPC, differentiating OPC, and oligodendrocytes). c. Expression of classic oligodendrocyte lineage marker genes (oligodendrocyte lineage: OLIG2, SOX10; OPC: PDGFRA, CSPG4, MATN4; differentiating OPC: BCAS1, ENPP6; oligodendrocyte: MBP, MOBP) as well as the subtype marker genes identified in this study (Cycling OPC: TOP2A, MCM3, MKI67; Transitioning OPC: GAP43, RPLP0) in the human cortical OPC dataset. d. UMAP plots of mouse Cycling OPC gene pattern 5 projected on the mouse scRNA-seq dataset and on the human snRNA-seq dataset. e. UMAP plots of mouse Differentiating OPC gene pattern 25 projected on the mouse scRNA-seq dataset and on the human snRNA-seq dataset. f. Dot plot of HIF1A and CTNNB1 expression in quiescent OPCs in the human cortex across aging.
Extended Data Figure 5 –
Extended Data Figure 5 –. Expression changes in individual cycling genes and groups of genes in Cycling OPC 1 and directly anteceding Quiescent OPC.
a. Expression levels of known cycling genes enriched in cycling OPCs are comparable in Cycling OPC 1 throughout aging. b. NMF gene patterns that are associated with either aged (P180-720) or young (P30) OPCs.
Extended Data Figure 6 –
Extended Data Figure 6 –. OPCs upregulate C4b, Hif1a, and Ctnnb1 mRNA with aging.
a. FISH with immunofluorescence staining (IF) for Pdgfra and C4b in P35 and P315 Matn4-mEGFP mouse cortex. OPC cell body masks were created based on EGFP fluorescence and Pdgfra FISH signal and used to quantify C4b transcript puncta/OPC (one-way ANOVA, * p-value < 0.05). b. FISH with IF staining for Pdgfra and Hif1a in the P35 and P315 Matn4-mEGFP mouse cortex. Hif1a transcript puncta/OPC was quantified as described above (one-way ANOVA, * p-value < 0.05). c. FISH with IF staining for Pdgfra and Ctnnb1 in the P35 and P315 Matn4-mEGFP mouse cortex (one-way ANOVA, ** p-value < 0.01).
Extended Data Figure 7 –
Extended Data Figure 7 –. Wnt signaling pathway is activated in aged OPCs and may contribute to their decreased differentiation potential.
a. Dot plot of Ctnnb1 expression in Quiescent OPC from P180, P360, and P720 timepoints. b. Schematic of how two different Wnt inhibitors (IWP-2 and XAV939) differentially block Wnt signaling pathway. IWP-2 globally inhibits the Wnt pathway whereas XAV939 preferentially inhibits the canonical Wnt signaling pathway. Both non-canonical and canonical Wnt signaling pathways have been shown to regulate DNA damage response. c. Quantification of MBP+ differentiating OPC/Olig2+ oligodendrocyte proportions with and without Wnt inhibitor treatments in OPCs isolated from YA or AA (two-way ANOVA with Tukey’s multiple comparisons test, * p-value < 0.05, ** p-value < 0.01).
Extended Data Figure 8 –
Extended Data Figure 8 –. Matn4-mEGFP signal is restricted to OPCs even after a stab wound injury.
IHC against NG2 (red) and EGFP (green) was performed on the Matn4-mEGFP mouse following a stab wound injury to demonstrate the utility of the mouse line in studying OPC dynamics following injury and inflammation.
Figure 1 –
Figure 1 –. Generation of an oligodendrocyte precursor cell (OPC) reporter mouse line: Matn4-mEGFP.
a. Schematics of Matn4-mEGFP mouse line where membrane anchored EGFP (mEGFP), WPRE, and polyA sequences were knocked into the first coding exon of Matn4. b. Confocal images of flattened Matn4-mEGFP mouse cortex co-immunostained for NG2 and PDGFRα. c. Higher magnification confocal images show the specificity of EGFP expression by NG2+ PDGFRα+ OPCs (yellow arrowheads), but not PDGFRα+ perivascular fibrocytes (red arrowheads). d. EGFP+ OPCs in Matn4-mEGFP mice also express NG2 in the corpus callosum (CC), striatum (STR), hippocampus (HPC), and spinal cord. e. The specificity of labeling OPCs does not change with aging in the cortex (CTX). f. Quantification of labeling specificity in Matn4-mEGFP mice, illustrating the percentage of EGFP+ cells that are also NG2+ in the cortex at P30 and P720. g. Quantification of labeling efficiency, illustrating the percentage of NG2+ PDGFRα+ OPCs expressing EGFP in the cortex at P30 and P720.
Figure 2 –
Figure 2 –. Single cell RNA-seq analysis of mouse cortical OPCs across the lifespan.
a. Workflow for generating the 10x Chromium single cell RNA-seq dataset from P30, P180, P360, and P720 mouse cortical OPCs acutely isolated from Matn4-mEGFP mice (illustrations created in BioRender: https://BioRender.com/z82n750). b. UMAP plot of 38,807 mouse cortical OPCs from four timepoints, colorized by their identified subtypes (Quiescent OPC, Cycling OPC 1, Cycling OPC 2, Cycling OPC 3, Differentiating OPC, Transitioning OPC, and WM-associated OPC). c. UMAP plot of the dataset colorized by their four age groups (blue: P30, red: P180, green: P360, and purple: P720). d. Separate UMAP plots for different age groups colorized by their subtypes. 5,000 cells from each age group were randomly selected and plotted. The arrowheads denote cycling OPC 3 (green) and transitioning/differentiating OPC (pink) subtypes. e. Proportions of each OPC subtype across four age groups show that the quiescent OPC subtype increases in proportion due to a statistically significant reduction in the proportions of cycling OPC 2, cycling OPC 3, transitioning OPC, and differentiating OPC subtypes with aging (simple linear regression, n=6, 4, 5, 5, * p-value < 0.05, ** p-value < 0.01).
Figure 3 –
Figure 3 –. Different cycling OPC subtypes represent different stages of the cell cycle.
a. UMAP plot of cycling OPCs (n=4,960) colorized by three different cycling OPC subtypes. b. TriCycle analysis shows that different cycling OPC subtypes correspond to different cell cycle stages (G1/G0: 0π/2π, S: 0.5π, G2/M: 1π, M: 1.5π). c. P720, aged group shows a dramatic loss of those cycling OPCs that are predicted to be undergoing mitosis (M-phase) (manually encircled for visualization). d. UMAP plot of cycling OPCs colorized by pseudotime originating from Cycling OPC 1 (G1/G0-phase). e. Expression of different cell-cycle related genes in cycling OPCs across the pseudotime, colorized by their subtypes (Cycling OPC 1, Cycling OPC 2, and Cycling OPC 3). f. UMAP plot of Cycling OPC 1 (G1/G0-phase) and immediately anteceding quiescent OPCs colorized by their subtypes. g. f colorized by different age groups (P30, P180, P360, and P720). h. UMAP plots of the top four genes (Fzd9, Ifi27, Sema5a, and Sema6a) differentially expressed across aging in quiescent OPCs that directly antecede cycling OPCs. i. Expression violin plots of the top four genes in h across the four different age groups. Fzd9 and Ifi27 are statistically significantly upregulated with aging whereas Sema5a and Sema6a are significantly downregulated (monocle3 linear regression, q-value < 0.001).
Figure 4 –
Figure 4 –. Identification of a novel transitioning OPC population poised to undergo differentiation.
a. UMAP plot of differentiating OPCs and quiescent OPCs that immediately antecede the differentiating population, colorized by age groups. b. A colorized by different OPC subtypes (Differentiating OPC, Quiescent OPC, and Transitioning OPC). c. A colorized by different clusters (1-6) where cluster 6 represents the transitioning OPC subtype. d. Identification of different modules that represent groups of genes that are co-regulated in different clusters. e. UMAP plots of module 13 and module 2 that represent Transitioning OPC and Differentiating OPC groups, respectively. f. Expression violin plots of the top four genes (Gjc3, Kcna1, Maf, and Tpt1) differentially expressed across aging in Transitioning OPC (monocle3 linear regression, q-value < 0.001). g. UMAP plots of the top four genes in g across the four different age groups. The three genes that are downregulated in Transitioning OPC (Gjc3, Kcna1, and Maf) are upregulated with aging whereas Tpt1, which is upregulated in Transitioning OPC is downregulated with aging. h. Expression of different oligodendrocyte-related transcription factors across the pseudotime originating from Quiescent OPC subtype.
Figure 5 –
Figure 5 –. Quiescent OPCs undergo aging-associated transcriptional changes.
a. UMAP plot of Quiescent OPC subtype, colorized by age groups. b. Separate UMAP plots for different age groups to show the separation of young, P30 quiescent OPCs from aged quiescent OPCs from P180, P360, and P720. 4,000 cells from each age group were randomly selected and plotted. c. Identification of an aged gene pattern that is associated with aged quiescent OPCs using Nonnegative Matrix Factorization (NMF). d. UMAP plot of C4b gene expression that shows the enrichment of expression in aged quiescent OPCs. e. UMAP of quiescent OPCs from P180-P720 brains. f. Examples of significantly differentially expressed genes with aging plotted in a dot plot where the relative percentage of cells is represented by the size of circles and relative expression is represented by color. g. Ingenuity Pathway Analysis (IPA) of statistically significantly differentially expressed genes in quiescent OPCs with aging shows that immune-pathways are predicted to be activated (orange) whereas cell growth pathways are predicted to be inactivated (blue).
Figure 6 –
Figure 6 –. HIF-1α pathway is activated in aged OPCs, which functionally inhibits their differentiation.
a. Dot plot of Hif1a expression in Quiescent OPC from P180, P360, and P720 timepoints. b. Immunofluorescence (IF) of HIF-1α (magenta) and NG2 (green) in P30 and P720 cortices. Yellow arrowheads indicate P30 NG2+ OPCs that lack HIF-1α immunoreactivity and red arrowheads indicate P720 NG2+ OPCs that show HIF-1α immunoreactivity. c. Quantification of the percentage of HIF-1α+ OPCs in young (P30) vs aged (P720) cortex (Student’s t-test, * p-value < 0.05). d. IF staining for HIF-1α (magenta) and Sox10 (green) in mouse OPC primary cultures. YA: young adult, AA: aged adult. e. Quantification of HIF-1α+ Sox10+ cells (Wilcoxon rank sum test, * p-value < 0.05). f. Schematic of CAY10585 drug impinging on the HIF-1α pathway. Hypoxia, low energy, and inflammation have been shown to activate HIF-1α signaling. At downstream, HIF-1α is involved in upregulating glycolysis and Wnt signaling. g. Quantification of MBP+ differentiating OPC/Olig2+ oligodendrocyte proportions with and without CAY10585 treatment in OPCs isolated from YA or AA (Wilcoxon rank sum test with the Holm-Šídák multiple comparisons test, * p-value < 0.05).

References

    1. Salas A. et al. JAK-STAT pathway targeting for the treatment of inflammatory bowel disease. Nat Rev Gastroenterol Hepatol 17, 323–337 (2020). - PubMed
    1. Clarke L. E. et al. Normal aging induces A1-like astrocyte reactivity. Proc Natl Acad Sci U S A 115, E1896–E1905 (2018). - PMC - PubMed
    1. Hammond T. R. et al. Single-Cell RNA Sequencing of Microglia throughout the Mouse Lifespan and in the Injured Brain Reveals Complex Cell-State Changes. Immunity 50, 253–271.e6 (2019). - PMC - PubMed
    1. Guttenplan K. A. et al. Neurotoxic reactive astrocytes induce cell death via saturated lipids. Nature 2021 599:7883 599, 102–107 (2021). - PubMed
    1. Young K. M. et al. Oligodendrocyte dynamics in the healthy adult CNS: evidence for myelin remodeling. Neuron 77, 873–885 (2013). - PMC - PubMed

Publication types

LinkOut - more resources