[Preprint]. 2024 Nov 1:2024.11.01.621612.
doi: 10.1101/2024.11.01.621612.

Multi-modal characterization of rodent tooth development

Affiliations

Multi-modal characterization of rodent tooth development

Yuchen Jiang et al. bioRxiv. .

Abstract

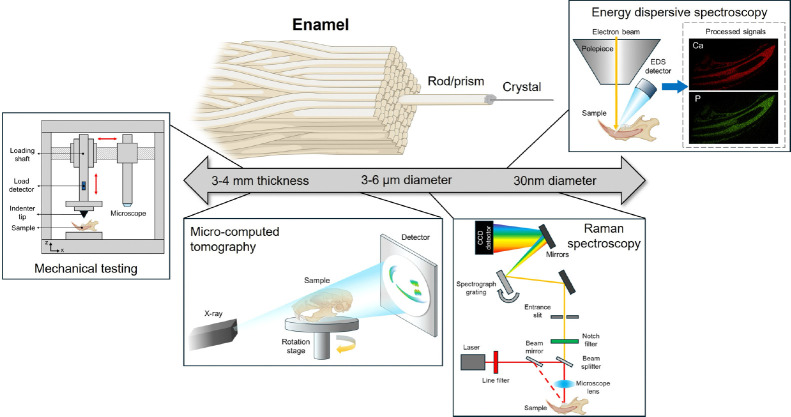
Craniofacial tissues undergo hard tissue development through mineralization and changes in physicochemical properties. This study investigates the mechanical and chemical properties of developing enamel, dentin, and bone in the mouse mandible. We employ a multi-modal, multi-scale analysis of the developing incisor and first molar at postnatal day 12 by integrating micro-computed tomography (microCT), nanoindentation (NI), energy dispersive spectroscopy (EDS), and Raman spectroscopy. Our findings demonstrate distinct patterns of mechanical, elemental, and chemical changes across mineralized tissues. These results suggest that mineral composition drives mechanical properties across different craniofacial hard tissues. Integrating multi-modal characterization of mineralized tissues opens new opportunities for investigating structure-function relationships in craniofacial biology and genetics.

Keywords: dental development; materials characterization; mineralized tissues; multi-modal.


Conflict of interest statement

Competing Interest Statement: No competing interests to disclose. No competing interests to disclose.

Figures

Figure 1.
Figure 1.
Outline of the multimodal methodologies used in this study across varying length scales. Here, enamel is used as the primary example due to its layered crystalline organization.
Figure 2.
Figure 2.
Micro-computed tomography (microCT) shows a 3-dimensional reconstruction of mineralizing dentition. (A) Mineralization heat map of the maxillary and mandibular incisors and molars showing the highest levels of mineralization as measured by greyscale concentrated at the molar cusp tips and incisor tips. (B) A 2-dimensional section through the sagittal plane of the mandible reveals a staged development of the ever-growing incisor and a first molar just prior to eruption from the alveolar bone. Labeled hashed lines (a-d) represent the cross-sectional views (below) at various stages of growth along the developing incisor, landmarked for pre-secretory stage (a), secretory (b), transition (c), and maturation (d) stages of enamel formation. Scale bars, 1mm.
Figure 3.
Figure 3.
Nanoindentation and elemental analysis of rodent tooth development. (A) SEM image of a rodent incisor cross-section. Red marks indicate measurement regions, and the green marker highlights the alveolar bone near the first molar. Insets show six nanoindentation sites (dashed triangles) on enamel (EM) and dentin (DT) and an EDS line scan (yellow line) across the enamel-dentin junction. (B) Hardness of enamel in incisor and molar at different developmental stages, showing a notable increase during tooth development. (C) EDS results for elemental composition (Ca, P, Fe, Mg) in enamel during mineralization in both incisor and molar. (D) Hardness of dentin at different stages and of alveolar bone, showing similar values between the cervical crown and alveolar bone. (E) Elemental trends in dentin show stable Ca, P, and Fe, with Mg influencing hardness during both dentin and alveolar bone mineralization.
Figure 4.
Figure 4.
Raman spectra of (A) enamel and (B) dentin show varying levels of elemental compositions along incisor and molar mineralization. (C) The spectral region of the ν2, ν4 phosphate group, and (D) the spectral region of the ν1 phosphate and the ν1 b-type carbonate groups in enamel. (E) The carbonate-to-phosphate ratio (C/P) is represented as the ratio of the area under the 1070 cm−1 peak to the area under the 960 cm−1 peak.
Figure 5.
Figure 5.
Principal component analysis (PCA) and multiple linear regression (MLR) integration models for enamel and dentin. (A) PCA biplot of enamel spectra illustrating sample clustering based on developmental stages, reflecting variations in elemental composition along the incisor and molar. (B) PCA scores show distinct clusters of enamel and dentin corresponding to different stages of mineralization along the incisor. (C) MLR model predicts hardness based on the input variables for (C) enamel and (D) dentin.

Similar articles

References

    1. Cuny G, Guinot G, & Enault S (2017) Mineralized Tissues. Evolution of Dental Tissues and Paleobiology in Selachians), pp 1–18.
    1. Giacaman RA, Perez VA, & Carrera CA (2016) Mineralization processes in hard tissues. Biomineralization and Biomaterials), pp 147–185.
    1. Murshed M (2018) Mechanism of Bone Mineralization. Cold Spring Harb Perspect Med 8(12). - PMC - PubMed
    1. Hu JC & Simmer JP (2007) Developmental biology and genetics of dental malformations. Orthod Craniofac Res 10(2):45–52. - PubMed
    1. Kazuhiko Kawasaki TS, and Kenneth M. Weiss (2004) Genetic basis for the evolution of vertebrate mineralized tissue. PNAS 101(31):11356–11361. - PMC - PubMed

Publication types

LinkOut - more resources