[Preprint]. 2024 Oct 31:2024.10.29.620654.
doi: 10.1101/2024.10.29.620654.

GENCODE: massively expanding the lncRNA catalog through capture long-read RNA sequencing

Affiliations

GENCODE: massively expanding the lncRNA catalog through capture long-read RNA sequencing

Gazaldeep Kaur et al. bioRxiv. .

Abstract

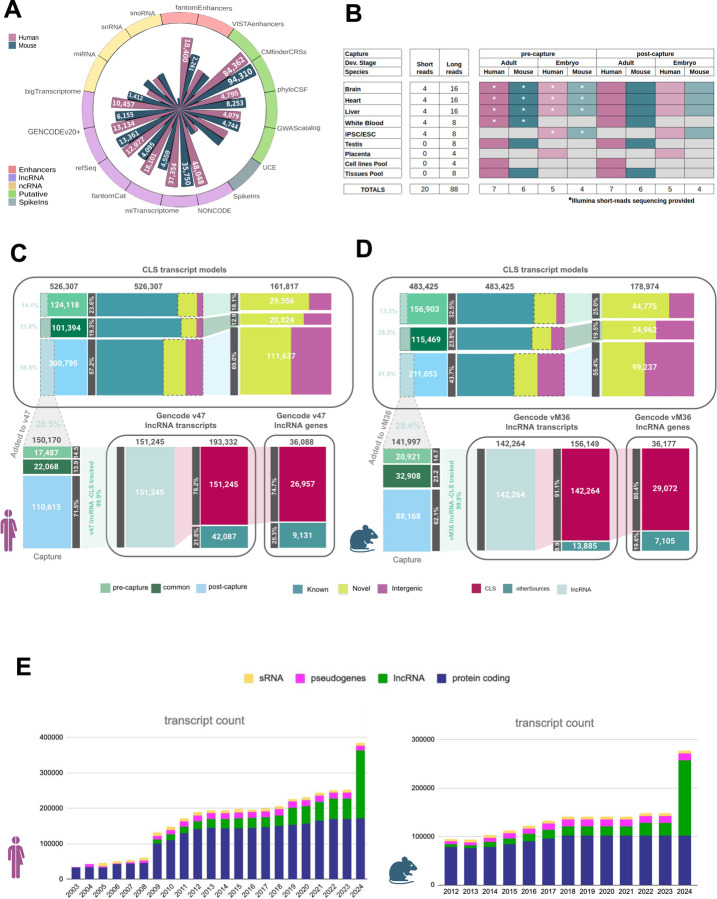
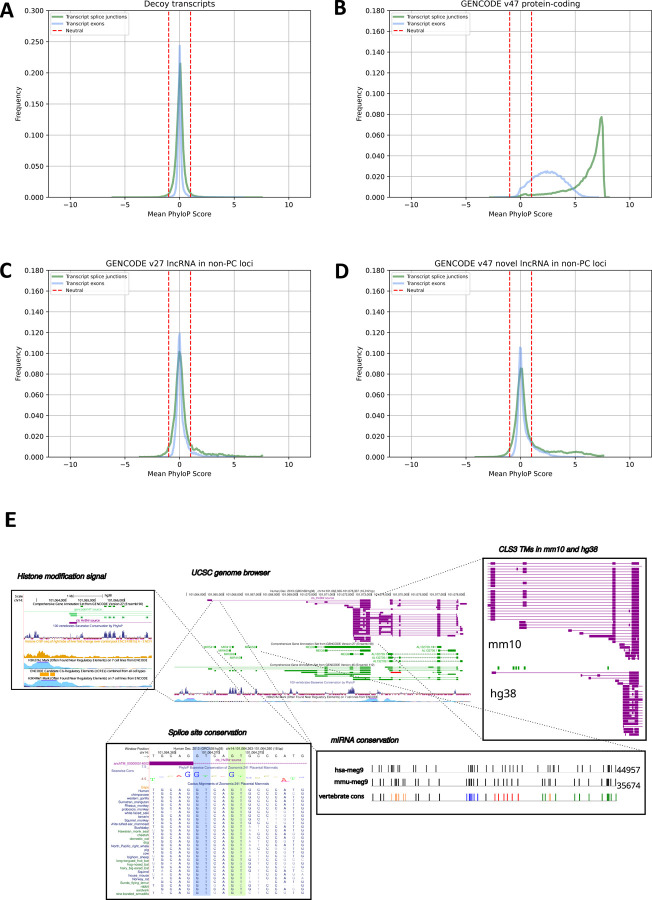
Accurate and complete gene annotations are indispensable for understanding how genome sequences encode biological functions. For twenty years, the GENCODE consortium has developed reference annotations for the human and mouse genomes, becoming a foundation for biomedical and genomics communities worldwide. Nevertheless, collections of important yet poorly-understood gene classes like long non-coding RNAs (lncRNAs) remain incomplete and scattered across multiple, uncoordinated catalogs, slowing down progress in the field. To address these issues, GENCODE has undertaken the most comprehensive lncRNAs annotation effort to date. This is founded on the manual annotation of full-length targeted long-read sequencing, on matched embryonic and adult tissues, of orthologous regions in human and mouse. Altogether 17,931 novel human genes (140,268 novel transcripts) and 22,784 novel mouse genes (136,169 novel transcripts) have been added to the GENCODE catalog representing a 2-fold and 6-fold increase in transcripts, respectively - the greatest increase since the sequencing of the human genome. Novel gene annotations display evolutionary constraints, have well-formed promoter regions, and link to phenotype-associated genetic variants. They greatly enhance the functional interpretability of the human genome, as they help explain millions of previously-mapped "orphan" omics measurements corresponding to transcription start sites, chromatin modifications and transcription factor binding sites. Crucially, our targeted design assigned human-mouse orthologs at a rate beyond previous studies, tripling the number of human disease-associated lncRNAs with mouse orthologs. The expanded and enhanced GENCODE lncRNA annotations mark a critical step towards deciphering the human and mouse genomes.


Conflict of interest statement

Competing Interests The authors declare no competing interests.

Figures

FIGURE 1.
FIGURE 1.. Targeting and sequencing the long non-coding transcriptome with CapTrap-CLS.
A) Representation of the capture panel; each bar reports the number of targeted regions per catalog, for the human and mouse experiments, organized by the class of elements in focus. B) Application of CapTrap-CLS in matched adult and embryonic tissues from human and mouse. Samples were sequenced using long-read platforms from PacBio and Oxford Nanopore Technologies (ONT). Short reads were sequenced with Illumina and highlighted by an asterisk when available. An outline of CLS transcripts and their integration to GENCODE is shown for C) human and D) mouse. Top panel: final set of CLS transcripts categorized based on the novelty status with respect to GENCODE v27 (human) and vM16 (mouse). Bottom panel: CLS transcript models added to GENCODE v47 (human) and vM36 (mouse) See Figure S6 for a more detailed description E) Representation of GENCODE annotation history to releases v47 and vM36 Number of transcripts on primary assembly chromosomes in every year’s last GENCODE release, in human (left) and mouse (right), broken down by broad biotype. IG/TR genes excluded.
FIGURE 2.
FIGURE 2.. Classification of CLS Transcripts.
The panels shows the origin of CLS transcripts in A) human and B) mouse. The barplot on the left shows the models yield (from top to bottom) pre-capture, post-capture, as well as from adult and embryonic samples (percentage computed over the totality of the transcripts generated). The upset plot shows the intersections across these categories; the dots are colored according to the developmental stage of origin (whether adult, embryo or detected in both), while the bars display the overlap of transcripts between pre-capture and post-capture experiments. The barplot above highlights the proportion of shared transcripts across tissues.
FIGURE 3.
FIGURE 3.. Expansion of the GENCODE lncRNA annotation compared to other lncRNA catalogs.
A) Gene-level overlap between annotations. The values correspond to the percentage of gene loci from the catalogs represented in the x-axis that overlap the annotations represented in the box-plot. For instance, 29% of the lncRNAs in the merge of all catalogs (lncRNA-merge) are included in GENCODE v47. Conversely, 74% of the lncRNAs in v47 are included in lncRNA-merge. Overlap is defined as a complete overlap of the gene span within either the x-axis set or the corresponding set on the same strand. Both spliced and unspliced genes are included in this analysis. See also Figure S17B. B) Comparison of lncRNA catalogs as described in previous study. x-axis: “Comprehensiveness”, representing the total number of gene loci; y-axis: “Support”, indicating the percentage of transcript structures whose start is supported by a FANTOM (Functional Annotation of the Mammalian Genome) CAGE (cap analysis of gene expression) cluster within ±50 bases, and whose end includes a canonical polyadenylation motif within 10–50 bp upstream. Circle diameters show “exhaustiveness”, or the average number of transcripts per gene. Pie charts show the proportion of transcripts with all splice junctions supported by recount3 data (with at least 50 reads). Only spliced models were included in this analysis. CLS transcripts here refer to transcripts identified using CapTrap-CLS, which are spliced, located on the reference chromosomes, and derived from individual lncRNA catalogs. C) The overlap between syntenic lncRNA orthologues in human and mouse genomes and the clinically relevant lncRNA genes from three different sources.
FIGURE 4.
FIGURE 4.. Enhancing the functional interpretability of the human genome.
The figure shows how the incorporation of CLS data greatly enhances the functional interpretability of omics measurements on the human genome, assessed on i) novel CLS transcripts, ii) annotated lncRNA as of GENCODE v27, iii) annotated protein-coding genes as of GENCODE v27, and iv) decoy models to simulate background signal (from left to right). A) Transcription Start Site (TSS) support for novel CLS, annotated lncRNAs, protein-coding and decoy models. Barplots depict the proportion of supported TSSs within each set using CAGE clusters, proCapNet predictions and either CAGE or proCapNet. B) Barplot showing the proportion (%, y axis) of Transcription Start Sites (TSSs) supported by different types of cCREs (x axis). TSSs with cCRE support are those for which the distance between the TSS and the center of the cCRE is less than 2 Kb. We performed this analysis for unique TSSs of protein-coding genes, previously annotated lncRNAs, novel CLS transcript models (TM), and decoy models. The type of cCRE is color-coded; “any class” includes additional types of cCREs not shown in the barplot (CA-CTCF, CA-TF, CA, TF). C) Alluvial diagram showing the re-classification of TSS-proximity-dependent cCRE categories in the ENCODE registry, given the novel TSS models in the expanded annotation. Two pairs of categories are shown i) PLS versus H3K4me3 marking in accessible regions (CA-H3K4me3), and ii) pELS versus dELS, which share the same histone marking signatures, but relying on different proximities to closest TSS (200 bp and 2 kb, respectively). The percentages indicate the proportion of cCREs from the entire registry that belong to each category in the original classification (on the left) and upon enhancement with novel TSSs (right). D) Peaks of transcription factor binding are centered on TSS of known and CLS transcripts. The plot shows the average (across 1,800 TFs) coverage by ChIP-Atlas peaks of each consecutive 500 bp window around TSS. The coverage increases while we approach the TSS of the real transcripts which is not true for decoys. E) GWAS density profile along the gene body and the surrounding ± 15kb area.
FIGURE 5.
FIGURE 5.. Conservation of lncRNAs and hosting of small RNAs.
Frequency of per-transcript exon and splice junction mean PhyloP scores as computed for A) GENCODE v47 CLS-based novel lncRNAs outside of protein-coding loci, B) GENCODE v27 lncRNAs outside of protein-coding loci C) GENCODE v47 protein-coding transcripts, D) decoy models. The dashed red lines indicate the range considered under neutral selection. E) Example of a putative novel miRNA host gene. The MEG9 locus is a complex ncRNA locus on chr14. MEG9 is highly conserved between mouse and human, with additional exons found in mouse. The microRNA mir-541 cluster and the other miRNAs upstream are present throughout mammals. Given that splicing of the intron is required for miRNA maturation, we find the splice site of the 5’-most exon of the novel lncRNA to be highly conserved across deep mammalian genome alignments (214-way, 470-way). The novel transcript is expressed in liver only, as supported by histone modification marks for H3K27ac.

References

    1. Venter J. C. et al. The sequence of the human genome. Science 291, 1304–1351 (2001). - PubMed
    1. Lander E. S. et al. Initial sequencing and analysis of the human genome. Nature 409, 860–921 (2001). - PubMed
    1. The ENCODE Project Consortium. Identification and analysis of functional elements in 1% of the human genome by the ENCODE pilot project. Nature 447, 799–816 (2007). - PMC - PubMed
    1. Harrow J. et al. GENCODE: producing a reference annotation for ENCODE. Genome Biol. 7, S4 (2006). - PMC - PubMed
    1. Harrow J. et al. GENCODE: the reference human genome annotation for The ENCODE Project. Genome Res. 22, 1760–74 (2012). - PMC - PubMed

Publication types