

This is a preprint.
Reduced Liver Mitochondrial Energy Metabolism Impairs Food Intake Regulation Following Gastric Preloads and Fasting
- PMID: 39554188
- PMCID: PMC11565831
- DOI: 10.1101/2024.10.24.620086
Reduced Liver Mitochondrial Energy Metabolism Impairs Food Intake Regulation Following Gastric Preloads and Fasting
Update in
-
Reduced liver mitochondrial energy metabolism impairs food intake regulation following gastric preloads and fasting.Mol Metab. 2025 Jul;97:102167. doi: 10.1016/j.molmet.2025.102167. Epub 2025 May 12. Mol Metab. 2025. PMID: 40368160 Free PMC article.
Abstract
Objective: The capacity of the liver to serve as a peripheral sensor in the regulation of food intake has been debated for over half a century. The anatomical position and physiological roles of the liver suggest it is a prime candidate to serve as an interoceptive sensor of peripheral tissue and systemic energy state. Importantly, maintenance of liver ATP levels and within-meal food intake inhibition is impaired in human subjects with obesity and obese pre-clinical models. Previously, we have shown decreased hepatic mitochondrial energy metabolism (i.e., oxidative metabolism & ADP-dependent respiration) in male liver-specific, heterozygous PGC1a mice results in increased short-term diet-induced weight gain with increased within meal food intake. Herein, we tested the hypothesis that decreased liver mitochondrial energy metabolism impairs meal termination following nutrient oral pre-loads.
Methods: Liver mitochondrial respiratory response to changes in ΔGATP and adenine nucleotide concentration following fasting were examined in male liver-specific, heterozygous PGC1a mice. Further, food intake and feeding behavior during basal conditions, following nutrient oral pre-loads, and following fasting were investigated.
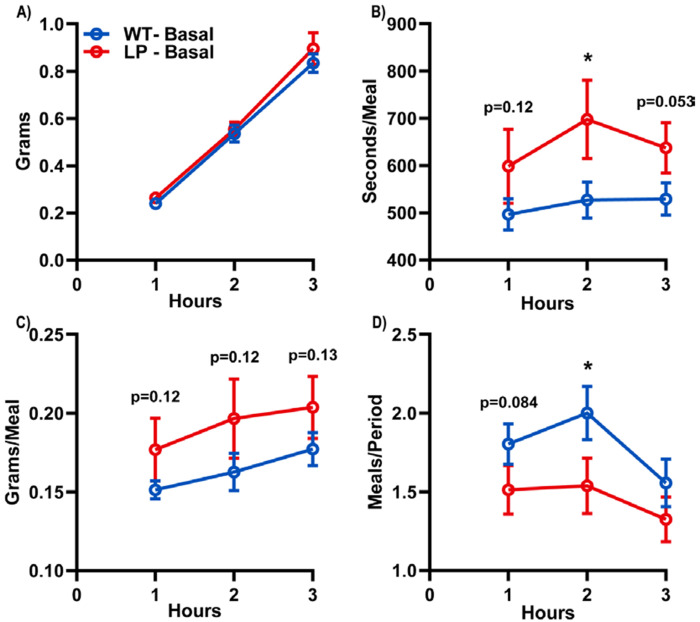
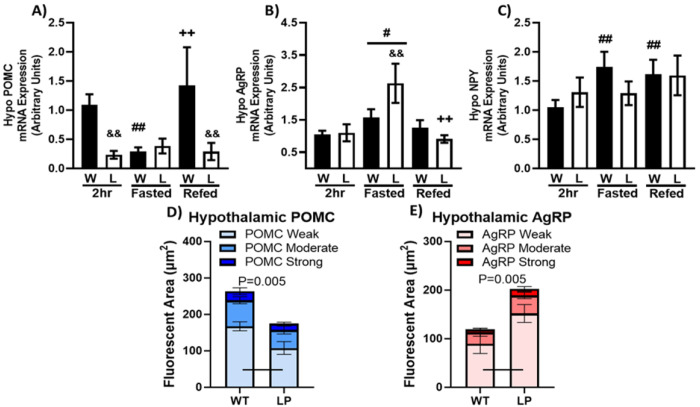
Results: We observed male liver-specific, heterozygous PGC1a mice have reduced mitochondrial response to changes in ΔGATP and tissue ATP following fasting. These impairments in liver energy state are associated with larger and longer meals during chow feeding, impaired dose-dependent food intake inhibition in response to mixed and individual nutrient oral pre-loads, and greater acute fasting-induced food intake.
Conclusion: These data support previous work proposing liver-mediated food intake regulation through modulation of peripheral satiation signals.
Keywords: ATP; Liver; fasting; food intake; mitochondria; satiation.
Conflict of interest statement
Declaration of Interests The authors declare no competing interests.
Figures


Similar articles
-
Reduced liver mitochondrial energy metabolism impairs food intake regulation following gastric preloads and fasting.Mol Metab. 2025 Jul;97:102167. doi: 10.1016/j.molmet.2025.102167. Epub 2025 May 12. Mol Metab. 2025. PMID: 40368160 Free PMC article.
-
Reduced Liver-Specific PGC1a Increases Susceptibility for Short-Term Diet-Induced Weight Gain in Male Mice.Nutrients. 2021 Jul 28;13(8):2596. doi: 10.3390/nu13082596. Nutrients. 2021. PMID: 34444756 Free PMC article.
-
Dietary glycation compounds - implications for human health.Crit Rev Toxicol. 2024 Sep;54(8):485-617. doi: 10.1080/10408444.2024.2362985. Epub 2024 Aug 16. Crit Rev Toxicol. 2024. PMID: 39150724
-
LEAP2 deletion in mice enhances ghrelin's actions as an orexigen and growth hormone secretagogue.Mol Metab. 2021 Nov;53:101327. doi: 10.1016/j.molmet.2021.101327. Epub 2021 Aug 21. Mol Metab. 2021. PMID: 34428557 Free PMC article.
-
Hypothalamic Fatty Acid Sensing in the Normal and Disease States.In: Montmayeur JP, le Coutre J, editors. Fat Detection: Taste, Texture, and Post Ingestive Effects. Boca Raton (FL): CRC Press/Taylor & Francis; 2010. Chapter 20. In: Montmayeur JP, le Coutre J, editors. Fat Detection: Taste, Texture, and Post Ingestive Effects. Boca Raton (FL): CRC Press/Taylor & Francis; 2010. Chapter 20. PMID: 21452468 Free Books & Documents. Review.
References
-
- Schachter S., 1968. Obesity and eating. Internal and external cues differentially affect the eating behavior of obese and normal subjects. Science 161(3843):751–756. - PubMed
-
- Woods S.C., 2004. Gastrointestinal satiety signals I. An overview of gastrointestinal signals that influence food intake. Am J Physiol Gastrointest Liver Physiol 286(1):G7–13. - PubMed
-
- Smith G.P., 2000. The controls of eating: a shift from nutritional homeostasis to behavioral neuroscience. Nutrition 16(10):814–820. - PubMed
Publication types
Grants and funding
LinkOut - more resources
Full Text Sources