[Preprint]. 2024 Oct 29:2024.10.27.620552.
doi: 10.1101/2024.10.27.620552.

Dynamic Kidney Organoid Microphysiological Analysis Platform

Affiliations

Dynamic Kidney Organoid Microphysiological Analysis Platform

SoonGweon Hong et al. bioRxiv. .

Abstract

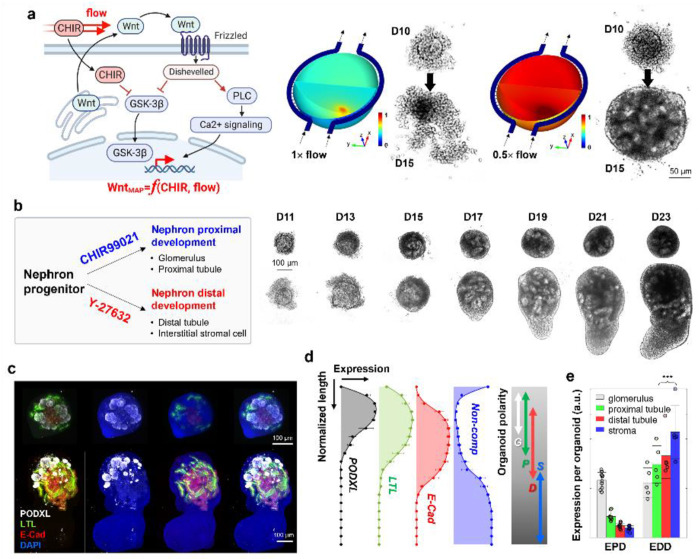
Kidney organoids, replicating human development, pathology, and drug responses, are a promising model for advancing bioscience and pharmaceutical innovation. However, reproducibility, accuracy, and quantification challenges hinder their broader utility for advanced biological and pharmaceutical applications. Herein, we present a dynamic kidney organoid microphysiological analysis platform (MAP), designed to enhance organoid modeling and assays within physiologically relevant environments, thereby expanding their utility in advancing kidney physiology and pathology research. First, precise control of the dynamic microenvironment in MAP enhances the ability to fine-tune nephrogenic intricacies, facilitating high-throughput and reproducible human kidney organoid development. Also, MAP's miniaturization of kidney organoids significantly advances pharmaceutical research by allowing for detailed analysis of entire nephron segments, which is crucial for assessing the nephrotoxicity and safety of drugs. Furthermore, the MAP's application in disease modeling faithfully recapitulates pathological development and functions as a valuable testbed for therapeutic exploration in polycystic kidney diseases. We envision the kidney organoid MAP enhancing pharmaceutical research, standardizing processes, and improving analytics, thereby elevating the quality and utility of organoids in biology, pharmacology, precision medicine, and education.


Figures

Figure 1.
Figure 1.. Kidney Organoid MAP for Reproducible Organoid Modeling.
a, The on-chip kidney organoid generation process involves a sequential procedure, starting with the generation of nephron progenitor cells (NPCs) in large-scale 2D culture, followed by the intermediate cryopreservation of NPC aliquots, and culminating in dynamic perfusion organoid development within the MAP. b, The functional microfluidic unit of the organoid MAP is comprised of perfusion channels, a hemispherical organoid chamber, and interconnecting perfusion barrier nanochannels. This fluidic configuration enables biomimetic biomolecular interactions across three compartments without subjecting the organoid chamber to fluidic shear stress. c, In vivo nephrogenesis of metanephric mesenchyme into polarized nephrons occurring through signals from the ureteric epithelium and stromal cells. d, In vivo fluidic circulation mimicked in the MAP’s microfluidic functional unit, allowing the separation of fluid momentum and functional tissue cells through the barrier properties of the endothelium lining. e, Comparison of three organoid culture methods highlighting the delicate balance within the MAP of intrinsic and extrinsic factors in close proximity to cells over time. In contrast, static culture conditions experience inevitable changes in these factors over time due to intermittent changes in media. Flow over tissue culture, on the other hand, is unsuitable for accumulating spontaneous cellular secretions around cells, which play a critical role in current organoid protocols. The symbol Δ represents uncontrollable variations in biomolecules, contributing to developmental variability in organoid modeling. f, MAP’s signaling to facilitate homogenous, reproducible development of kidney organoids by implementing dynamic microenvironments for the ureteric bud signaling (FGF, Wnt), fostering progenitor proliferation including stromal cells (ROCK inhibition), and regulating controlled intercellular communication (stroma-tubule interaction) within the MAP’s interstitial environment.
Figure 2:
Figure 2:. Biochemical Precision and Controllability of MAP’s Organogenesis.
a, The initial step of the MAP organogenesis, involving CHIR99021 priming of NPCs, emphasizes the crucial role of secondary signaling in addition to canonical Wnt/β-catenin signaling. The dynamic flow within MAP demonstrates that this signaling occurs in the context of secretion and receptor binding, functioning in an autocrine/paracrine manner. Computational and experimental results underscore the importance of secretion molecules, independent of Wnt/β-catenin easily governed by CHIR99201 perfusion, in facilitating the transition of NPCs into early epithelial nephron constructs. b, MAP’s precision in NPC differentiation signaling allows for the biochemical modulation of organoid development into either proximal-enriched or distal-enriched nephron development through the timely application of CHIR99021 and Y-27632. Optical monitoring within MAP exhibits the distinct developmental trajectories of these two types. Both patterns share a similar initial phase in NPC nephrogenesis, while tubules and stromal cells thrive in the later phases of the enhanced distal development. c, Structural analysis using confocal microscopy reveals the characteristic features of the proximal and the distal enrichment, especially significant distinction of distal tubules and stromal cells. The labels PODXL, LTL, ECAD, and DAPI correspond to podocalyxin, lotus tetragonolobus lectin, E-cadherin, and 4’,6-diamidino-2-phenylindole, respectively. d, The structural arrangement of MAP’s organoids with enhanced distal development reflects a sequential placement from PODXL-positive glomerulus-like structures, proximal tubules, and distal tubules with stroma, resembling early-stage kidney arrangement (Data are represented as the mean ± s.d. from 5 organoids in three independent experiments; data points excluded for visual clarity). e, Quantification of individual compartments indicates the prevalence of E-CAD positive distal tubules and the stromal population in enhanced distal development (EDD) compared to enhanced proximal development (EPD) (nEPD =10 and nEDD =5 from two and three independent experiments, respectively, and presented as the mean ± s.d). The normalized expression levels of the proximal tubule, distal tubule, and stroma showed a significance level in the t-test of p < 0.01 (***).
Figure 3.
Figure 3.. MAP’s nephrotoxicity study with nephron segment-specific quantification.
a, MAP’s nephrotoxicity quantification is facilitated by MAP’s fidelity in organoid miniaturization, whole-organoid confocal microscopy, and microsegment quantification. Our optimal compromise between microscopic visualization of structural details and specimen size allows effective 3-dimensional reconstruction and a multi-context analysis via microsegmental examination. A snapshot presents the optical power to detail structural contexts. b, c, d, e, 2-day-long gentamicin-containing perfusions in MAP causes a broad aminoglycoside nephrotoxicity across nephron constructs (day 30). This study included an examination of distal tubule damage with decreased E-CAD expression (b), a tubular injury marker of proximal injury that increases KIM-1 (c), tubular obstruction with nuclear staining (the inset in a), cell death among stromal population by nuclear morphology (d), and glomerular damage by reduced podocalyxin expression (e). LTL-based proximal tubular damage was not clearly distinguished. f, The dose-dependent gentamicin nephrotoxicity is summarized in a bar plot on the multi-aspect nephrotoxicity through the microsegmentation approach. Among the broad spectrum, KIM-1 expression was the most sensitive biomarker induced by gentamicin. Most comparisons to the control showed statistical significance in the t-test (p < 0.05), except for KIM-1 at 10 μM gentamicin, which had a p-value of 0.052, as indicated in the raw data. g, h, Temporal dynamics of kidney damage expression after 12-hour 10-μM cisplatin perfusion were characterized in time-lapse application of assays across a uniform set of kidney organoids (day 30) in MAP. KIM-1 in the lumen of proximal tubule, and appearance of apoptotic and dead cells gradually increased after the cisplatin application. Our analysis presents a constituent expression of caspase 3/7 activity in the PODXL-positive compartment, requiring caution to interpret the expression per organoid. i, j, Cisplatin dose-response was quantified 2 days after 12-hour cisplatin perfusion with concentration between 2 and 20μM. The quantification of KIM-1 and dead cells was specified within LTL-positive proximal tubules. The caspase-active apoptotic cells rarely overlapped with tubular segments but increased its prevalence among stromal cells. The zero concentration represents a vehicle control with DMSO used to prepare the cisplatin stock. All the comparisons to the control showed statistical significance in the t-test (p < 0.05), as indicated in the raw data. The nephrotoxicity plots of f & j were derived from distinct experiments, comprising seven for gentamicin and three for cisplatin. Each data is the mean ± s.d of 5 organoids per condition.
Figure 4.
Figure 4.. MAP’s disease modeling and therapeutic investigation based on nephrogenesis and transcriptomic expression of isogenic healthy and PKHD1-mutant organoids to recapitulate autosomal recessive polycystic kidney disease (ARPKD).
a, The framework of our MAP’s therapeutic interventions in ARPKD pathogenesis focuses on NF-κB and oxidative stress and the use of minimal-adverse-effect drugs. Parthenolide and methylene blue were employed to regulate NF-κB and reactive oxidative stress during the early-stage cystogenesis of ARPKD. b, Differential expressions in ARPKD organoids include genes related to endogenous ROS scavengers and NF-κB regulation, illustrating the pathogenetic paradigm. c, The ARPKD organoids exhibited spontaneous development of cystic compartments with a 55±4.5% prevalence, as indicated by the arrow. These compartments were predominantly lined with E-Cadherin-positive epithelial cells, with interspersed LTL-positive cells. Additionally, secondary cyst buds were frequently observed, as denoted by the white arrow in the right confocal image. d, The therapeutic effectiveness of anti-ROS and NF-κB inhibitory agents was evaluated under conditions inducing cAMP-enhanced cystogenesis with forskolin. The heatmap on the left illustrates the frequency of cyst development within 20 ARPKD organoids. Parthenolide was administered with a one-day-long application. Methylene blue was administered for eight days at various concentrations prior to two-day-long Forskolin applications. e, The time-lapse trace presents a significant expansion of cystic compartments by forskolin application, while the therapeutic pretreatment effectively prevented pathological progression (cases depicted for 0 and 100 nM methylene blue with 500nM parthenolide prior to 30 μM forskolin). The corresponding confocal characterization with DAPI (right upper and lower panels) highlighted the exacerbation of pathological changes by cAMP signaling, whereas the therapeutic pre-treatment resulted in a normal development, comparable to their healthy organoid counterparts. The green arrows, which indicate glomerular positions, demonstrate the abnormal placement of glomeruli in cyst-containing ARPKD organoids. f, RNA-Seq comparisons among isogenic healthy, untreated ARPKD, and treated ARPK organoids are visualized in the baseline MA plot of healthy organoid vs. untreated ARPKD. The gray dots represent genes identified through the analysis of differential gene expression, while the black dots denote genes with a significance level of adjusted p<0.05. In comparison between untreated and treated ARPKD organoids, therapeutically improved genes among black-dotted genes were marked with the colored symbols as outlined in the legend. Additional details can be found in ‘Results,’ and ‘Methods.’ g, The gene ontology of the differentially expressed genes (DEG) with significance reveals PKHD1-induced modified genes that are related to skeletal muscle tissue development in biological process (BP), structural constituent of muscle in molecular function (MF), proteinaceous extracellular matrix in cellular component (CC), and striated muscle contraction in reactome (Re). Gene symbols mark the most significantly differentially expressed genes in each context. The full gene set is shown in Supplementary Table 1. h, The gene ontology of the DEG between untreated and treated ARPKD organoids highlights extracellular structure organization in BP, collagen binding in MF, proteinaceous extracellular matrix in CC, and HS-GAG degradation in Re. The complete gene set is provided in Supplementary Table 2. i, The gene set associated with therapeutic improvement was analyzed in the network analysis, resulting in an exploration of PKD-associated biology with the highlighting of blue-colored genes. The criterion applied was the significance of differentially expressed genes (DEGs) between untreated and treated ARPKD, along with the opposite fold changes between control vs. untreated ARPKD and untreated vs. treated ARPKD. Full gene names are provided in Supplementary Fig. 1.

Similar articles

References

    1. Dressier G. R. The Cellular Basis of Kidney Development. Annual Review of Cell and Developmental Biology 22, 509–529 (2006). 10.1146/annurev.cellbio.22.010305.104340 - DOI - PubMed
    1. Garrett M. R. & Korstanje R. Using Genetic and Species Diversity to Tackle Kidney Disease. Trends Genet 36, 499–509 (2020). 10.1016/j.tig.2020.04.001 - DOI - PMC - PubMed
    1. Little M. H. & McMahon A. P. Mammalian kidney development: principles, progress, and projections. Cold Spring Harbor perspectives in biology 4, a008300 (2012). - PMC - PubMed
    1. Godin R. E., Robertson E. J. & Dudley A. T. Role of BMP family members during kidney development. International Journal of Developmental Biology 43, 405–411 (2003). - PubMed
    1. Carroll T. J. & McMAHON A. P. Secreted molecules in metanephric induction. Journal of the American Society of Nephrology 11, S116–S119 (2000). - PubMed

Publication types

LinkOut - more resources