. 2024 Oct 30;9(45):45402-45420.
doi: 10.1021/acsomega.4c07415. eCollection 2024 Nov 12.

Enhanced Delivery and Potency of Chemotherapeutics in Melanoma Treatment via Magnetite Nanobioconjugates

Affiliations

Enhanced Delivery and Potency of Chemotherapeutics in Melanoma Treatment via Magnetite Nanobioconjugates

Erika Díaz et al. ACS Omega. .

Abstract

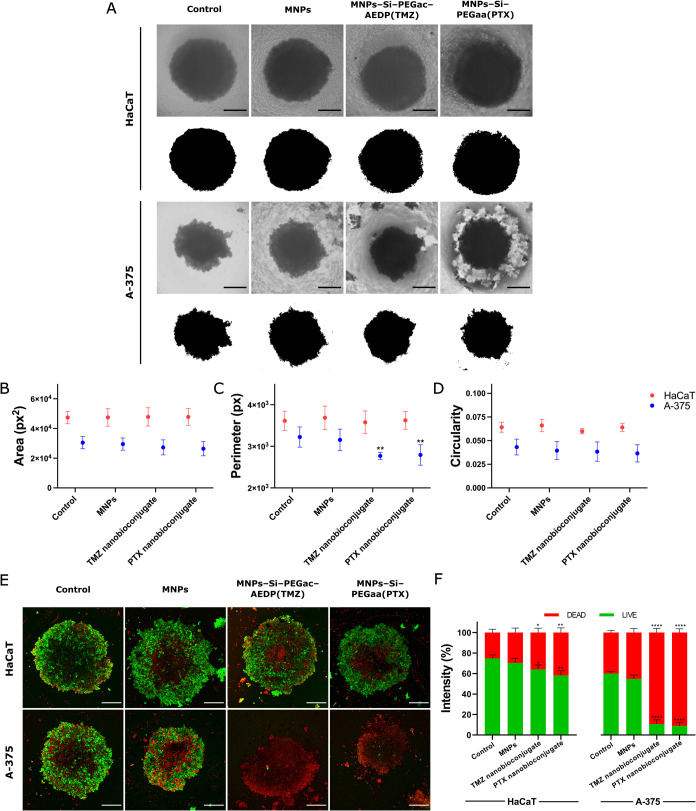
Melanoma, known for its aggressive metastatic potential, poses significant treatment challenges. Despite the potent antiproliferative effects of anticancer drugs, systemic toxicity and low water solubility limit their efficacy. This study addresses these challenges by employing magnetite (Fe3O4) nanobioconjugates as a drug delivery system, aimed at enhancing drug solubility and reducing off-target effects in melanoma therapy. Magnetite nanoparticles (MNPs) were engineered with functional molecules and loaded with the anticancer agents Temozolomide (TMZ) or paclitaxel (PTX). The nanobioconjugates were characterized via Fourier transform infrared spectroscopy (FTIR), thermogravimetric analysis (TGA), dynamic light scattering (DLS), and transmission electron microscopy (TEM). The results validated the efficacious synthesis and drug loading, attaining efficiencies ranging from 32 to 72% for TMZ and 32 to 60% for PTX. Biocompatibility assessments demonstrated excellent tolerance, with minimal hemolysis rates and platelet aggregation. In vitro studies revealed enhanced cytotoxicity against A-375 human melanoma cells compared to free drugs, with cellular uptake facilitated primarily through macropinocytosis, caveolin-, and clathrin-mediated endocytosis. Furthermore, the nanobioconjugates exhibited significant efficacy in targeting A-375 melanoma spheroids, underlining their potential in melanoma therapy. This research underscores magnetite nanobioconjugates as a promising avenue for targeted melanoma treatment, offering enhanced drug delivery specificity and reduced systemic toxicity in oncological drug delivery systems.


Conflict of interest statement

The authors declare no competing financial interest.

Figures

Figure 1
Figure 1
Final chemical structures of the evaluated nanobioconjugates. Drug loading on (A) bare MNPs (control), (B) PEGylated MNPs, (C) AEDP–PEGylated MNPs, and (D) BUF-II–PEGylated MNPs. Created with BioRender.com.
Figure 2
Figure 2
Physicochemical and microscopic characterization of nanobioconjugates. (A) FTIR spectra and (B) TGA analyses of TMZ nanoconjugates. (C) FTIR spectra and (D) TGA analyses of PTX nanoconjugates. (E) Microscopic characterization of bare MNPs. The morphology and size were analyzed through TEM at 145 kX. (F) Size distribution histogram of bare MNPs (based on TEM images).
Figure 3
Figure 3
Biocompatibility assays of the nanobioconjugates. (A) Hemolytic effect, (B) platelet aggregation and, (C) cytotoxicity of the TMZ nanobioconjugates. (D) Hemolytic effect, (E) platelet aggregation and, (F) cytotoxicity of the PTX nanobioconjugates. Cell viability is represented for the nanobioconjugates evaluated at 25 μg/mL at 72 h. The symbol * corresponds to a statistically significant difference with a p-value in the range of 0.01 ≤ p-value ≤0.05, ** to a statistically significant difference with a p-value in the range of 0.001 ≤ p-value <0.01, *** to p-value in the range of 0.0001 ≤ p-value ≤0.001 and **** to p-value <0.0001.
Figure 4
Figure 4
A-375 and HaCaT spheroids morphology and cell viability after 72 h of exposure to bare MNPs, TMZ nanobioconjugate, and PTX nanobioconjugate evaluated at 25 μg/mL and the control without nanoparticles. (A) Images were obtained by using a 4X objective, below each image, the mask used for the analysis of the morphology is shown. The scale bar corresponds to 500 μm (B) area, (C) perimeter, and (D) circularity graphics. (E) Confocal images were obtained by using 10X objective. Calcein AM was used to label LIVE cells and Ethidium Homodimer was used to label DEAD cells. Scale bar corresponds to 250 μm. (F) Fluorescence intensity for green and red channels. The symbol * corresponds to a statistically significant difference with a p-value in the range of 0.01 ≤ p-value ≤0.05, ** to a statistically significant difference with a p-value in the range of 0.001 ≤ p-value <0.01, *** to p-value in the range of 0.0001 ≤ p-value ≤0.001 and **** to p-value <0.0001.
Figure 5
Figure 5
Confocal microscopy images for cell-internalization pathways and endosomal escape analysis, Pearson Correlation Coefficient (PCC) and percentage of intracellular area covered by Rhodamine-B labeled MNPs, Propidium Iodide labeled MNPs–Si–PEGac–AEDP(TMZ) and Rhodamine-B labeled MNPs–Si–PEGaa(PTX) in HaCaT cells at 0.5 and 4 h after the nanobioconjugates exposure. The scale bars correspond to 50 μm. In (A), (D), and (G) the images show the nuclei labeled with Hoechst (blue), endosomes with Lysotracker Green (green), and nanobioconjugates with Rhodamine-B or Propidium iodide (red). The yellow areas correspond to colocalization between red and green channels, indicating lysosomal entrapment. (B), (E), and (H) correspond to the PCC of the nanobioconjugates in HaCaT cells. Higher PCC values denote a greater correlation between the red and green channels, indicating lysosomal entrapment. (C), (F), and (I) show the covered area percentage for the nanobioconjugates in HaCaT cells. The symbol * corresponds to a statistically significant difference with a p-value in the range of 0.01 ≤ p-value ≤0.05, ** to a statistically significant difference with a p-value in the range of 0.001 ≤ p-value <0.01, *** to p-value in the range of 0.0001 ≤ p-value ≤0.001 and **** to p-value <0.0001.
Figure 6
Figure 6
Confocal microscopy images for cell-internalization pathways and endosomal escape analysis, Pearson Correlation Coefficient (PCC) and percentage of intracellular area covered by Rhodamine-B labeled MNPs, Propidium Iodide labeled MNPs–Si–PEGac–AEDP(TMZ) and Rhodamine-B labeled MNPs–Si–PEGaa(PTX) in A-375 cells at 0.5 and 4 h after the nanobioconjugates exposure. The scale bars correspond to 50 μm. In (A), (D), and (G) the images show the nuclei labeled with Hoechst (blue), endosomes with Lysotracker Green (green), and nanobioconjugates with Rhodamine-B or Propidium iodide (red). The yellow areas correspond to colocalization between red and green channels, indicating lysosomal entrapment. (B), (E), and (H) correspond to the PCC of the nanobioconjugates in A-375 cells. Higher PCC values denote a greater correlation between the red and green channels, indicating lysosomal entrapment. (C), (F), and (I) show the covered area percentage for the nanobioconjugates in A-375 cells. The symbol * corresponds to a statistically significant difference with a p-value in the range of 0.01 ≤ p-value ≤0.05, ** to a statistically significant difference with a p-value in the range of 0.001 ≤ p-value <0.01, *** to p-value in the range of 0.0001 ≤ p-value ≤0.001 and **** to p-value <0.0001.

Similar articles

Cited by

References

    1. El-Kenawy A. E.-M.; Constantin C.; Hassan S. M. A.; Mostafa A. M.; Neves A. F.; De Araújo T. G.; Neagu M.. Nanomedicine in Melanoma: Current Trends and Future Perspectives. In Cutaneous Melanoma: Etiology and Therapy; Codon Publications, 2017; pp 143–159. - PubMed
    1. Zeng H.; Li J.; Hou K.; Wu Y.; Chen H.; Ning Z. Melanoma and Nanotechnology-Based Treatment. Front Oncol. 2022, 12, 858185.10.3389/fonc.2022.858185. - DOI - PMC - PubMed
    1. Wilson B. E.; Jacob S.; Yap M. L.; Ferlay J.; Bray F.; Barton M. B. Estimates of Global Chemotherapy Demands and Corresponding Physician Workforce Requirements for 2018 and 2040: A Population-Based Study. Lancet Oncol. 2019, 20 (6), 769–780. 10.1016/S1470-2045(19)30163-9. - DOI - PubMed
    1. Song M.; Liu C.; Chen S.; Zhang W. Nanocarrier-Based Drug Delivery for Melanoma Therapeutics. Int. J. Mol. Sci. 2021, 22 (4), 1873.10.3390/ijms22041873. - DOI - PMC - PubMed
    1. Yao Y.; Zhou Y.; Liu L.; Xu Y.; Chen Q.; Wang Y.; Wu S.; Deng Y.; Zhang J.; Shao A. Nanoparticle-Based Drug Delivery in Cancer Therapy and Its Role in Overcoming Drug Resistance. Front. Mol. Biosci. 2020, 7, 193.10.3389/fmolb.2020.00193. - DOI - PMC - PubMed

LinkOut - more resources