

Of Mice and Mates: Automated Classification and Modelling of Mouse Behaviour in Groups Using a Single Model Across Cages
- PMID: 39554493
- PMCID: PMC11568001
- DOI: 10.1007/s11263-024-02118-3
Of Mice and Mates: Automated Classification and Modelling of Mouse Behaviour in Groups Using a Single Model Across Cages
Abstract
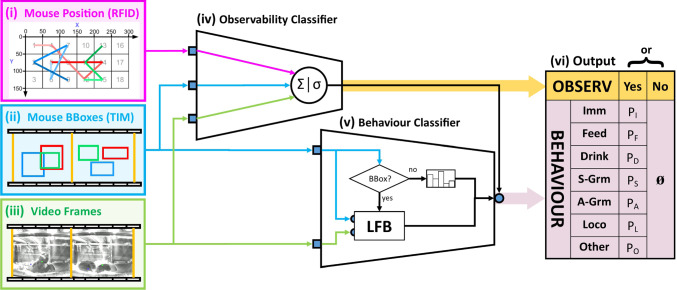
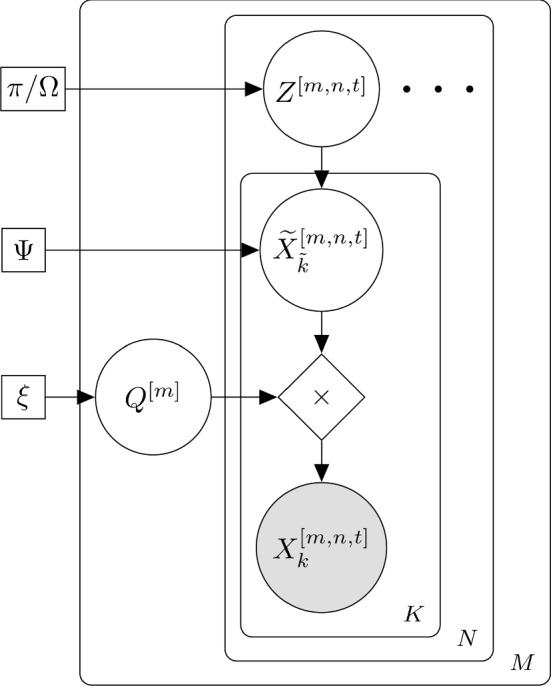
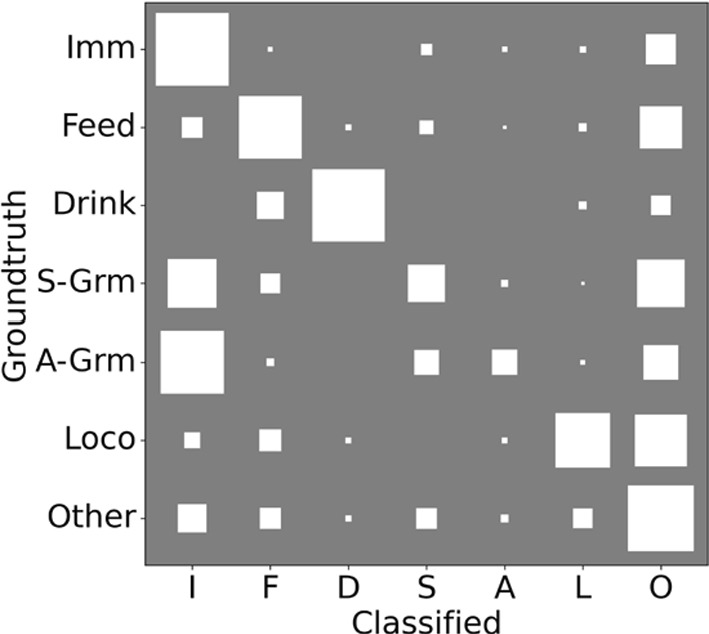
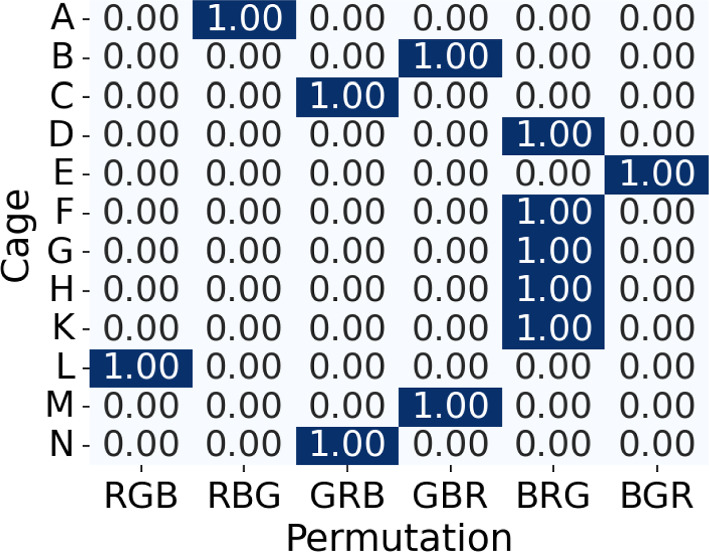
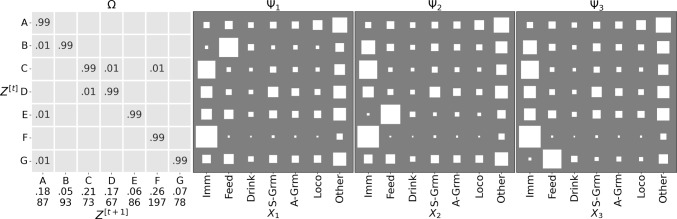
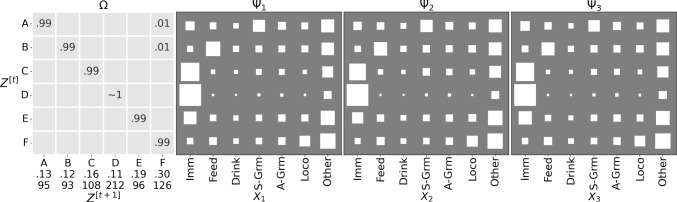
Behavioural experiments often happen in specialised arenas, but this may confound the analysis. To address this issue, we provide tools to study mice in the home-cage environment, equipping biologists with the possibility to capture the temporal aspect of the individual's behaviour and model the interaction and interdependence between cage-mates with minimal human intervention. Our main contribution is the novel Global Behaviour Model (GBM) which summarises the joint behaviour of groups of mice across cages, using a permutation matrix to match the mouse identities in each cage to the model. In support of the above, we also (a) developed the Activity Labelling Module (ALM) to automatically classify mouse behaviour from video, and (b) released two datasets, ABODe for training behaviour classifiers and IMADGE for modelling behaviour.
Supplementary information: The online version contains supplementary material available at 10.1007/s11263-024-02118-3.
Keywords: Automated behaviour classification; Home-cage analysis; Joint behaviour model; Mouse behaviour data; Mouse behaviour model.
© The Author(s) 2024.
Conflict of interest statement
Conflict of interestNot applicable.
Figures

Similar articles
-
Behavioural characterization of C57BL/6N and BALB/c female mice in social home cage - Effect of mixed housing in complex environment.Physiol Behav. 2018 May 1;188:32-41. doi: 10.1016/j.physbeh.2018.01.024. Epub 2018 Jan 31. Physiol Behav. 2018. PMID: 29382562
-
Evaluation of the effects of cage height and stocking density on the behaviour of laying hens in furnished cages.Br Poult Sci. 2007 Feb;48(1):1-11. doi: 10.1080/00071660601156479. Br Poult Sci. 2007. PMID: 17364534
-
Low-cost solution for rodent home-cage behaviour monitoring.PLoS One. 2019 Aug 2;14(8):e0220751. doi: 10.1371/journal.pone.0220751. eCollection 2019. PLoS One. 2019. PMID: 31374097 Free PMC article.
-
Mice Recognise Mice in Neighbouring Rearing Cages and Change Their Social Behaviour.Behav Neurol. 2024 Jan 16;2024:9215607. doi: 10.1155/2024/9215607. eCollection 2024. Behav Neurol. 2024. PMID: 38264671 Free PMC article.
-
RFID-supported video tracking for automated analysis of social behaviour in groups of mice.J Neurosci Methods. 2019 Sep 1;325:108323. doi: 10.1016/j.jneumeth.2019.108323. Epub 2019 Jun 27. J Neurosci Methods. 2019. PMID: 31255597 Review.
References
-
- Alboni, S., van Dijk, R. M., Poggini, S., Milior, G., Perrotta, M., Drenth, T., Brunello, N., Wolfer, D. P., Limatola, C., Amrein, I., Cirulli, F., Maggi, L., & Branchi, I. (2017). Fluoxetine effects on molecular, cellular and behavioral endophenotypes of depression are driven by the living environment. Molecular Psychiatry,22(4), 552–561. - PMC - PubMed
-
- Arakawa, T., Tanave, A., Ikeuchi, S., Takahashi, A., Kakihara, S., Kimura, S., Sugimoto, H., Asada, N., Shiroishi, T., Tomihara, K., Tsuchiya, T., & Koide, T. (2014). A male-specific QTL for social interaction behavior in mice mapped with automated pattern detection by a hidden Markov model incorporated into newly developed freeware. Journal of Neuroscience Methods,234, 127–134. - PubMed
-
- Bailoo, J. D., Murphy, E., Boada-Saña, M., Varholick, J. A., Hintze, S., Baussière, C., Hahn, K. C., Göpfert, C., Palme, R., Voelkl, B., & Würbel, H. (2018). Effects of cage enrichment on behavior, welfare and outcome variability in female mice. Frontiers in Behavioral Neuroscience,12(232), 1–20. - PMC - PubMed
-
- Bains, R. S., Cater, H. L., Sillito, R. R., Chartsias, A., Sneddon, D., Concas, D., Keskivali-Bond, P., Lukins, T. C., Wells, S., Acevedo, A. A., Nolan, P. M., & Armstrong, J. D. (2016). Analysis of individual mouse activity in group housed animals of different inbred strains using a novel automated home cage analysis system. Frontiers in Behavioral Neuroscience,10(106), 1–12. - PMC - PubMed
-
- Bains, R. S., Forrest, H., Sillito, R. R., Armstrong, J. D., Stewart, M., Nolan, P. M., & Wells, S. E. (2023). Longitudinal home-cage automated assessment of climbing behavior shows sexual dimorphism and aging-related decrease in C57BL/6J healthy mice and allows early detection of motor impairment in the N171–82Q mouse model of Huntington’s disease. Frontiers in Behavioral Neuroscience,17, 1–13. - PMC - PubMed
LinkOut - more resources
Full Text Sources