

Enhancing random forest predictive performance for foot and mouth disease outbreaks in Uganda: a calibrated uncertainty prediction approach for varying distributions
- PMID: 39554990
- PMCID: PMC11564173
- DOI: 10.3389/frai.2024.1455331
Enhancing random forest predictive performance for foot and mouth disease outbreaks in Uganda: a calibrated uncertainty prediction approach for varying distributions
Abstract
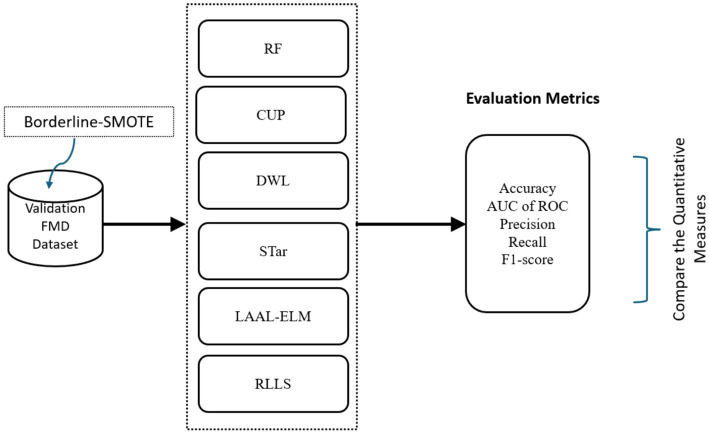
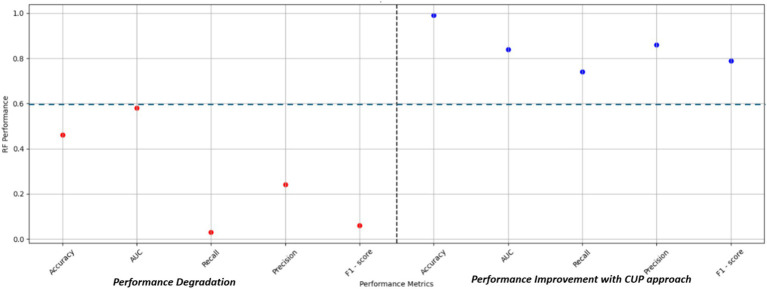
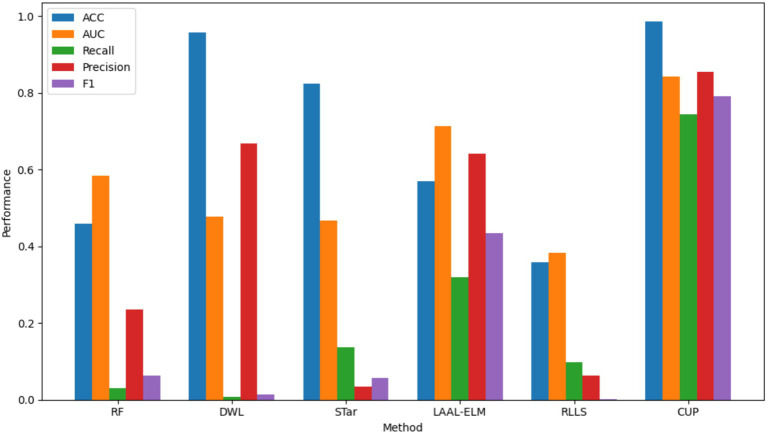
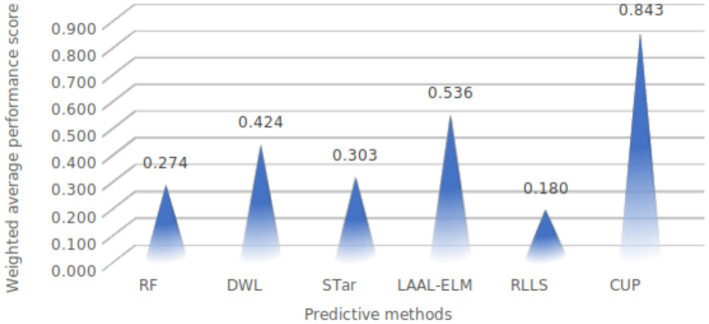
Foot-and-mouth disease poses a significant threat to both domestic and wild cloven-hoofed animals, leading to severe economic losses and jeopardizing food security. While machine learning models have become essential for predicting foot-and-mouth disease outbreaks, their effectiveness is often compromised by distribution shifts between training and target datasets, especially in non-stationary environments. Despite the critical impact of these shifts, their implications in foot-and-mouth disease outbreak prediction have been largely overlooked. This study introduces the Calibrated Uncertainty Prediction approach, designed to enhance the performance of Random Forest models in predicting foot-and-mouth disease outbreaks across varying distributions. The Calibrated Uncertainty Prediction approach effectively addresses distribution shifts by calibrating uncertain instances for pseudo-label annotation, allowing the active learner to generalize more effectively to the target domain. By utilizing a probabilistic calibration model, Calibrated Uncertainty Prediction pseudo-annotates the most informative instances, refining the active learner iteratively and minimizing the need for human annotation and outperforming existing methods known to mitigate distribution shifts. This reduces costs, saves time, and lessens the dependence on domain experts while achieving outstanding predictive performance. The results demonstrate that Calibrated Uncertainty Prediction significantly enhances predictive performance in non-stationary environments, achieving an accuracy of 98.5%, Area Under the Curve of 0.842, recall of 0.743, precision of 0.855, and an F1 score of 0.791. These findings underscore Calibrated Uncertainty Prediction's ability to overcome the vulnerabilities of existing ML models, offering a robust solution for foot-and-mouth disease outbreak prediction and contributing to the broader field of predictive modeling in infectious disease management.
Keywords: calibrated uncertainty prediction; distribution shifts; foot-and-mouth disease; performance improvement rates; random forest.
Copyright © 2024 Kapalaga, Kivunike, Kerfua, Jjingo, Biryomumaisho, Rutaisire, Ssajjakambwe, Mugerwa, Abbey, Aaron and Kiwala.
Conflict of interest statement
The authors declare that the research was conducted in the absence of any commercial or financial relationships that could be construed as a potential conflict of interest.
Figures


References
-
- Aghaei S., Gómez A., Vayanos P. (2021). Strong optimal classification trees. arXiv:2103.15965. doi: 10.48550/arXiv.2103.15965 - DOI
-
- Amrani H. (2021). Model-centric and data-centric AI for personalization in human activity recognition. Thesis for: Master's Degree of Computer Science. doi: 10.13140/RG.2.2.16280.72965 - DOI
-
- Antoniou A., Storkey A., Edwards H. (2017). Data augmentation generative adversarial networks. arXiv:1711.04340. doi: 10.48550/arXiv.1711.04340 - DOI
-
- Arazo E., Ortego D., Albert P., O’Connor N. E., McGuinness K. (2020). Pseudo-labeling and confirmation bias in deep semi-supervised learning. arXiv, 1–8. doi: 10.48550/arXiv.1908.02983 - DOI
-
- Azizzadenesheli K., Liu A., Yang F., Anandkumar A. (2019). Regularized learning for domain adaptation under label shifts. arXiv:1903.09734. doi: 10.48550/arXiv.1903.09734 - DOI
LinkOut - more resources
Full Text Sources