. 2024 Oct 15;35(4):102359.
doi: 10.1016/j.omtn.2024.102359. eCollection 2024 Dec 10.

Preventing acute neurotoxicity of CNS therapeutic oligonucleotides with the addition of Ca2+ and Mg2+ in the formulation

Affiliations

Preventing acute neurotoxicity of CNS therapeutic oligonucleotides with the addition of Ca2+ and Mg2+ in the formulation

Rachael Miller et al. Mol Ther Nucleic Acids. .

Abstract

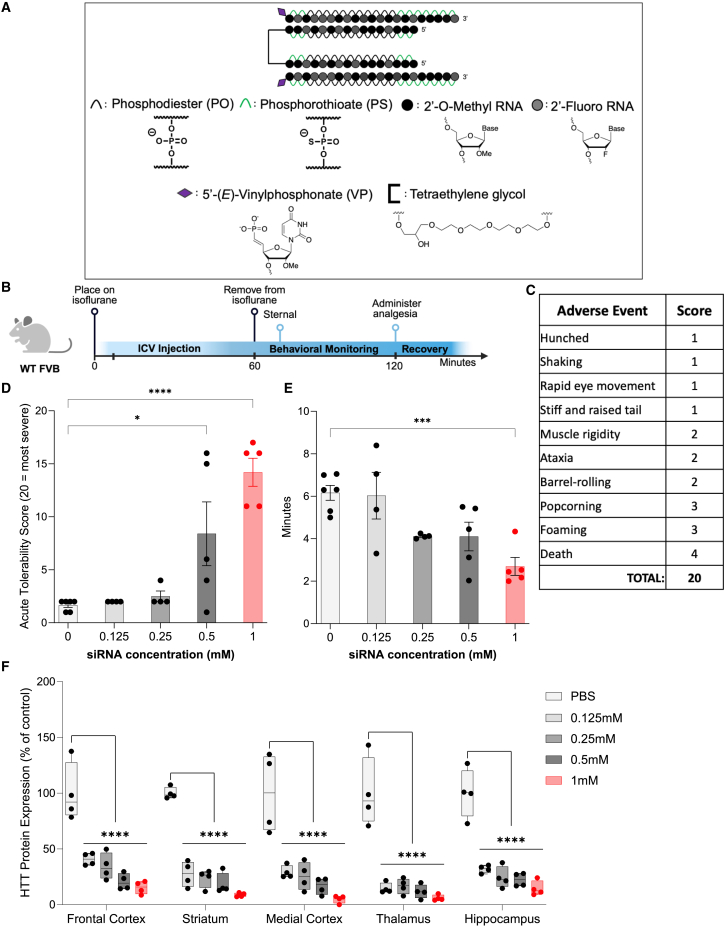
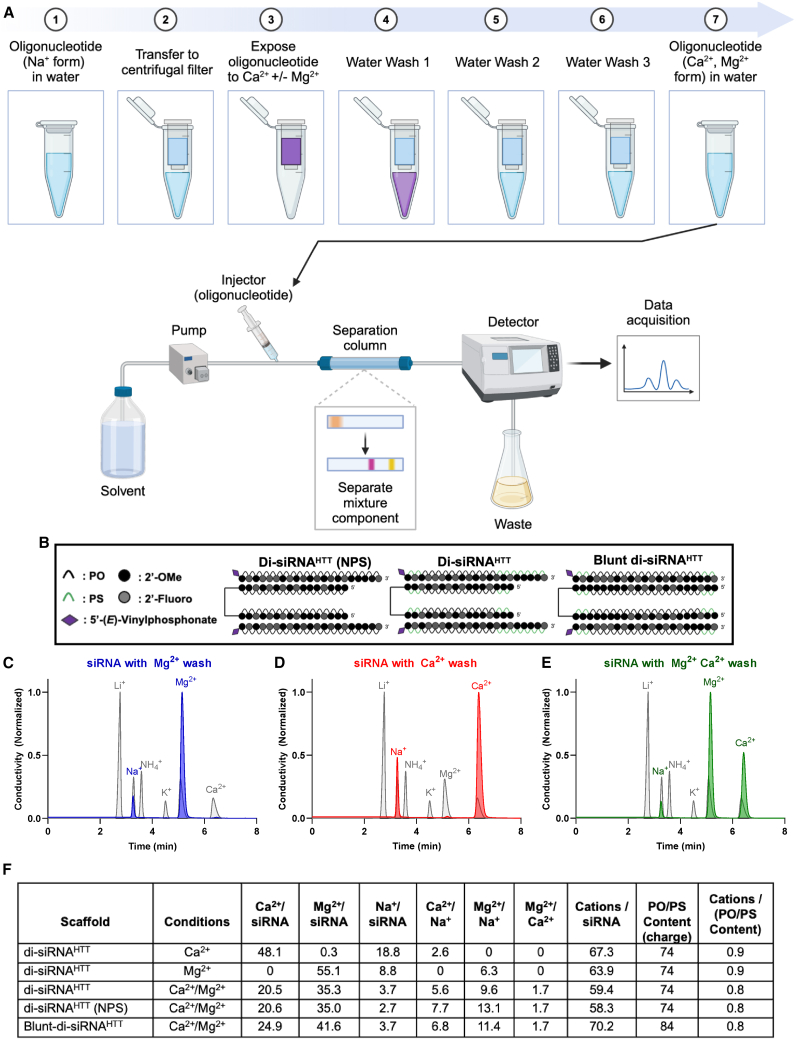
Oligonucleotide therapeutics (ASOs and siRNAs) have been explored for modulation of gene expression in the central nervous system (CNS), with several drugs approved and many in clinical evaluation. Administration of highly concentrated oligonucleotides to the CNS can induce acute neurotoxicity. We demonstrate that delivery of concentrated oligonucleotides to the CSF in awake mice induces acute toxicity, observable within seconds of injection. Electroencephalography and electromyography in awake mice demonstrated seizures. Using ion chromatography, we show that siRNAs can tightly bind Ca2+ and Mg2+ up to molar equivalents of the phosphodiester/phosphorothioate bonds independently of the structure or phosphorothioate content. Optimization of the formulation by adding high concentrations (above biological levels) of divalent cations (Ca2+ alone, Mg2+ alone, or Ca2+ and Mg2+) prevents seizures with no impact on the distribution or efficacy of the oligonucleotide. The data here establish the importance of adding Ca2+ and Mg2+ to the formulation for the safety of CNS administration of therapeutic oligonucleotides.

Keywords: CNS therapeutics; Huntington’s disease; MT: Oligonucleotides: Therapies and Applications; RNAi; brain delivery; genetic diseases; neurological disorders; oligonucleotide-based therapies; oligonucleotides.


Conflict of interest statement

A.K. and N.A. are co-founders, on the scientific advisory board, and hold equities of Atalanta Therapeutics. A.K. is a founder of Comanche Pharmaceuticals and on the scientific advisory board of Aldena Therapeutics, AlltRNA, Prime Medicine, and EVOX Therapeutics. N.A. is on the scientific advisory board of the Huntington’s Disease Society of America (HDSA). Select authors hold patents or on patent applications relating to the divalent siRNA and the methods described in this report.

Figures

None
Graphical abstract
Figure 1
Figure 1
CNS injections of di-siRNA induce acute neurotoxicity in a dose-dependent manner (A) The chemical structure of the di-siRNAHTT used throughout this figure contains 74 mM of PO/PS backbones, alternating 2′-OMe and 2′-Fluoro modifications, 5ʹ-(E)-VP modifications, and a glycerol-tetraethyleneglycol linker. (B) Timeline showing the surgical procedure and recovery period for wild-type mice injected bilateral i.c.v. with oligonucleotides under isoflurane anesthesia (created with BioRender.com). (C) Table outlining the acute tolerability scoring used to track adverse events that may not represent tonic-clonic seizures. The adverse events were scored based on an observational severity index (1 = least, 4 = most). A score of 20 represents the worst acute neurotoxicity observed during recovery, and a score of 0 represents no adverse events observed. (D) There was a dose-dependent increase in the severity of adverse events in wild-type mice injected with 0.125, 0.25, 0.5, or 1 mM (∼28, ∼56, 112.5, and 225 μg) di-siRNAHTT in 10 μL 1× PBS buffer. Administering the 0.5 and 1 mM di-siRNAHTT resulted in significantly more severe abnormal behavioral phenotypes. Each data point represents one mouse (n = 4–6). ∗p = 0.0163, ∗∗∗∗p < 0.0001; data were analyzed using one-way ANOVA followed by Tukey’s post hoc test. (E) There was a significant difference in the time it took mice to be sternal following 1 mM (225 μg/10 μL total dose) di-siRNAHTT injections compared with the 1PBS controls. Each data point represents one mouse (n = 4–6). ∗∗∗p = 0.0010.; data were analyzed using one-way ANOVA followed by Bonferroni’s multiple comparisons test. (F) Normal huntingtin (HTT) protein levels in di-siRNAHTT-treated mice versus 1× PBS controls measured by ProteinSimple Wes 1 month post-i.c.v. injections in the frontal cortex (FC), striatum (S), medial cortex (MC), thalamus (T), and hippocampus (H). There was significant HTT protein lowering across all brain regions measured with all four di-siRNAHTT versus the 1× PBS vehicle control group (∗∗∗∗p < 0.0001). Each data point represents one mouse and error bars represent mean values SEM (n = 4). Data were analyzed using two-way ANOVA with Tukey’s multiple comparisons test.
Figure 2
Figure 2
Electrophysiology defines the acute neurotoxicity induced by CNS injections of di-siRNA in awake mice (A) Timeline showing the bilateral i.c.v. injection of oligonucleotides associated with EEG/EMG recording in awake and freely moving wild-type mice (created with BioRender.com). (B) Table outlining the number of wild-type mice with seizure responses recorded by EEG/EMG following i.c.v. injections of the following treatments: 0.25 mM (∼56 μg) n = 6, 0.5 mM (112.5 μg) n = 6, or 1 mM (225 μg) n = 2, di-siRNAHTT in 10 μL 1× PBS. (C–E) EEG/EMG examples from a freely moving mouse receiving bilateral i.c.v. injection of 1× PBS (C), 0.5 mM (112.5 μg) di-siRNAHTT (D), or 1 mM (225 μg) di-siRNAHTT (E) in 10 μL 1× PBS. The top left arrow indicates the insertion of the injector in the mouse guide cannula. The compounds were first injected in one of the two lateral ventricles and then in the second lateral ventricle (5 μL in 10 min, pink lines). Ten minutes separated the two side injections (light blue line). Following the end of the second side injection, the injector was left in place for an additional 10 min (dark blue line). The right arrow indicates the removal of the injector from the mouse guide cannula. (c) Zoom into the portion of (C) EEG-EMG example, delineated by the vertical bars. Note that the mouse injected with PBS displays normal EEG-EMG activity during the i.c.v. injection. (d) Zoom into the portion of (D) EEG-EMG example, delineated by the vertical bars. The mouse injected with 0.5 mM (112.5 μg) di-siRNAHTT 1× PBS displays a single seizure, characterized by high-amplitude EEG waves and intense EMG activity, during the second side injection (d). (e, e’) Zoom into the portion of (E) EEG/EMG example, delineated by the vertical bars. The mouse injected with 1 mM (225 μg) di-siRNAHTT (E) in 10 μL 1× PBS displays multiple seizures, characterized by high-amplitude EEG waves and intense EMG activity, starting around the beginning of the second side injection. Interestingly, about 10 min following the injector removal, the mouse enters a prolonged seizure (e, e’) that results in death, characterized by the absence of an EEG/EMG signal. Asterisks (∗) denote seizures across the EEG/EMG example.
Figure 3
Figure 3
There is preferential binding of Ca2+ and Mg2+ divalent cations to the negatively charged PO/PS oligonucleotide backbone in vitro (A) Schematic (created with BioRender.com) depicting the ion chromatography workflow for in vitro divalent cation analysis of di-siRNAs. Oligonucleotides in Na+ form resuspended in water were transferred to centrifugal units, spun down to concentrate, and exposed to 100 mM Ca2+ and/or Mg2+ solution. Following exposure to 100 mM Ca2+ and/or Mg2+, the oligonucleotides were washed with water three times to remove any excess divalent cations in the solution. Oligonucleotides treated were then run through ion chromatography, and the cations of interest in the solution were quantified. The levels of each cation of interest were detected in real time, and the data acquired were used to calculate the ratios in the table below. (B) The chemical structures of di-siRNAs analyzed using ion chromatography; previously described di-siRNAHTT, a di-siRNAHTT with no PS modifications, and a blunt di-siRNAHTT containing 10 more PS/PO backbones than di-siRNAHTT. Representative chromatograph traces for di-siRNAHTT washed with 100 mM Mg2+ (C), 100 mM Ca2+ (D), or 100 mM Ca2+ and Mg2+ (E). (F) Table outlining the calculated ratios of oligonucleotide to cations derived from the ion chromatography experiments.
Figure 4
Figure 4
The acute neurotoxicity is preventable by adding Ca2+ and Mg2+ to aCSF buffer (A) The chemical structure of di-siRNAHTT used throughout this figure. (B) Timeline showing the surgical procedure and recovery period for wild-type mice injected bilateral i.c.v. with oligonucleotides under isoflurane anesthesia. (C) Acute tolerability scores of wild-type mice injected with 1 mM (225 μg/10 μL total) di-siRNAHTT in aCSF with incrementally increased calcium concentrations. Increasing the Ca2+ concentration in aCSF buffer decreased the severity of adverse events in a dose-dependent manner. Each data point represents one mouse (n = 4–6). ∗∗p = 0.0018, ∗∗∗p = 0.0001, ∗∗∗∗p < 0.0001; data were analyzed using one-way ANOVA followed by Tukey’s post hoc test. (D) Acute tolerability scores of wild-type mice injected with 1 mM (225 μg/10 μL total) di-siRNAHTT in aCSF with incrementally increased Mg2+ concentration. Increasing the Mg2+ concentration in aCSF buffer significantly reduced the severity of adverse events in a dose-dependent manner. An excess of Mg2+ in aCSF increased hyperactivity in mice during recovery. Each data point represents one mouse (n = 4–5). ∗∗p = 0.0074, ∗∗p = 0.0038, ∗∗∗∗p = 0 < 0.0001; data were analyzed using one-way ANOVA followed by Tukey’s post hoc test. (E) Acute tolerability scores of mice injected with 1 mM (225 μg/10 μL total) di-siRNAHTT in a range of aCSF buffers with incrementally increased Mg2+ concentration and reduced Ca2+ concentration. All seven aCSF formulations were significantly better tolerated than aCSF with no Ca2+ or Mg2+ (∗∗∗∗p < 0.0001). Decreasing the Ca2+ in aCSF to 11 or 10 mM with increased Mg2+ induced more severe adverse events (∗∗∗p = 0.0003, ∗∗∗∗p < 0.0001). Each data point represents one mouse (n = 4–5); data were analyzed using one-way ANOVA followed by Tukey’s post hoc test. (F) Timeline showing i.c.v. injection procedure and EEG/EMG recording for wild-type mice injected i.c.v. bilaterally with oligonucleotides awake (created with BioRender.com). (G) Table outlining the number of wild-type mice with seizure responses recorded by EEG/EMG following i.c.v. injections of 0 mM (vehicle control) or 1 mM (225 μg) di-siRNAHTT in 10 μL 1× PBS or aCSF+ (n = 2–6 per treatment).
Figure 5
Figure 5
Di-siRNAHTT formulated in aCSF+ maintains its distribution, efficacy, and safety in mouse brain (A) Huntingtin (Htt) mRNA levels in the frontal cortex (FC), striatum (S), medial cortex (MC), thalamus (T), and hippocampus (H) were measured by Quantigen SinglePlex Assay. There was significant lowering in all brain regions 2 months following i.c.v. injection of 1 mM di-siRNAHTT in aCSF+. (B) Mouse huntingtin protein (HTT) expression was measured by ProteinSimple Wes in the FC, S, MC, T, and H. Di-siRNAHTT formulated in aCSF+ significantly reduced HTT expression in all brain regions evaluated 2 months following i.c.v. injection compared with aCSF controls. (C) GFAP mRNA levels in the FC, S, MC, T, and H were measured by Quantigen SinglePlex Assay. There was no change in GFAP mRNA levels in mice injected with 1 mM di-siRNAHTT in aCSF+ compared with aCSF controls. Each data point represents one mouse (n = 6), and error bars represent mean values SEM. ∗∗∗∗p < 0.0001; data were analyzed using two-way ANOVA with Bonferroni’s multiple comparisons test.
Figure 6
Figure 6
The new aCSF+ formulation is safe at multiple doses when the ratio of di-siRNA to divalent cations is consistent, with structure and backbone modifications having minimal impact on neurotoxicity (A) The chemical structure of di-siRNAHTT used throughout this figure. (B) Timeline showing the surgical procedure and recovery period for wild-type mice injected i.c.v. bilaterally with oligonucleotides under isoflurane anesthesia (created with BioRender.com). (C) Acute tolerability scores following i.c.v. injection of 1 mM (225 μg/10 μL total) and 2 mM (450 μg/10 μL total) di-siRNAHTT in aCSF+ with different concentrations of Ca2+ and Mg2+. There was no difference in tolerability in mice injected with 1 mM di-siRNAHTT in aCSF with either 16 mM Ca2+ or 14 mM Ca2+ and 2 mM Mg2+. Injecting mice with 2 mM di-siRNAHTT in aCSF with 16 mM Ca2+ was not well tolerated compared with 1 mM di-siRNAHTT or aCSF controls (∗∗∗∗p < 0.0001). Injecting 2 mM di-siRNAHTT in aCSF with 32 mM Ca2+ was better tolerated, but still significantly worse than vehicle controls (∗∗∗p = 0.0002). Maintaining the same ratio of di-siRNAHTT and divalent cations in aCSF+ significantly improved the acute tolerability (∗∗∗∗p < 0.0001) and there was no difference compared with aCSF controls. (D) The chemical structures of siRNA oligonucleotides used in this figure: the previously described di-siRNAHTT with PS modifications, di-siRNAHTT (NPS) with 0 PS modifications, a monovalent siRNAHTT, and a blunt di-siRNAHTT. (E) Acute tolerability scores following i.c.v. administration of the four different siRNAs in 1× PBS or aCSF+. The di-siRNAHTT (NPS) was slightly better tolerated (∗∗p = 0.0011) than the di-siRNAHTT, siRNAHTT, and blunt di-siRNAHTT (∗∗∗∗p < 0.0001), with 1 mM (225 μg/10 μL total) compared with the 1× PBS controls. Formulating the different siRNAs in aCSF+ significantly improved the acute tolerability (∗∗p = 0.0019, ∗∗∗∗p < 0.0001). There was no significant difference in the tolerability between the four di-siRNAHTT scaffolds injected in aCSF+ compared with the 1× PBS controls. Each data point represents one mouse (n = 2–6) with SEM. Data were analyzed using one-way ANOVA followed by Tukey’s post hoc test.
Figure 7
Figure 7
aCSF+ enables safe delivery for full PS and mixed PO/PS backbone ASOs (A) Timeline showing the surgical procedure and recovery period for wild-type mice injected i.c.v. bilaterally with oligonucleotides under isoflurane anesthesia (created with BioRender.com). (B) The chemical structures of the full PS ASO and mixed PO/PS ASO (Tominersen1) used in this figure. (C) Acute tolerability scores following i.c.v. injections of 225 μg/10 μL full PS ASOHTT in 1× PBS or aCSF+ buffers. i.c.v. injections of the full PS ASO produced significant acute neurotoxicity compared with 1× PBS controls (∗∗∗p < 0.0001). Formulating ASO in two different aCSF+ buffers significantly improved the acute tolerability in a dose-dependent manner compared with 1× PBS controls (∗p = 0.0417 and n.s.). The 14:2 aCSF+ significantly improved the acute tolerability score compared with ASO in 1× PBS (∗∗∗p = 0.0008). Each data point represents one mouse (n = 4–6) with SEM; data were analyzed using one-way ANOVA followed by Tukey’s post hoc test. (D) Acute tolerability scores following i.c.v. injections of 225 μg/10 μL dose of mixed PO/PS ASO in 1× PBS or aCSF+ buffers. i.c.v. injections of the mixed PO/PS ASO produced significant acute neurotoxicity compared with 1× PBS controls (∗∗∗∗p < 0.0001). Formulating the mixed PO/PS ASO in two different aCSF+ buffers significantly improved the acute tolerability (∗∗∗p = 0.0003 and ∗∗∗p = 0.0002). There was no difference in tolerability between the ASO in both aCSF+ buffers and the 1× PBS controls. Each data point represents one mouse (n = 2–6) with SEM; data were analyzed using one-way ANOVA followed by Tukey’s post hoc test.
Figure 8
Figure 8
The use of aCSF+ mitigates acute neurotoxicity of di-siRNAHTT in Huntington’s mouse models of disease (A) The chemical structure of di-siRNAHTT used throughout this figure. (B) Timeline showing the i.c.v. injection procedure and recovery period for mice injected with oligonucleotides under isoflurane anesthesia (created with BioRender.com). (C and D) Schematics depicting the mouse models used in this figure, YAC128-HD and BAC-CAG-HD. Both models carry two copies of wild-type mouse huntingtin (Htt) (black) and either a YAC (pink) or BAC (purple) transgenic insert containing human mutant Htt (created with BioRender.com). (E and F) i.c.v. administration of 1 mM (225 μg/10 μL total) di-siRNAHTT formulated in 1× PBS elicited seizures in YAC128-HD and BACCAG-HD mouse models. (E) The acute tolerability was significantly increased in YAC128-HD mice following i.c.v. administration of 1 mM (225 μg/10 μL total) di-siRNAHTT formulated in aCSF+. Each data point represents one mouse (n = 6). ∗∗∗∗p < 0.0001; data were analyzed using an unpaired t test. (F) The acute tolerability was significantly reduced in BACCAG-HD mice following i.c.v. administration of 1 mM di-siRNAHTT formulated in aCSF+. Each data point represents one mouse (n = 6). ∗∗∗∗p < 0.0001; data were analyzed using an unpaired t test. (G and H) Wild-type mouse HTT and human mutant HTT (I and J) protein levels in di-siRNAHTT-treated mice measured by ProteinSimple Wes. One month following injections, there was a significant lowering of wild-type and mutant HTT protein across all brain regions measured versus the non-injected control groups in YAC128-HD (G and I) and BAC-CAG HD (H and J) mice. Each data point represents one mouse, and the error bars represent the mean values of SEM (n = 6). ∗∗∗∗p < 0.000; data were analyzed using two-way ANOVA with Tukey’s multiple comparisons test.

Update of

References

    1. Egli M., Manoharan M. Chemistry, structure and function of approved oligonucleotide therapeutics. Nucleic Acids Res. 2023;51:2529–2573. doi: 10.1093/nar/gkad067. - DOI - PMC - PubMed
    1. Kuter D.J., Bonkovsky H.L., Monroy S., Ross G., Guillén-Navarro E., Cappellini M.D., Minder A.E., Hother-Nielsen O., Ventura P., Jia G., et al. Efficacy and safety of givosiran for acute hepatic porphyria: Final results of the randomized phase III ENVISION trial. J. Hepatol. 2023;79:1150–1158. doi: 10.1016/j.jhep.2023.06.013. - DOI - PubMed
    1. Finkel R.S., Mercuri E., Darras B.T., Connolly A.M., Kuntz N.L., Kirschner J., Chiriboga C.A., Saito K., Servais L., Tizzano E., et al. Nusinersen versus Sham Control in Infantile-Onset Spinal Muscular Atrophy. N. Engl. J. Med. 2017;377:1723–1732. doi: 10.1056/NEJMoa1702752. - DOI - PubMed
    1. van Roon-Mom W., Ferguson C., Aartsma-Rus A. From Failure to Meet the Clinical Endpoint to U.S. Food and Drug Administration Approval: 15th Antisense Oligonucleotide Therapy Approved Qalsody (Tofersen) for Treatment of SOD1 Mutated Amyotrophic Lateral Sclerosis. Nucleic Acid Therapeut. 2023;33:234–237. doi: 10.1089/nat.2023.0027. - DOI - PubMed
    1. Miller T.M., Cudkowicz M.E., Genge A., Shaw P.J., Sobue G., Bucelli R.C., Chiò A., Van Damme P., Ludolph A.C., Glass J.D., et al. Trial of Antisense Oligonucleotide Tofersen for SOD1 ALS. N. Engl. J. Med. 2022;387:1099–1110. doi: 10.1056/NEJMoa2204705. - DOI - PubMed