. 2024 Oct;18(5):2637-2658.
doi: 10.1007/s11571-024-10107-y. Epub 2024 May 3.

Involvement of prelimbic cortex neurons and related circuits in the acquisition of a cooperative learning by pairs of rats

Affiliations

Involvement of prelimbic cortex neurons and related circuits in the acquisition of a cooperative learning by pairs of rats

A R Conde-Moro et al. Cogn Neurodyn. 2024 Oct.

Abstract

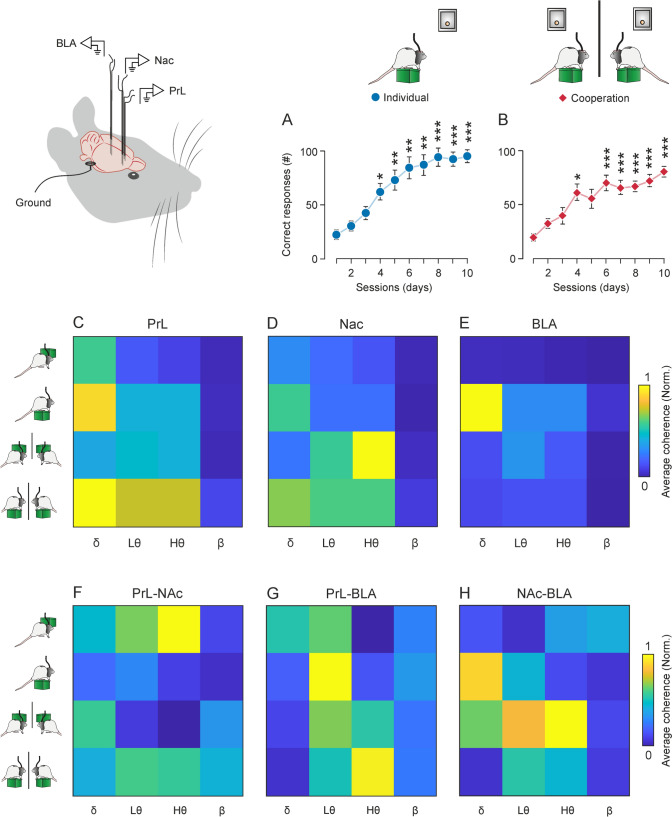
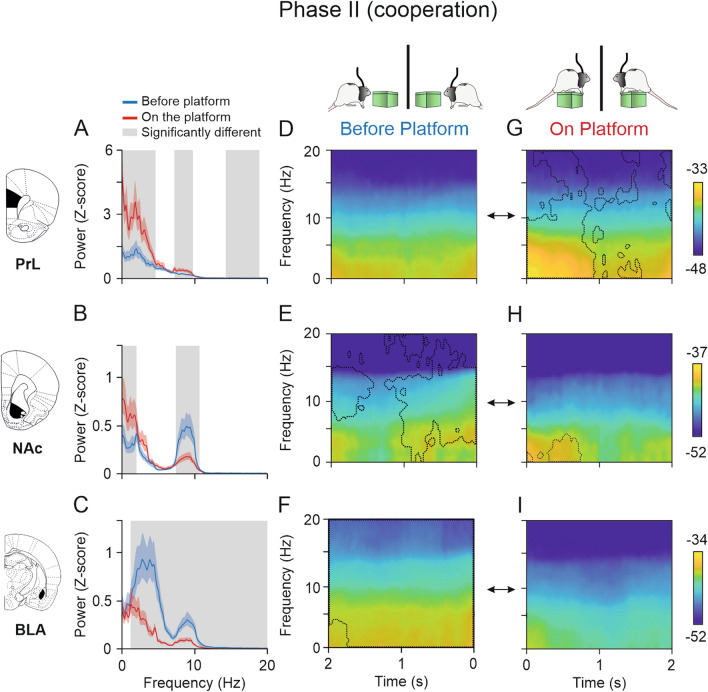
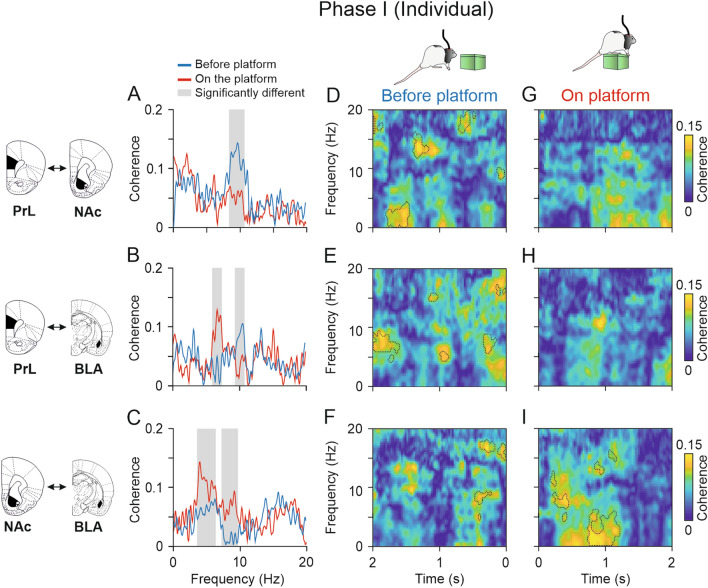
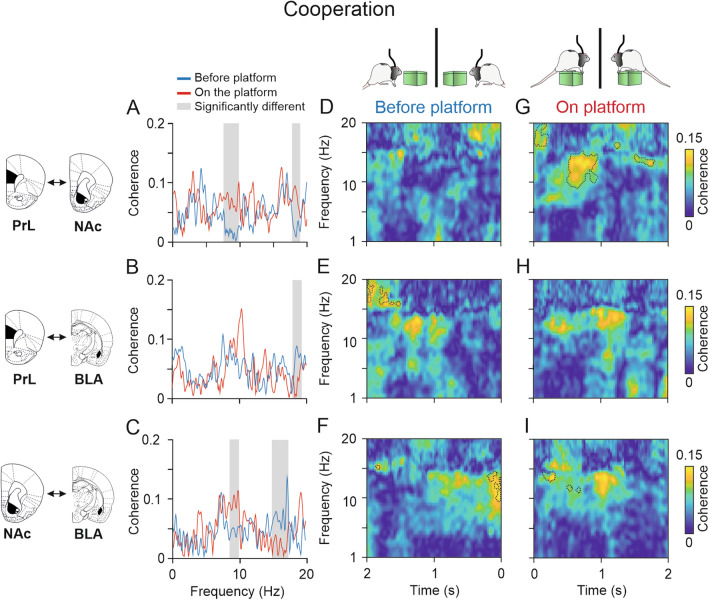
Social behaviors such as cooperation are crucial for mammals. A deeper knowledge of the neuronal mechanisms underlying cooperation can be beneficial for people suffering from pathologies with impaired social behavior. Our aim was to study the brain activity when two animals synchronize their behavior to obtain a mutual reinforcement. In a previous work, we showed that the activity of the prelimbic cortex (PrL) was enhanced during cooperation in rats, especially in the ones leading most cooperative trials (leader rats). In this study, we investigated the specific cells in the PrL contributing to cooperative behaviors. To this end, we collected rats' brains at key moments of the learning process to analyze the levels of c-FOS expression in the main cellular groups of the PrL. Leader rats showed increased c-FOS activity in cells expressing D1 receptors during cooperation. Besides, we analyzed the levels of anxiety, dominance, and locomotor behavior, finding that leader rats are in general less anxious and less dominant than followers. We also recorded local field potentials (LFPs) from the PrL, the nucleus accumbens septi (NAc), and the basolateral amygdala (BLA). A spectral analysis showed that delta activity in PrL and NAc increased when rats cooperated, while BLA activity in delta and theta bands decreased considerably during cooperation. The PrL and NAc also increased their connectivity in the high theta band during cooperation. Thus, the present work identifies the specific PrL cell types engaged in this behavior, as well as the way this information is propagated to selected downstream brain regions (BLA, NAc).

Supplementary information: The online version contains supplementary material available at 10.1007/s11571-024-10107-y.

Keywords: Basolateral amygdala; C-Fos; Cooperative behavior; D1; D2 receptors; Local field potential; Nucleus accumbens septi; Operant conditioning; Prelimbic cortex.


Conflict of interest statement

Competing interestAuthors declare no competing interests in relation to this work.

Figures

Fig. 1
Fig. 1
Apparatus and cooperative test. A, A diagram representing the content of each Skinner module. Each module was equipped with a food dispenser, where reinforcements were delivered, and a green platform equipped with infrared lights that detected the rat. B, A diagram representing the experimental setting for the cooperation experiments, where pairs of rats were placed in the double Skinner box for the two phases of the experiment. A metallic grille, that allowed partial physical contact, separated the two Skinner modules. C, Cooperative test. In phase I, animals were trained to individually climb onto a platform and stay on it for > 500 ms to get a food pellet in a fixed ratio (1:1) schedule. D, In phase II, animals were trained to climb onto the platforms and to stay on them simultaneously for > 500 ms to get a food pellet for each of them. Training sessions lasted for 20 min. The number of experimental sessions is indicated in gray below the diagrams
Fig. 2
Fig. 2
Immunofluorescence procedure and cooperation performance. A, Immunofluorescence procedure. Animals were randomly allocated into 4 groups: control group (blue), group 1 (purple), group 2 (pink), and group 3 (dark red). All animals underwent a battery of behavioral tests before the cooperation experiment: open field test (OFT), elevated plus maze (EPM), water competition test (WCT), and food competition test (FCT). After that, groups 1, 2, and 3 started the cooperation experiment. Animals in the control group remained in their home cages during the cooperation experiment and were handled and weighed daily as the remaining animals. Animals from groups 1–3 were anesthetized and perfused after reaching the established criteria (indicated by syringe icons in the image), while animals from the control group were sacrificed in a scattered way, distributed along with the perfusion of the other groups (see methods). All brains were cryoprotected, and coronal sections of the PrL cortex were labeled for c-FOS, DAPI, and selected antibodies against GABAergic and dopaminergic neurons (D1- and D2-containing cells). B–F, Cumulative records showing the acquisition curves for individual and cooperative phases. All groups except the control performed the cooperation experiment. B, Group 1 learned to individually climb and sit on the platform to get a pellet of food, showing a steep slope between the third and the last day of training: average ± SD slope for group 1, 76.801 ± 22.46. The cumulative line stops at the day that rats reached the criterion and were euthanized and perfused. C, D, Groups 2 and 3 performed the individual phase completely and all the animals reached the criterion, showing a steep slope from day 3 to 10 (group 2, slope = 77.03 ± 26.01; and group 3, slope = 94.24 ± 27.45). E, F, After learning the individual task, groups 2 and 3 were placed again in the double Skinner box for phase II (cooperative). This time, they had to coordinate their behavior (climbing and staying together on the platform for > 500 ms) to get a pellet of food. All rats learned the task successfully, showing a steep slope from session 3 to their last session (group 2, slope = 87.82 ± 17.31; group 3, slope = 82.45 ± 14.04)
Fig. 3
Fig. 3
Leader/follower, anxiety and social dominance. A-C, Leader/follower strategy to cooperate. A, Average number of platform climbs during Phase II (cooperation) of leaders (in green) and follower rats (in purple). Leader rats climbed significantly more times onto the platform than follower rats (One-way ANOVA, F = 18.00, p < 0.001). B, Average number of times that leader and follower rats climbed in first place onto the platform during the cooperative phase. Leader rats climbed significantly more times in first place (One-way ANOVA, F = 14.40, p = 0.002), initiating the cooperation trials more times. C, Average number of wrong trials for leader and follower rats. Although there is a tendency for leader rats to make fewer wrong responses, there were no significant differences between them (One-way ANOVA, F = 1.073, p = 0.318). D–E, Anxiety levels (groups 2 and 3). D, Average time (percentage) spent in the open arms of the elevated plus maze (EPM). Leader rats spent significantly more time than followers in open arms (One-way ANOVA, F = 6.71, p = 0.02), which indicates lower levels of anxiety. E, Latency to enter any of the open arms (in seconds) for leader and follower rats. No significant differences were found between leaders and followers in this case (One-way ANOVA on ranks, H = 0.24, p = 0.62). F, Percentage of leader and follower rats that fell into the three categories of anxiety established: low-anxious (LA, more than 20% of the time spent in the open arms of the EPM), medium-anxious (MA, between 5 and 20% of the time in open arms), and high-anxious (HA, less than 5% of the time in open arms). Most leader rats were classified as low-anxious (66%), while most follower rats were classified as intermediate-anxious (61%). G–H, Social dominance (groups 2 and 3). G, Percentage of time drinking water during the water competition test. Leaders and followers spent a similar percentage of time drinking water (One-way ANOVA, F = 0.18, p = 0.67). H, Percentage of food pellets eaten during the food competition test. Follower rats ate a significantly higher percentage of food pellets than leaders (One-way ANOVA, F = 8.69, p = 0.01). I, Social dominance index, based on the percentage of time drinking water, the percentage of food pellets eaten, and the number of aggressions and successful displacements from the water bottle or feeder. Follower rats showed a significantly higher level of social dominance (One-way ANOVA, F = 5.29, p = 0.03) than leader rats during these tests
Fig. 4
Fig. 4
c-FOS expression in PrL D1- and D2-containing cells of cooperation groups (groups 2 and 3). A, C, Coronal brain sections from animals in groups 2 and 3 labeled for c-FOS (red channel), DAPI (blue channel), and the selected antibodies against the main cell types of the PrL. Goat anti-Substance P for staining D1-containing cells (green channel) and rabbit anti-Enkephalin for staining D2-containing cells (gray channel). The photomicrographs corresponding to Group 2, in which rats were trained to cooperate until reaching the criterion for the cooperation phase, are shown in A, and the photomicrographs in C correspond to group 3, which performed the whole cooperative phase (10 sessions). B, D, Percentage of c-FOS activation in each group. B, D1-containing cells were significantly more active in leaders than in followers during the cooperation phase (One-way ANOVA, F = 16.95, p = 0.007). The activation of D2-containing cells was lower than that of D1 cells, and the highest activation was also observed in the leader rats from group 2. However, the difference between leaders and followers was not significant (One-way ANOVA, F = 1.63, p = 0.24). D, Leader rats from group 3 (C), which completed the 10 days of the task, also showed higher activation for D1 and D2 cells, but the difference was not significant (One-way ANOVA, F = 1.44, p = 0.29)
Fig. 5
Fig. 5
Cooperative task learning and general spectral power and coherence. A–B. Characteristics of the acquisition curves during the cooperation experiment. A, Phase I: Individual platform training. Rats (n = 10) were trained to individually climb onto a platform to obtain a pellet of food at a fixed (1:1) ratio. Rats were trained for up to 10 sessions. Compared with session 1, the number of correct responses increased significantly from session 4 on (RM-One-way ANOVA, S04, p < 0.05; S05, S06, S07, p < 0.01), showing an even greater increase in the last three sessions (RM-One-way ANOVA, S08, S09, S10, p < 0.001). B, Phase II: Cooperative training. Rats had to climb onto their respective platform and stay on it simultaneously for > 0.5 s to mutually get a reward. Rats were trained for up to 10 sessions. Compared with session 1, the number of cooperation trials also increased significantly in session 4 (RM-One-way ANOVA, S04, p < 0.01), and from sessions 6 to 10 (RM-One-way ANOVA, S06–S10, p < 0.001). C-E, Visual summary of results found in LFP analysis from the 3 recording sites during both conditions and phases. C, Mean spectral power per band of LFPs in PrL cortex BEFORE- and ON-platform during individual and cooperative phases. Note the highest spectral power was found for the delta band ON-platform during cooperation and ON-platform individually, although at a lower level. The theta band also presented high values during cooperation ON-platform. D, Same as in C for the NAc. Note that the highest spectral powers were found in high theta band BEFORE-platform and in delta ON-platform for the cooperative phase. E, Same as in C for the BLA. Note that the highest spectral power values were found in delta and theta bands when rats were individually ON-platform. F–H, Visual summary of results found in coherence analysis between the three recording sites during both conditions and phases. F, Mean coherence per band between LFPs recorded in PrL cortex and NAc, BEFORE- and ON-platform during individual and cooperative phases. Note the highest coherence values were found in the theta band BEFORE-platform during the individual phase and theta bands ON-platform during cooperation. Delta also showed high values before rats climbed onto the platform to cooperate. G, Same as in F for the PrL-BLA. Note that the highest coherence values were found in the low theta band when rats were individually ON-platform and in high theta when rats were cooperating ON-platform. H, Same as in F for NAc-BLA. Note that the highest coherence values were found in delta and theta bands BEFORE-platform. Delta also showed high coherence when rats were individually ON-platform
Fig. 6
Fig. 6
Spectral powers and multitaper spectrograms of LFPs recorded in the PrL cortex, and NAc and BLA areas during Phase I (individual). A-C, Spectral analysis for LFPs of 2-s epochs (NT = 70 per condition) acquired from five pairs of rats (n = 10) when they were individually ON-platform (red) compared with 2 s BEFORE-platform (blue). The lines represent the averaged spectrum of trials for each condition and the colored shaded areas the jackknife error bars. The gray shaded areas indicate the frequency ranges where the average spectral powers for each condition were significantly different. The spectral power in the delta band was significantly higher BEFORE-platform than ON-platform in the three areas for the lower frequencies. During the individual phase, the spectral power in the PrL cortex showed significantly higher power values in the theta band BEFORE-platform, while the NAc and BLA showed significantly higher spectral power in the high theta and beta bands. DI, Multitaper spectrograms of the same epochs analyzed in AC showing dynamic changes in LFP activities in the PrL cortex, NAc, and BLA areas 2 s BEFORE- DF and 2 s ON-platform GI. Comparison of spectrograms for the two situations (BEFORE- and ON-). The dashed lines indicate the areas in which each spectrogram was significantly higher than the other (jackknife estimates of the variance, p < 0.05). In the PrL cortex D, G, the spectral power of the theta band was significantly higher 1 s BEFORE-platform. ON-platform there were significantly higher power values for the beta band along second 1, and high theta and beta at the end of second 2. In the NAc E, H, the spectral power BEFORE-platform was significantly higher than ON-platform, especially in the delta and low theta bands 2 s BEFORE-platform and high theta and beta 1.5 s BEFORE- the climbing onto the platform
Fig. 7
Fig. 7
Spectral powers and multitaper spectrograms of LFPs recorded in the PrL cortex, and NAc and BLA areas during Phase II (cooperative). A–C, Same configuration as Fig. 6 but for the cooperative phase. The spectral power in the delta band was significantly higher BEFORE-platform than ON-platform in the three areas for the lower frequencies. Note that spectral power of the PrL cortex A was significantly higher when the rats were ON-platform in the delta, theta, and beta bands, while the spectral power observed in the NAc B was significantly higher in the delta band when rats were ON-platform, and higher in the theta band BEFORE-platform. The activity of the BLA C decreased significantly as rats climbed onto the platform, being significantly higher in all the frequency bands before the rats climbed onto the platform. D–I, Multitaper spectrograms of the same epochs analyzed in AC showing dynamic changes in LFP activities in the PrL cortex, and NAc and BLA areas in the moments BEFORE- DF and ON-platform GI. The spectrograms for the two situations, BEFORE- and ON-, were compared, and the dashed lines indicate the areas in which each spectrogram was significantly higher than the other (jackknife estimates of the variance, p < 0.05). The spectrograms indicated highest activity of delta and theta bands occurred within the first second ON-platform in the PrL cortex D, G. In the NAc E, H, the spectral power BEFORE-platform was significantly higher than ON-platform across almost the whole time window, while the activity in the delta band was higher within the first second ON-platform. In the BLA E, H, the spectrograms showed higher power BEFORE- than ON-platform for almost the whole time window
Fig. 8
Fig. 8
Functional connectivity between LFPs from electrodes located in different brain structures during Phase I (individual). A-C, Spectral coherence between PrL-NAc A, PrL-BLA B, and NAc-BLA C when rats were ON-platform (red) compared with 2 s BEFORE-platform (blue). The gray shaded areas indicate the frequency ranges where the average spectral powers for each condition were significantly different. D–I, time–frequency coherograms of the structures analyzed in AC showing dynamic changes in phase coherence (jackknife estimates of the variance, p < 0.05) between PrL-NAc, PrL-BLA, and NAc-BLA in the moments BEFORE- DF and ON-platform GI. The coherograms for the two situations, BEFORE- and ON-, were compared, and the dashed lines indicate the areas in which each coherogram was significantly higher than the other (jackknife estimates of the variance, p < 0.05). Note that the coherence magnitude between PrL and NAc was higher BEFORE-platform than ON-platform in the theta and delta bands (jackknife estimates of the variance, p < 0.05). The coherence between PRL and BLA was higher in the low theta band when rats were ON-platform (jackknife estimates of the variance, p < 0.05), particularly 1 s after climbing, and in the high theta band 2 s and 500 ms BEFORE-platform. The coherence between NAc and BLA was significantly higher ON-platform (jackknife estimates of the variance, p < 0.05) and significantly higher in the delta and theta bands, particularly around 1 s after the climbing onto the platform
Fig. 9
Fig. 9
Functional connectivity between LFPs from electrodes located in different brain structures during Phase II (cooperative). A-C, Spectral coherence between PrL-NAc A, PrL-BLA B, and NAc-BLA C when rats were ON-platform (red) compared with 2 s BEFORE-platform (blue). The gray shaded areas indicate the frequency ranges where the average spectral powers for each condition were significantly different. D–I, time–frequency coherograms of the structures analyzed in AC showing dynamic changes in phase coherence between PrL-NAc, PrL-BLA, and NAc-BLA in the moments BEFORE- D-F and ON-platform GI. The coherograms for the two situations, BEFORE- and ON-, were compared, and the dashed lines indicate the areas in which each coherogram was significantly higher than the other (jackknife estimates of the variance, p < 0.05). Note that the coherence magnitude between PrL and NAc was significantly higher ON-platform than BEFORE-platform in the theta and beta bands (jackknife estimates of the variance, p < 0.05). Note the significantly higher coherence cluster 0.5–1 s after rats climbed ON-platform at 10–15 Hz in the coherogram G. The coherence between the NAc and the BLA was significantly higher when rats were cooperating ON-platform at 8–10 Hz and significantly higher BEFORE-platform at 15–17 Hz (jackknife estimates of the variance, p < 0.05)

References

    1. Adolphs R (2010) What does the amygdala contribute to social cognition? Ann N Y Acad Sci 1191:42–61. 10.1111/j.1749-6632.2010.05445.x - PMC - PubMed
    1. Bartal IB-A, Decety J, Mason P (2011) Empathy and pro-social behavior in rats. Science 334:1427–1430. 10.1126/science.1210789 - PMC - PubMed
    1. Ben-Ami Bartal I, Breton JM, Sheng H, Long KL, Chen S, Halliday A, Kenney JW, Wheeler AL, Frankland P, Shilyansky C, Deisseroth K, Keltner D, Kaufer D (2021) Neural correlates of ingroup bias for prosociality in rats. Elife 10:e65582. 10.7554/eLife.65582 - PMC - PubMed
    1. Bertocchi I, Rocha-Almeida F, Romero-Barragán MT, Cambiaghi M, Carretero-Guillén A, Botta P, Dogbevia GK, Treviño M, Mele P, Oberto A, Larkum ME, Gruart A, Sprengel R, Delgado-García JM, Hasan MT (2023) Pre- and postsynaptic N-methyl-d-aspartate receptors are required for sequential printing of fear memory engrams. Iscience 26(11):108050. 10.1016/j.isci.2023.108050 - PMC - PubMed
    1. Bickart KC, Dickerson BC, Barrett LF (2014) The amygdala as a hub in brain networks that support social life. Neuropsychologia 63:235–248. 10.1016/j.neuropsychologia.2014.08.013 - PMC - PubMed

LinkOut - more resources