. 2025 Mar 7;27(3):811-827.
doi: 10.1093/neuonc/noae228.

Alternative lengthening of telomere-based immortalization renders H3G34R-mutant diffuse hemispheric glioma hypersensitive to PARP inhibitor combination regimens

Affiliations

Alternative lengthening of telomere-based immortalization renders H3G34R-mutant diffuse hemispheric glioma hypersensitive to PARP inhibitor combination regimens

Anna Laemmerer et al. Neuro Oncol. .

Abstract

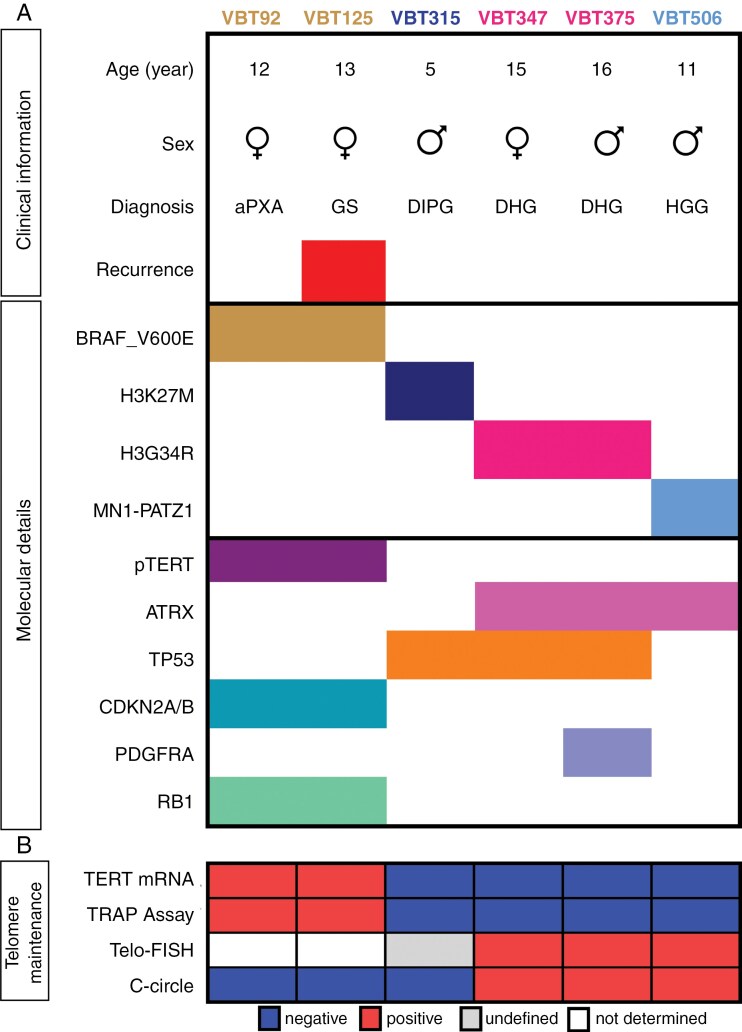
Background: Diffuse hemispheric glioma, H3 G34R/V-mutant (DHG-H3G34) is characterized by poor prognosis and lack of effective treatment options. DHG-H3G34R further harbor deactivation of alpha-thalassemia/mental retardation syndrome X-linked protein (ATRX; DHG-H3G34R_ATRX) suggesting a unique interaction of these 2 oncogenic alterations. In this study, we dissect their cell biological interplay, investigate the impact on telomere stabilization, and consequently validate a targeted therapy approach.

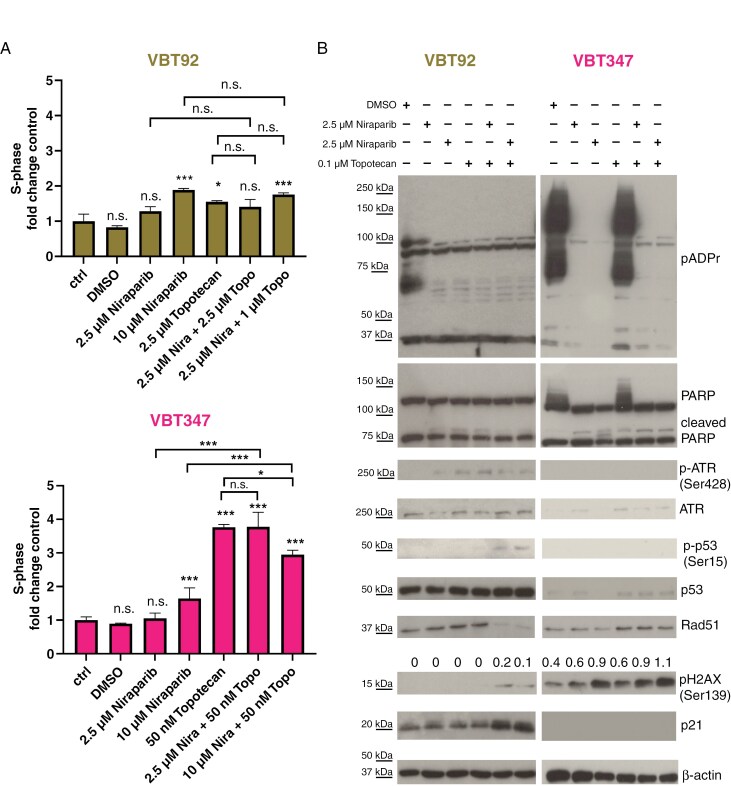
Methods: We characterized patient-derived primary pediatric high-grade glioma (pHGG) models for telomere-maintenance mechanisms, DNA damage stress (including protein expression, pH2AX/Rad51 foci, cell-cycle arrest) and their sensitivity towards poly-ADP ribose polymerase inhibitor (PARPi) combinations. Human induced pluripotent stem cells (iPSCs) were used for modeling the disease. The anticancer activity of PARPi combinations in vivo was studied in Chorioallantoic Membrane (CAM) and orthotopic in vivo experiments. Finally, we treated a DHG-H3G34R_ATRX patient with PARPi combination therapy.

Results: We elaborate that alternative lengthening of telomeres (ALT) is a key characteristic of DHG-H3G34R_ATRX. A dominant cooperative effect between H3G34R and ATRX loss in ALT activation also became apparent in iPSCs, which endogenously exert telomerase activity. In both, patient-derived DHG-H3G34R_ATRX models and H3G34R+/ATRX- iPSCs, the ALT-phenotype was associated with increased basal DNA damage stress, mediating synergistic susceptibility towards PARPi (talazoparib, niraparib) combinations with topoisomerase-I inhibitors (topotecan, irinotecan). In a first-of-its-kind case, treatment of a DHG-H3G34R_ATRX patient with the brain-penetrant PARP inhibitor niraparib and topotecan resulted in significant tumor reduction.

Conclusions: Our preclinical and clinical data strongly support the further development of PARPi together with DNA damage stress-inducing treatment regimens for DHG-H3G34R_ATRX.

Keywords: ATRX; DNA damage; H3G34R; PARP inhibitor; diffuse hemispheric glioma.


Conflict of interest statement

A.L. is consultant and advisory board member for CCIE (not relevant to this study). A.A. is consultant and advisory board participant for Novartis (not relevant to this study). F.E. is advisory board participant for Servier and received honoraria from Dr. Sennewald Medizintechnik (not relevant to this study). S.M.P is consultant for Epignostix GbmH and BioSkryb (not relevant to this study). W.B. received honoraria from BMS, Novartis, and Roche (not relevant to this study). J.G. is consultant, advisory board participant and received honoraria for Novartis and Roche (not relevant to this study).

Figures

Graphical Abstract
Graphical Abstract
Figure 1.
Figure 1.
ATRX-mutated models are associated with ALT-phenotype. (A) Overview of the patient-derived pHGG cell line panel providing clinical information and molecular details. Mutations: BRAF_V600E, H3K27M, H3G34R, TERT promoter (pTERT), ATRX, TP53, PDGFRA, RB1. Fusion: MN1::PATZ1. Chromosomal loss: CDKN2A. aPXA: anaplastic pleomorphic xanthoastrocytoma, GS: gliosarcoma, DIPG: diffuse intrinsic pontine glioma, DHG: diffuse hemispheric glioma, HGG: high-grade glioma. (B) Overview of the telomere-maintenance mechanisms examined in the indicated patient-derived pHGG cell models. Results from the following assays are depicted: TERT mRNA levels analyzed by quantitative real-time PCR (TERT mRNA), telomerase activity measured with TRAP-assay, and presence of ALT assessed with Telo-FISH and c-circle assay.
Figure 2.
Figure 2.
ALT parameters and DNA repair perturbations are observed in H3G34R_ATRX primary patient-derived and human iPSC models. (A) Mean mRNA expression of TERT in patient-derived pHGG cell models (n = 2 biological repeats in triplicate). The mesothelioma cell line Meso92 (Pirker, Bilecz, et al. 2020) was used as a positive control. Differences in TERT mRNA levels between TERT-positive (upper circle) and TERT-negative (lower circle) pHGG models were quantified by unpaired student’s t-test with two-tailed distribution (**P < .01). (B) Results of the TRAP-assay are presented as telomerase product generated (TPG) units (n = 2 biological repeats). Differences in telomerase activity between TERT-positive (upper circle) and TERT-negative (lower circle) pHGG models were quantified by unpaired student’s t-test with a two-tailed distribution (**P < .01). (C) Bar graph showing relative c-circle levels of patient-derived pHGG cell lines (n = 2 biological repeats in triplicate). ALT-specific telomeric c-circle content was determined by qPCR following rolling circle amplification with or without Phi polymerase and quantified relative to U2OS (ALT-positive osteosarcoma cell line). Significant differences between ALT-positive (green circle) and ALT-negative (red circle) pHGG models were evaluated by One-way ANOVA with Bonferroni post-test. *P < .05. (D) Box plot showing relative c-circle levels of iPSCs. Telomeric c-circle content was determined as described in (C; n = 2 biological repeats in triplicate). Significance levels were evaluated by unpaired student’s t-test with a two-tailed distribution. *P < .05. (E) Western blot analyses showing phosphorylation of the DNA damage marker H2AX in the patient-derived pHGG cell line panel (upper panels) and iPSCs (lower panels). β-actin served as a loading control. (F) Immunohistochemical staining of pH2AX and Rad51 in tissue sections of one BRAF_V600E and pTERT co-mutated aPXA tumor (matching cell model VBT92) and 2 DHG-H3G34R_ATRX tumors (matching cell models VBT347 and VBT375). The red arrow marks necrosis and the white arrows indicate single pH2AX-positive nuclei in the second DHG-H3G34R_ATRX tumor (VBT375). Scale bar = 20 µm.
Figure 3.
Figure 3.
Specific synergistic activity of PARPi combination therapies in H3G34R_ATRX patient-derived cell and iPSC models. (A) Schematic representation of a circular synergy dot-plot showing mean combination indices (CI) values. The small inner circle depicts synergistic CI values (<0.9). The middle circle represents additive CI values (0.9–1.1) and CI values >1.1 are considered antagonistic (white circle). Antagonistic CI values > 2.1 are collected in the light violet circle boundary. CI values were determined with CalcuSyn. CI < 0.9, synergism; CI = 0.9–1.1, additive effects; or CI > 1.1, antagonism. Each quarter represents one concentration of the PARPi and within each quarter increasing doses of the combined drug are shown. (B-E) Circular synergy dot-plots for niraparib in combination with topotecan (B-C), talazoparib with either ceralasertib (D) or AZD-7762 (E) are presented. Mean CI values based on the cell viability data of patient-derived pHGG cell models were calculated from n = 3 independent experiments. In case of VBT125 and VBT347 topotecan concentrations are 0.005; 0.025; 0.05 and 0.075 µM. (F) Circular synergy dot-plots for niraparib in combination with topotecan in H3.3 G34R OE and H3.3 G34R OE_ATRX KO iPSCs. Mean CI values based on the cell viability data of iPSC models were calculated from n = 3 independent experiments.
Figure 4.
Figure 4.
Combined inhibition of PARP and topoisomerase causes cell-cycle perturbations and exacerbates DNA damage stress in DHG-H3G34R_ATRX models. (A) The impact of niraparib combined with topotecan at the indicated concentrations for 24 hours on the proportion of cells in S-phase of the cell cycle of VBT92 and VBT347 cells was analyzed with PI-based flow cytometry. Data of n = 3 independent experiments in triplicate are given and normalized to the respective untreated controls. Results are represented as mean ± SD of the respective untreated control. Significance levels between untreated and treated samples, as well as single-drugs and combinations, were evaluated by One-way ANOVA with Bonferroni post-test. *P <0.05; ***P <0.001; n. s. not significant. (B) Western blot analyses of VBT92 and VBT347 cell models treated for 24 hours with niraparib alone or in combination with topotecan with the indicated concentrations. Expression, cleavage, and phosphorylation of the indicated proteins involved in DNA repair are shown. β-actin served as a loading control. Densitometric quantification insets show phosphorylation of H2AX normalized to β-actin.
Figure 5.
Figure 5.
The combination of niraparib and topotecan drives DNA damage and stemness marker loss in DHG-H3G34R_ATRX models. (A) Immunofluorescence staining of pH2AX (DNA damage, right) and Rad51 (DNA repair, middle) in VBT92 (pTERT-mutated aPXA) and VBT347 (DHG-H3G34R_ATRX) DAPI-stained nuclei (left). Cells were untreated (control) or treated with vehicle (DMSO), 10 µM niraparib or/and 0.1 µM topotecan for 24 h. Images were captured on an Olympus spinning disk confocal microscope (40× objective). Representative images of one experiment are shown. (B) Quantification of pH2AX foci per nucleus of VBT92 and VBT347 cells as depicted in (A), represented as a percentage of foci-positive cells. A minimum of 1500 cells per condition were quantified and analyzed with ScanR (n = 3 independent experiments). Error bars represent mean ± SEM. (C) Tumor cell density was measured in DHG-H3G34R_ATRX PDX brain tissues of control, topotecan monotherapy, or topotecan combination therapy with niraparib-treated mice. One sample of the combination treatment group showed no tumor in the brain parenchyma, except alongside the injection channel, and was therefore excluded from this analysis. Statistical significance was calculated with unpaired two-tailed student’s t-test and two-way ANOVA with Dunnett post-test. *P <0.05; **P <0.01; ***P <0.001; ns not significant. (D) Quantification of nestin (stemness)-positive cells. 2.2 million H3G34R-positive tumor cells were phenotyped. Profiling was performed on all samples containing bulk tumors. Statistical significance between untreated and treated was evaluated by unpaired student´s t-test. (E) Representative immunofluorescence images for the stemness marker (nestin). Scale bar = 100 µm.
Figure 6.
Figure 6.
Targeting DHG-H3G34R with PARPi and topoisomerase-I inhibitors is applicable in the clinical setting. MRI and f-18-fluor ethyl tyrosine positron emission (FET-PET) displaying the course of disease and therapy of a pediatric patient diagnosed with a DHG-H3G34R (corresponding to the VBT347 cell model). (A) Axial FLAIR image and contrast-enhanced (CE) T1-weighted MR image prior to primary surgery and postoperative axial CE T1-weighted MRI. (B) Axial FLAIR image and CE T1-weighted MR image at disease progression following irradiation (RTX) with concomitant temozolomide (TMZ) 3 months after initial diagnosis. The third image shows the color map of the choline/NAA ratios of a multivoxel MR spectroscopy (CSI; TE = 135 ms) at the level of one of the enhancing components. The colors red and green represent the voxels with high ratios. (C) Axial FLAIR image and CE T1-weighted MR image following 8 months of niraparib/topotecan treatment. In the third image (FLAIR) no signal changes are seen in the location of the subsequent recurrence. (D) Axial FLAIR image and CE T1-weighted MR image showing disease progression 13 months after initiation of niraparib/topotecan treatment, with a non-enhancing tumor manifestation rostral to the initial tumor sight with increased amino acid tracer uptake in an axial FET-PET/MR-fusion color map. The timeline starts with the presentation of the patient to the clinic (time point zero) and indicates further therapeutic interventions and therapy duration. The red arrows indicate tumor manifestation, and the green arrows point to areas of regressing tumor components.

References

    1. Mackay A, Burford A, Carvalho D, et al.Integrated molecular meta-analysis of 1,000 pediatric high-grade and diffuse intrinsic pontine glioma. Cancer Cell. 2017;32(4):520–537.e5. - PMC - PubMed
    1. Schwartzentruber J, Korshunov A, Liu XY, et al.Driver mutations in histone H3.3 and chromatin remodelling genes in paediatric glioblastoma. Nature. 2012;482(7384):226–231. - PubMed
    1. Haase S, Nunez FM, Gauss JC, et al.Hemispherical pediatric high-grade glioma: Molecular basis and therapeutic opportunities. Int J Mol Sci . 2020;21(24):9654. - PMC - PubMed
    1. Minasi S, Baldi C, Gianno F, et al.Alternative lengthening of telomeres in molecular subgroups of paediatric high-grade glioma. Childs Nerv Syst. 2021;37(3):809–818. - PMC - PubMed
    1. Hanahan D, Weinberg RA.. Hallmarks of cancer: The next generation. Cell. 2011;144(5):646–674. - PubMed

MeSH terms