. 2024 Nov 18;40(1):10.
doi: 10.1007/s11011-024-01457-x.

Diacerein ameliorates thioacetamide-induced hepatic encephalopathy in rats via modulation of TLR4/AQP4/MMP-9 axis

Affiliations

Diacerein ameliorates thioacetamide-induced hepatic encephalopathy in rats via modulation of TLR4/AQP4/MMP-9 axis

Nesma A Abd Elrazik et al. Metab Brain Dis. .

Abstract

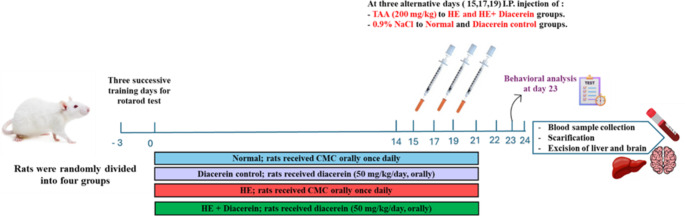
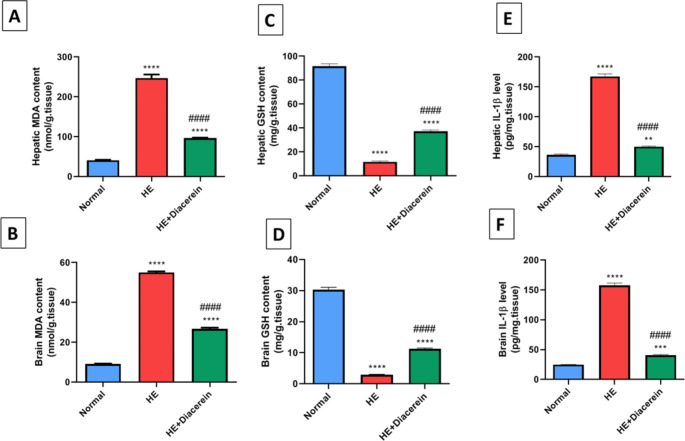
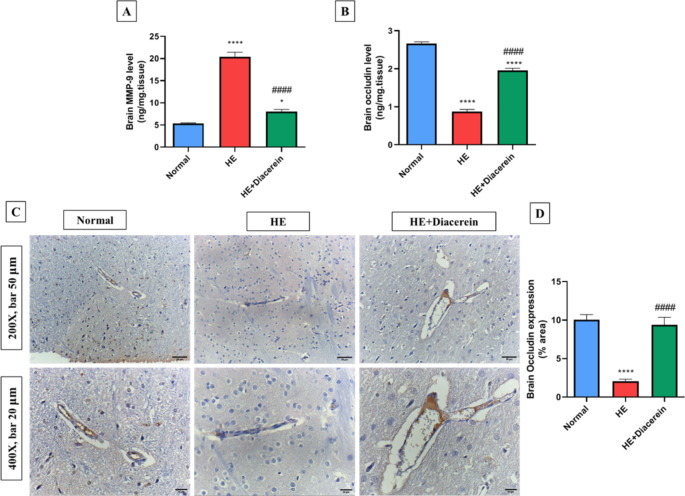
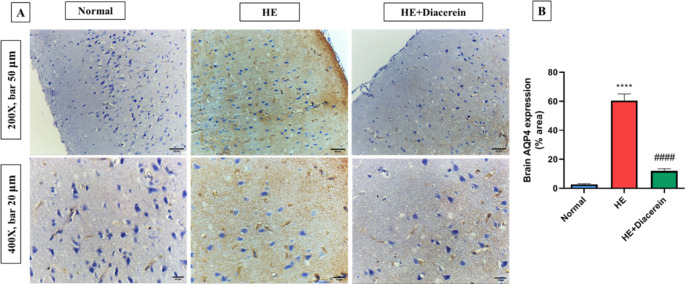
Astrocyte swelling, blood brain barrier (BBB) dissipation and the subsequent brain edema are serious consequences of persistent hyperammonemia in hepatic encephalopathy (HE) in which if inadequately controlled it will lead to brain death. The current study highlights the potential neuroprotective effect of diacerein against thioacetamide (TAA)-induced HE in acute liver failure rat model. HE was induced in male Sprague-Dawley rats via I.P. injection of TAA (200 mg/kg) for three alternative times/week at 3rd week of the experiment. Diacerein (50 mg/kg) was gavaged for 14 days prior to induction of HE and for further 7 days together with TAA injection for an overall period of 21 days. Diacerein attenuated TAA-induced HE in acute liver failure rat model; as proofed by significant lowering of serum and brain ammonia concentrations, serum AST and ALT activities and significant attenuation of both brain and hepatic MDA contents and IL-1β with marked increases in GSH contents (P < 0.0001). The neuroprotective effect of diacerein was demonstrated by marked improvement of motor and cognitive deficits, brain histopathological changes; hallmarks of HE. As shown by immunohistochemical results, diacerein markedly downregulated brain TLR4 expression which in turn significantly increased the GFAP expression, and significantly decreased AQP4 expression; the astrocytes swelling biomarkers (P < 0.0001). Moreover, diacerein preserved BBB integrity via downregulation of MMP-9 mediated digestion of tight junction proteins such as occludin (P < 0.0001). Collectively, diacerein ameliorated cerebral edema and maintained BBB integrity via modulation of TLR4/AQP4/MMP-9 axis thus may decrease the progression of HE induced in acute liver failure.

Keywords: Aquaporin 4; Diacerein; GFAP; Hepatic encephalopathy; MMP-9; TLR4.


Conflict of interest statement

Declarations Ethics approval Study protocols and animal care were approved by the Animal Care and Use Committee (MU-ACUC) (Approval Number: PHARM.R.23.04.16), Mansoura University, Egypt, in accordance with “Guide for the Care and Use of Laboratory Animals” (National Research Council publication 8th edition, USA, 2011). Consent to participate Not applicable. Consent for publication Not applicable. Competing interests The authors declare no competing interests.

Figures

Fig. 1
Fig. 1
Schematic representation of the experimental design
Fig. 2
Fig. 2
Effect of diacerein on behavioral tests. (A) Rotarod test. (B) Morris water maze test. (C) Open field test. Open field test includes resting time, line crossings, rearing frequency and time spent in center. HE: Hepatic encephalopathy. Values are expressed as mean ± SEM. Statistical analysis was performed using One-Way ANOVA followed by Tukey-Kramer’s test (n = 6). * Significantly different versus normal group at P < 0.05. ** Significantly different versus normal group at P < 0.01. *** Significantly different versus normal group at P < 0.001. **** Significantly different versus normal group at P < 0.0001. ### Significantly different versus HE group at P < 0.001. #### Significantly different versus HE group at P < 0.0001
Fig. 3
Fig. 3
Effect of diacerein on brain water content, liver/body weight and brain/body weight indices. (A) Brain water content. (B) liver/body weight index. (C) Brain/body weight index. HE: Hepatic encephalopathy. Values are expressed as mean ± SEM. Statistical analysis was performed using One-Way ANOVA followed by Tukey-Kramer’s test (n = 6). ** Significantly different versus normal group at P < 0.01. **** Significantly different versus normal group at P < 0.0001. #### Significantly different versus HE group at P < 0.0001
Fig. 4
Fig. 4
Effect of diacerein on histopathological alterations in liver and brain. (A) Histopathological changes of liver sections stained with H&E. CV: Central vein. PT: portal areas. Black arrow indicates disrupted hepatic architecture, centrilobular pyknosis and apoptosis in hepatocytes. Red arrow indicates congestion and hemorrhage. The yellow arrow indicates leukocytic cells infiltration lymphocytes, eosinophils and macrophages. Upper panel (200X, bar 50 μm) and lower panel (400X, bar 20 μm). (B) Histopathological changes of brain sections stained with H&E. Black arrow indicates pyramidal neurons. Yellow arrow indicates glial cells. Green arrow indicates shrinkage and apoptosis of pyramidal neurons. Red arrow indicates congestion and hemorrhage. Upper panel (200X, bar 50 μm) and lower panel (400X, bar 20 μm). (C) Liver histopathological lesion, scores are expressed as median and interquartile range. (n = 6). (D) Brain histopathological lesion, scores are expressed as median and interquartile range. (n = 6). HE: Hepatic encephalopathy. Statistical analysis was performed using Kruskal–Wallis test followed by Dunn’s post hoc test. * Significantly different versus normal group at P < 0.05. **** Significantly different versus normal group at P < 0.0001. #### Significantly different versus HE group at P < 0.0001
Fig. 5
Fig. 5
Effect of diacerein on TLR4 and GFAP expressions in brain. A, B) The expression of TLR4 using immunohistochemistry, Bars represent the % area in brain sections stained with anti-TLR4 antibodies, Upper panel (200X, bar 50 μm) and lower panel (400X, bar 20 μm). C, D) The expression of GFAP using immunohistochemistry, Bars represent the % area in brain sections stained with anti-GFAP antibodies, Upper panel (200X, bar 50 μm) and lower panel (400X, bar 20 μm). HE: Hepatic encephalopathy. Values are expressed as mean ± SEM. Statistical analysis was performed using One-Way ANOVA followed by Tukey-Kramer’s test (n = 6). ** Significantly different versus normal group at P < 0.01. **** Significantly different versus normal group at P < 0.0001. #### Significantly different versus HE group at P < 0.0001
Fig. 6
Fig. 6
Effect of diacerein on oxidative stress and inflammation in liver and brain. (A) Hepatic MDA content. (B) Brain MDA content; (C) Hepatic GSH content. (D) Brain GSH content. (E) Hepatic IL-1β level. (F) Brain IL-1β level. HE: Hepatic encephalopathy
Fig. 7
Fig. 7
Effect of diacerein on MMP-9 level, occludin level and expression in brain. (A) Brain MMP-9 level. (B) Brain occludin level using ELISA. C, D) The expression of occludin using immunohistochemistry, Bars represent the % area in brain sections stained with anti-occludin antibodies, Upper panel (200X, bar 50 μm) and lower panel (400X, bar 20 μm). HE: Hepatic encephalopathy. Values are expressed as mean ± SEM. Statistical analysis was performed using One-Way ANOVA followed by Tukey-Kramer’s test (n = 6). * Significantly different versus normal group at P < 0.05. **** Significantly different versus normal group at P < 0.0001. #### Significantly different versus HE group at P < 0.0001
Fig. 8
Fig. 8
Effect of diacerein on AQP4 expression in brain. A, B) The expression of AQP4 using immunohistochemistry, Bars represent the % area in brain sections stained with anti-AQP4 antibodies, Upper panel (200X, bar 50 μm) and lower panel (400X, bar 20 μm). HE: Hepatic encephalopathy. Values are expressed as mean ± SEM. Statistical analysis was performed using One-Way ANOVA followed by Tukey-Kramer’s test (n = 6). **** Significantly different versus normal group at P < 0.0001. #### Significantly different versus HE group at P < 0.0001

References

    1. Abd-ellatif RN, Hegab II, Atef MM, Sadek MT, Hafez YM (2019) Diacerein protects against glycerol-induced acute kidney injury: modulating oxidative stress, inflammation, apoptosis and necroptosis. Chemico-Biol Interact 306:47–53 - PubMed
    1. Abdelaziz RR, Elkashef WF, Said E (2015) Tranilast reduces serum IL-6 and IL-13 and protects against thioacetamide-induced acute liver injury and hepatic encephalopathy. Environ Toxicol Pharmacol 40:259–267 - PubMed
    1. Abdelfattah AM, Mahmoud SS, EL-Wafaey DI, Abdelgeleel HM, ABDELHAMID AM (2023) Diacerein ameliorates cholestasis-induced liver fibrosis in rat via modulating HMGB1/RAGE/NF-κB/JNK pathway and endoplasmic reticulum stress. Sci Rep 13:11455 - PMC - PubMed
    1. Agrawal S, Umapathy S, Dhiman RK (2015) Minimal hepatic encephalopathy impairs quality of life. J Clin Experimental Hepatol 5:S42–S48 - PMC - PubMed
    1. Ali MHH, Messiha BAS, Abdel-Latif HA-T (2016) Protective effect of ursodeoxycholic acid, resveratrol, and N-acetylcysteine on nonalcoholic fatty liver disease in rats. Pharm Biol 54:1198–1208 - PubMed

MeSH terms

LinkOut - more resources