. 2024 Nov 18:13:RP94214.
doi: 10.7554/eLife.94214.

A scale-invariant log-normal droplet size distribution below the critical concentration for protein phase separation

Affiliations

A scale-invariant log-normal droplet size distribution below the critical concentration for protein phase separation

Tommaso Amico et al. Elife. .

Abstract

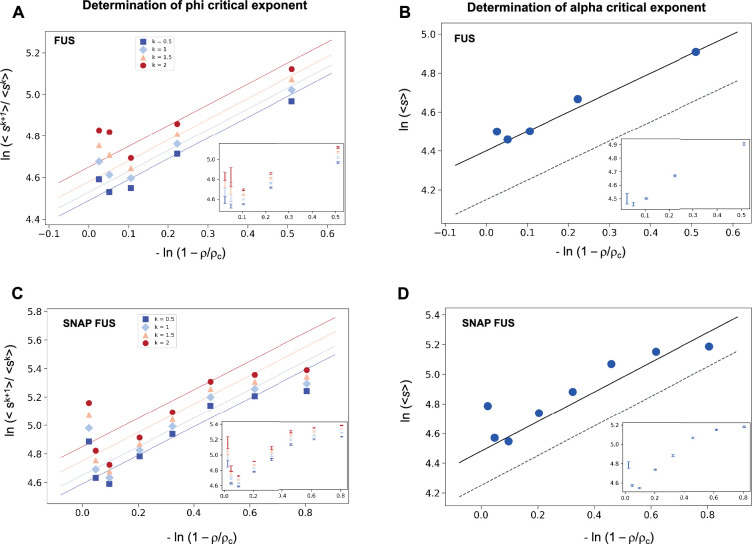
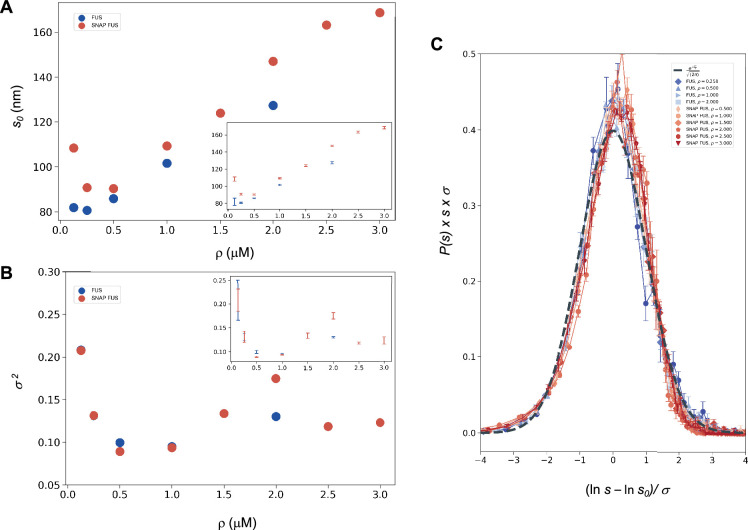
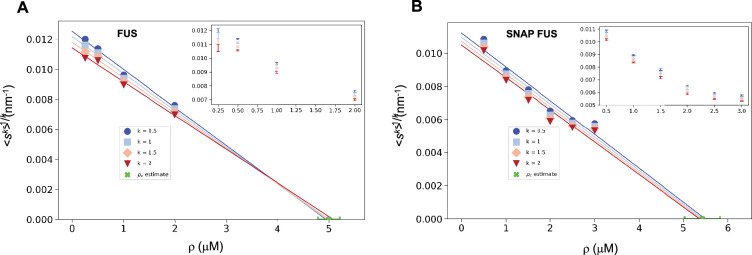
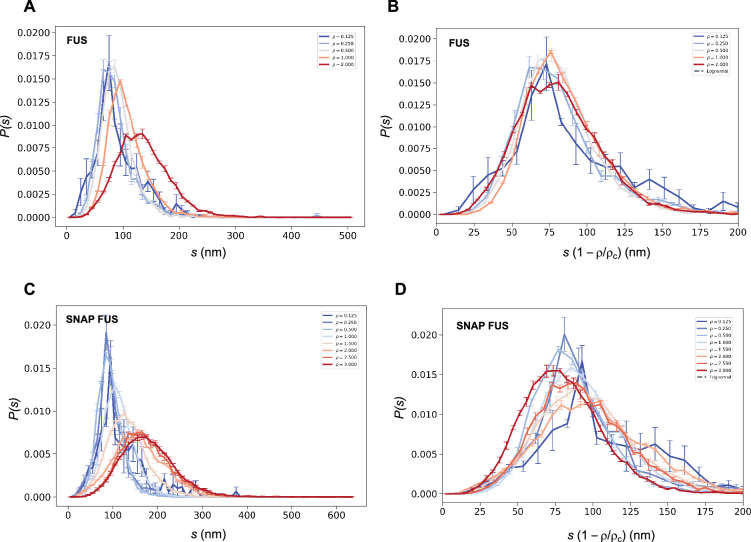
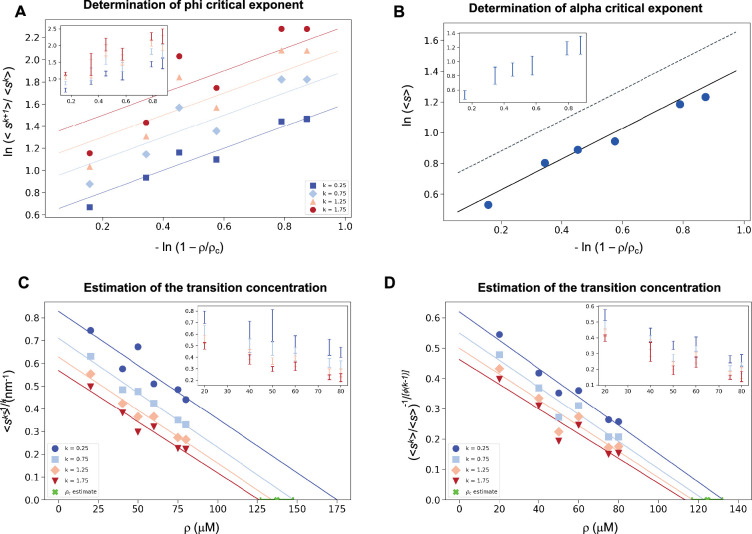
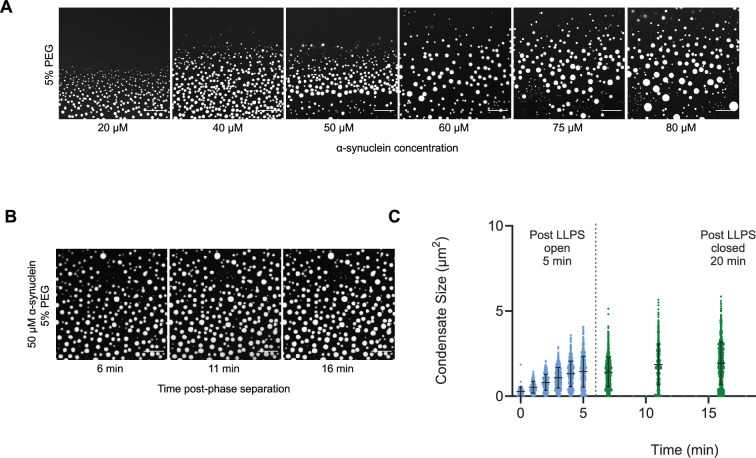
Many proteins have been recently shown to undergo a process of phase separation that leads to the formation of biomolecular condensates. Intriguingly, it has been observed that some of these proteins form dense droplets of sizeable dimensions already below the critical concentration, which is the concentration at which phase separation occurs. To understand this phenomenon, which is not readily compatible with classical nucleation theory, we investigated the properties of the droplet size distributions as a function of protein concentration. We found that these distributions can be described by a scale-invariant log-normal function with an average that increases progressively as the concentration approaches the critical concentration from below. The results of this scaling analysis suggest the existence of a universal behaviour independent of the sequences and structures of the proteins undergoing phase separation. While we refrain from proposing a theoretical model here, we suggest that any model of protein phase separation should predict the scaling exponents that we reported here from the fitting of experimental measurements of droplet size distributions. Furthermore, based on these observations, we show that it is possible to use the scale invariance to estimate the critical concentration for protein phase separation.

Keywords: critical exponents; none; phase transitions; physics of living systems; protein condensation; universal behaviour.


Conflict of interest statement

TA, SD, AL, MB, AT, MV, MF, AM No competing interests declared

Figures

Figure 1.
Figure 1.. Determination of the critical exponents for FUS of the scaling invariance.
Determination of the exponent φ for FUS (A) and SNAP-tagged FUS (C). The ratios of the average moments of the droplet sizes (<sk+1>/<sk > , at k = 0.5, 1, 1.5, 2, Equation 4) are represented at various distances from the critical concentration (|ρ~|). The exponent φ for each value of k was determined by error-weighted linear regressions. The exponent φ and its error were determined as mean and standard deviation of the three independent measurements (Equations 15 and 16). Error bars are shown in inset for graphical clarity. Determination of the exponent α for FUS (B) and SNAP-tagged FUS (D). The mean of the droplet size distributions is plotted at various distances from the critical concentration (|ρ~|). The value of the exponent m was determined by error-weighted linear regression (Equation 6), using φ=1, where the errors were standard deviations of the three independent measurements (Equation 16). Error bars, which were obtained as the standard deviation of the three independent measurements are shown in inset for graphical clarity. Error-weighted linear regressions are performed in both cases excluding the data point at the lowest concentration ρ = 0.125 μM. The fit corresponding to the scaling ansatz, compatible with φ = 1 and α = 0, is represented by a dashed grey line with a slope of 1.
Figure 2.
Figure 2.. Log-normal behaviour of FUS and SNAP-tagged FUS size distributions below the critical concentration.
Variation of the size distribution with protein concentration: ln s0 (A) and σ (B). lns0 and σ (inset) were computed for FUS (blue) and SNAP-tagged FUS (red) using Equation 11. Error bars (in inset for graphical clarity) are estimated from three independent measurements. While droplet sizes increase with concentration, the width of distribution does not change considerably. (C) The collapse of the droplet size distribution functions is consistent with a log-normal behaviour. The droplet size distribution functions for both untagged FUS (blue) and SNAP-tagged FUS (red) are plotted after rescaling the sizes by the ln s0 and σ values, the first and second moments of the logarithm of the droplet size distribution, which are a function of the concentration. The rescaled curves for both the untagged and the tagged protein collapse to the normal distribution (grey dashed), as expected when the non-rescaled droplet sizes follow a log-normal distribution.
Figure 3.
Figure 3.. Estimation of the critical concentration of FUS using the scale invariance.
Critical concentration of FUS (5.0 ± 0.2 μM) (A) and SNAP-tagged FUS (5.4 ± 0.4 μM) (B). The scaling model predicts that the function of the moments plotted versus the concentration ρ becomes a straight line near the critical concentration ρc and intersects the ρ-axis at ρc, independently of the value of k. Error-weighted linear regressions are performed in both cases excluding the data point at the lowest concentration ρ = 0.125 μM. The resulting estimate of the critical concentration is shown in green along with the corresponding standard deviation, estimated from three independent measurements.
Figure 4.
Figure 4.. Collapse of the droplet size distributions of FUS as predicted by the scale invariance.
If the scaling ansatz of Equation 2 holds, the standard deviation σ of the log-normal distribution should not depend on the distance from the critical concentration, and a collapse should be achieved by rescaling the size with the distance |ρ~| from the critical concentration. (A, C) Droplet size distributions derived from the experimental data of untagged FUS at 0.125, 0.25, 0.5, 1.0, and 2.0 μM concentrations (A) and SNAP-tagged FUS at 0.125, 0.25, 0.5, 1.0, 1.5, 2.0, 2.5, and 3.0 μM concentrations (C), and their standard error of the mean from three independent measurements (Stender et al., 2021). (B, D) Collapse of the droplet size distributions rescaled by the estimated critical concentration. The error bars show the standard error of the mean from the three independent measurements (Stender et al., 2021).
Figure 5.
Figure 5.. Estimation of the critical concentration of α-synuclein using the scale invariance.
(A) Determination of the critical exponent φ. The ratios of the average moments of the droplet sizes (<sk+1>/<sk>, at k = 0.25, 0.75, 1.25, 1.75, Equation 4) are represented at various distances |ρ~| from the critical concentration. The exponent φ and its error for each value of k were determined as a mean and standard deviation of the three independent measurements (Equations 15 and 16). Error bars are shown in inset for clarity. (B) Determination of the critical exponent m. The mean of the droplet size distributions is plotted at various distances |ρ~| from the critical concentration. The value of the exponent α was determined by error-weighted linear regression (Equation 6), using φ=1, where the errors were standard deviations of the five independent measurements (Equation 16). Error bars, which were obtained as the standard deviation of the five independent measurements are shown in inset for clarity. Error-weighted linear regressions were performed. The fit corresponding to the scaling ansatz, compatible with φ = 1 and α = 0, is represented by a scattered grey line with a slope of 1. Determination of the critical concentration for α-synuclein using the scaling ansatz in two different ways, either using Equation 18 (C), resulting in ρc = 137 ± 10 μM, or Equation 19 (D), resulting in ρc = 125 ± 7 μM, which are consistent within errors. The scaling model predicts that the function of the moments plotted versus the concentration ρ becomes a straight line near the critical concentration ρc and intersects the ρ-axis at ρc, independently of the value of k. Error-weighted linear regressions were performed. The resulting estimates of the critical concentration are shown in green along with the corresponding standard deviation, estimated from four independent measurements. In panel D, φ was constrained to 1.0 using Equation 19.
Figure 6.
Figure 6.. The droplet size distribution is stationary below the critical concentration.
(A) Images of α-synuclein droplets at increasing concentrations of α-synuclein. (B, C) After an initial transient of 5 min, the droplet size distributions remain approximately stationary below the critical concentration, as shown for the case of 50 μM α-synuclein concentration. Results are reported for five replicates.

Update of

  • doi: 10.1101/2023.04.11.536478
  • doi: 10.7554/eLife.94214.1
  • doi: 10.7554/eLife.94214.2

Similar articles

Cited by

References

    1. Alberti S, Hyman AA. Biomolecular condensates at the nexus of cellular stress, protein aggregation disease and ageing. Nature Reviews. Molecular Cell Biology. 2021;22:196–213. doi: 10.1038/s41580-020-00326-6. - DOI - PubMed
    1. Andersen JS, Lam YW, Leung AKL, Ong S-E, Lyon CE, Lamond AI, Mann M. Nucleolar proteome dynamics. Nature. 2005;433:77–83. doi: 10.1038/nature03207. - DOI - PubMed
    1. Banani SF, Lee HO, Hyman AA, Rosen MK. Biomolecular condensates: organizers of cellular biochemistry. Nature Reviews. Molecular Cell Biology. 2017;18:285–298. doi: 10.1038/nrm.2017.7. - DOI - PMC - PubMed
    1. Bergmann RB, Bill A. On the origin of logarithmic-normal distributions: an analytical derivation, and its application to nucleation and growth processes. Journal of Crystal Growth. 2008;310:3135–3138. doi: 10.1016/j.jcrysgro.2008.03.034. - DOI
    1. Binder K, Virnau P. Overview: Understanding nucleation phenomena from simulations of lattice gas models. The Journal of Chemical Physics. 2016;145:211701. doi: 10.1063/1.4959235. - DOI - PubMed

Grants and funding

LinkOut - more resources