. 2024 Dec;11(47):e2406276.
doi: 10.1002/advs.202406276. Epub 2024 Nov 18.

Transcriptomics-Based Liquid Biopsy for Early Detection of Recurrence in Locally Advanced Gastric Cancer

Affiliations

Transcriptomics-Based Liquid Biopsy for Early Detection of Recurrence in Locally Advanced Gastric Cancer

Ping'an Ding et al. Adv Sci (Weinh). 2024 Dec.

Abstract

The study presents a transcriptomics-based liquid biopsy approach for early recurrence detection in locally advanced gastric cancer (LAGC). Four mRNA biomarkers (AGTR1, DNER, EPHA7, and SUSD5) linked to recurrence are identified through transcriptomic data analysis. A Risk Stratification Assessment (RSA) model combining these biomarkers with clinical features showed superior predictive accuracy for postoperative recurrence, with AUCs of 0.919 and 0.935 in surgical and liquid biopsy validation cohorts, respectively. Functional studies using human gastric cancer cell lines AGS and HGC-27 demonstrated that silencing the identified mRNA panel genes impaired cell migration, invasion, and proliferation. In vivo experiments further showed reduced tumor growth, metastasis, and lymphangiogenesis in mice, possibly mediated by the cAMP signaling pathway. This non-invasive approach offers significant potential for enhancing recurrence detection and enabling personalized treatment strategies, thereby improving patient outcomes in the management of LAGC.

Keywords: gastric cancer; liquid biopsy; mRNA Panel; recurrence detection; transcriptomics.


Conflict of interest statement

The authors declare no conflict of interest.

Figures
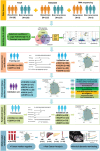
Figure 1
Figure 1
Flowchart of study design for the discovery and validation of the 4‐mRNA panel to predict postoperative recurrence in patients with LAGC.
Figure 2
Figure 2
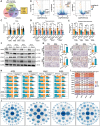
Discovery process and preliminary validation of candidate markers for postoperative recurrence in LAGC patients based on public databases and transcriptomics sequencing data. A) Four candidate mRNAs (AGTR1, DNER, EPHA7, SUSD5) were identified through a Venn diagram analysis using the TCGA database (28 recurrent patients versus 159 non‐recurrent patients), transcriptome data from the GEO database (125 recurrent patients versus 157 non‐recurrent patients), and paired mRNA sequencing (3 recurrent patients versus 3 non‐recurrent patients). B) A volcano plot illustrates the expression levels of these four genes in recurrent and non‐recurrent cancer tissues. C) The expression levels of the four candidate mRNAs (AGTR1, DNER, EPHA7, SUSD5) were compared in cancerous lesions of recurrent patients versus cancerous tissues of non‐recurrent patients in the TCGA database. D) The expression levels of these four candidate mRNAs in cancerous lesions of recurrent patients and cancerous tissues of non‐recurrent patients were compared using 34 pairs of fresh frozen tissues obtained after propensity score matching. E) The expression levels of the four candidate mRNAs in peripheral blood of 26 pairs of recurrent patients, non‐recurrent patients, and healthy controls obtained after propensity score matching were compared. F) Western blot analysis results for the four candidate mRNAs in cancer tissues of recurrent and non‐recurrent patients were compared. G) Immunohistochemical detection results of the four candidate mRNAs in cancer tissues of recurrent and non‐recurrent patients were compared. H) The relationship between the expression of the four candidate mRNAs and the clinical pathological characteristics of patients was analyzed. I) An association heat map was generated to analyze the relationship between these four candidate mRNAs and common metastatic genes based on the TCGA database. J) The PPI network of these four candidate mRNAs was constructed using the online STRING database (https://string‐db.org).
Figure 3
Figure 3
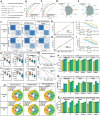
Training and validation of 4‐mRNA prediction based on fresh frozen tissue specimens to identify recurrence in LAGC patients. A) A nomogram for predicting postoperative recurrence in LAGC patients was constructed based on a 4‐mRNA signature combined with clinical features. B) ROC curves of different predictive variables in the training set. C) ROC curves of different predictive variables in the validation set. D) Radar plot comparing evaluation indicators of different prediction models in the training set. E) Radar plot comparing evaluation indicators of different prediction models in the validation set. F) Confusion matrix of different prediction models in the training and validation sets. G) Calibration curve of the RSA model in the training set. H) Calibration curve of the RSA model in the validation set. I) Log‐rank test survival curve of patients in the training set, divided into low‐risk and high‐risk groups according to the critical value obtained from the Youden index of the nomogram. J) Log‐rank test survival curve of patients in the validation set, divided into low‐risk and high‐risk groups. K–L) AUC box plot, sensitivity, and specificity analysis of different prediction models after 1000 bootstrap sessions. M) DCA curve of the RSA model in the training set. N) DCA curve of the RSA model in the validation set. O) Clinical benefit diagram of different prediction models in the training and validation sets. P) Comparison of AUC of different prediction models in a stratified analysis based on different TNM stages and the expression of molecular markers HER2 and PDL1. Q) Comparison of sensitivity of different prediction models in a stratified analysis based on different TNM stages and the expression of molecular markers HER2 and PDL1. R) Comparison of specificity of different prediction models in a stratified analysis based on different TNM stages and the expression of molecular markers HER2 and PDL1.
Figure 4
Figure 4
Validation of 4‐mRNA prediction based on endoscopic biopsy specimens to identify recurrence in LAGC patients. A–D) Correlation analysis of the expression of four candidate mRNAs in endoscopic biopsy specimens and paired surgical resection specimens. E–H) Comparison of the expression of four mRNAs in endoscopic biopsy specimens and paired surgical resection specimens. I) ROC curves of different prediction models in endoscopic biopsy specimens. J) Radar plot comparing evaluation indicators of different prediction models in endoscopic biopsy specimens. K) Calibration curve of the RSA model in endoscopic biopsy specimens. L) Confusion matrix between different prediction models. M) Log‐rank test survival curves of patients divided into low‐risk and high‐risk groups according to the cutoff values obtained from the Youden index of the nomogram. N) Clinical benefit diagram of different prediction models in endoscopic biopsy specimens. O) AUC box plot, sensitivity, and specificity analysis of different models after 1000 bootstrap sessions.P) Comparison of the RSA model in predicting postoperative recurrence in LAGC patients in prospective cohorts with different treatment regimens. Q) Comparison of the RSA model in predicting treatment response of LAGC patients in a prospective neoadjuvant treatment cohort with different treatment regimens.
Figure 5
Figure 5
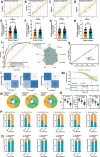
Non‐invasive prediction and identification of LAGC patients with recurrence based on training and validation of 4‐mRNA in peripheral blood specimens. A) Changes in the A260/280 ratio detected at different time points in peripheral blood samples. B) A postoperative recurrence nomogram for LAGC patients constructed based on a 4‐mRNA signature combined with clinical characteristics. C) ROC curves of different prediction models in the training set. D) ROC curves of different prediction models in the validation set. E) Radar chart comparing evaluation indicators of different prediction models in the validation set. F) Confusion matrix of different prediction models in the training set. G) Calibration curve of the RSA model in the training set. H) Calibration curve of the RSA model in the validation set. I) Confusion matrix of different prediction models in both the training and validation sets. J) Log‐rank test survival curve of patients in the training set, divided into low‐risk and high‐risk groups according to the critical value obtained from the Youden index of the nomogram. K) Log‐rank test survival curve of patients in the validation set, divided into low‐risk and high‐risk groups. L) DCA curve of the RSA model in the training set. M) DCA curve of the RSA model in the validation set. N) Clinical benefit diagram of different prediction models in both the training and validation sets.
Figure 6
Figure 6
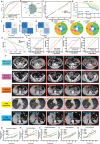
Validation of 4‐mRNA recognition based on peripheral blood samples to predict tumor marker‐negative patients and longitudinal dynamic prediction to identify different types of recurrence. A) ROC curves of different prediction models in the validation set of tumor marker‐negative patients. B) Radar chart comparing evaluation indicators of different prediction models in the validation set of tumor marker‐negative patients. C) Calibration curve of the RSA model in the validation set of tumor marker‐negative patients. D) Log‐rank test survival curves of tumor marker‐negative patients, divided into low‐risk and high‐risk groups according to the critical value obtained from the Youden index of the nomogram. E–G) Confusion matrices of the RSA model constructed using clinical characteristics, 4‐mRNA, and their combination to predict recurrence in tumor marker‐negative patients. H–J) Clinical benefit diagrams of the RSA model constructed using clinical characteristics, 4‐mRNA, and their combination to predict recurrence in tumor marker‐negative patients. K) DCA curve of the RSA model in the tumor marker‐negative patient set. L) ROC curve of the 4‐mRNA signature for predicting postoperative recurrence in colorectal cancer patients. M) ROC curve of the 4‐mRNA signature for predicting postoperative recurrence in hepatocellular carcinoma patients. N) ROC curve of the 4‐mRNA signature for predicting postoperative recurrence in pancreatic cancer patients. O) ROC curve of the 4‐mRNA signature for predicting postoperative recurrence in patients with esophageal cancer. P) The time when recurrence was detected by traditional CT. Q–U) The time of recurrence predicted by the longitudinal dynamic changes of the four mRNAs for patients with the common metastatic forms.
Figure 7
Figure 7
Four recurrence‐related mRNA genes promote GC cell proliferation, migration and invasion in vitro. A,B) Scratch assay to evaluate the migration ability of GC cells after knockdown of AGTR1 and DNER, respectively. C,D) Transwell assay to assess the invasion and metastasis abilities of GC cells after knockdown of AGTR1 and DNER, respectively. E,F) EdU assay to determine the proliferation ability of GC cells after knockdown of AGTR1 and DNER, respectively. G–J) Colony formation assay to measure the proliferation ability of GC cells after knockdown of AGTR1, DNER, EPHA7, and SUSD5. K–N) CCK‐8 assay to detect the proliferation ability of GC cells after knockdown of AGTR1, DNER, EPHA7, and SUSD5. * P < 0.05, ** P < 0.01, *** P < 0.001.
Figure 8
Figure 8
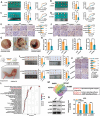
Four recurrence‐related mRNA genes promote GC cell xenograft tumor growth and metastasis in vivo. A–D) Morphological images showing reduced subcutaneous xenograft tumor formation in mice injected with AGS cells knocked down for AGTR1, DNER, EPHA7, and SUSD5, along with tumor volume growth curves and final tumor weights. E) Representative IHC images of subcutaneous xenograft tumors after knockdown of AGTR1 (left), and quantification of IHC staining data for Ki67, N‐cadherin, E‐cadherin, and Vimentin in each group of mice (right). F) Representative IHC images of peritoneal metastasis tumors after intraperitoneal injection of AGS cells knocked down for AGTR1 (left), and quantification of IHC staining data for MMP9, N‐cadherin, E‐cadherin, and Vimentin in each group of mice (right). G) Representative images of peritoneal metastasis tumors in the abdominal cavity of mice injected with AGS cells knocked down for AGTR1. H) Measurement and quantification of the number of peritoneal metastatic tumors in mice after intraperitoneal injection of AGS cells with knockdown of AGTR1, DNER, EPHA7, and SUSD5. I) Representative images of popliteal lymph node metastasis in mice after footpad injection of AGS cells with knockdown of AGTR1. J) Morphological images showing reduced popliteal lymph node formation and final lymph node volume measurement in mice after injection of AGS cells with knockdown of AGTR1, DNER, EPHA7, and SUSD5. K) Representative IHC images of popliteal lymph node metastasis after footpad injection of AGS cells with knockdown of AGTR1 (left), and quantification of IHC staining data for LYVE1, N‐cadherin, E‐cadherin, and Vimentin in each group of mice (right). L) KEGG bubble diagram of the AGTR1 gene. M) Venn diagram of KEGG pathway enrichment for four recurrence‐related mRNA genes. N) Determination of the protein expression status of CREB and p‐CREB in AGS cells after AGTR1 knockdown (left) and further quantification (right).* P < 0.05, ** P < 0.01, *** P < 0.001.

Similar articles

Cited by

References

    1. Bray F., Laversanne M., Sung H., Ferlay J., Siegel R. L., Soerjomataram I., Jemal A., CA Cancer J Clin. 2024, 74, 229. - PubMed
    1. Siegel R. L., Giaquinto A. N., Jemal A., CA Cancer J Clin. 2024, 74, 12. - PubMed
    1. Rustgi S. D., McKinley M., McBay B., Zylberberg H. M., Gomez S. L., Hur C., Kastrinos F., Gupta S., Kim M. K., Itzkowitz S. H., Shah S. C., Clin. Gastroenterol. Hepatol. 2023, 21, 3285. - PMC - PubMed
    1. Sexton R. E., Al Hallak M. N., Diab M., Azmi A. S., Cancer Metastasis Rev. 2020, 39, 1179. - PMC - PubMed
    1. Smyth E. C., Nilsson M., Grabsch H. I., van Grieken N. C., Lordick F., Lancet. 2020, 396, 635. - PubMed

Substances