. 2024 Nov 26;121(48):e2407457121.
doi: 10.1073/pnas.2407457121. Epub 2024 Nov 18.

Frontotemporal network contribution to occluded face processing

Affiliations

Frontotemporal network contribution to occluded face processing

Jalaledin Noroozi et al. Proc Natl Acad Sci U S A. .

Abstract

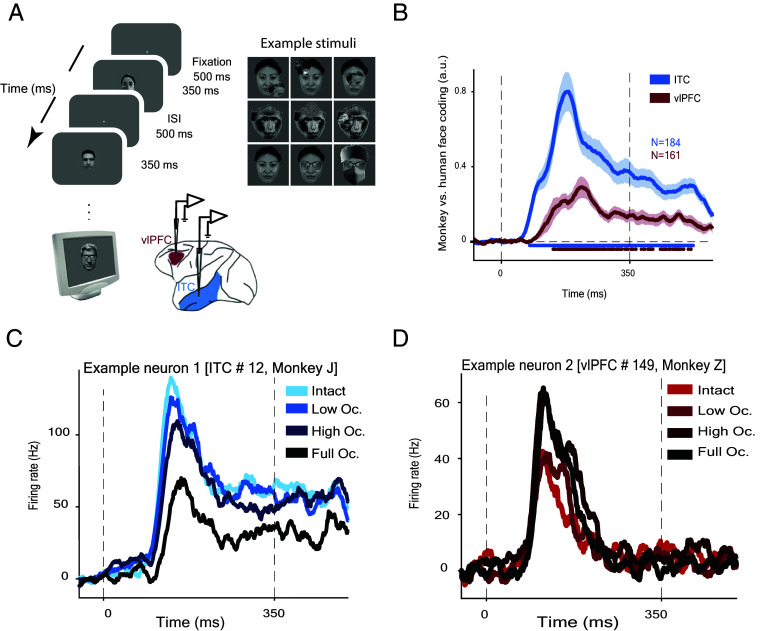
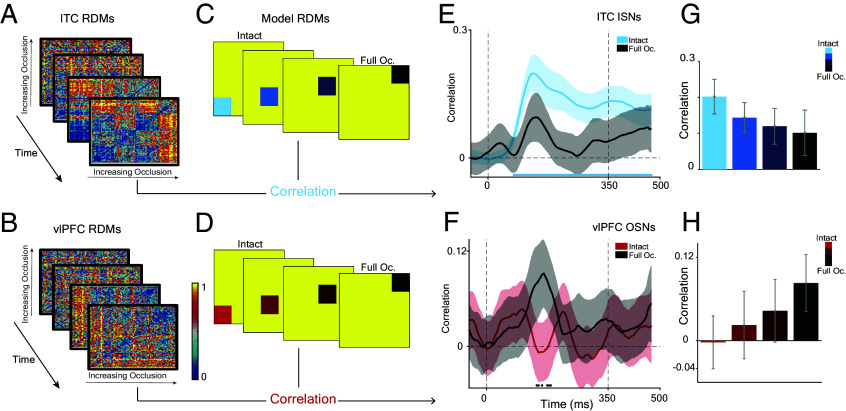
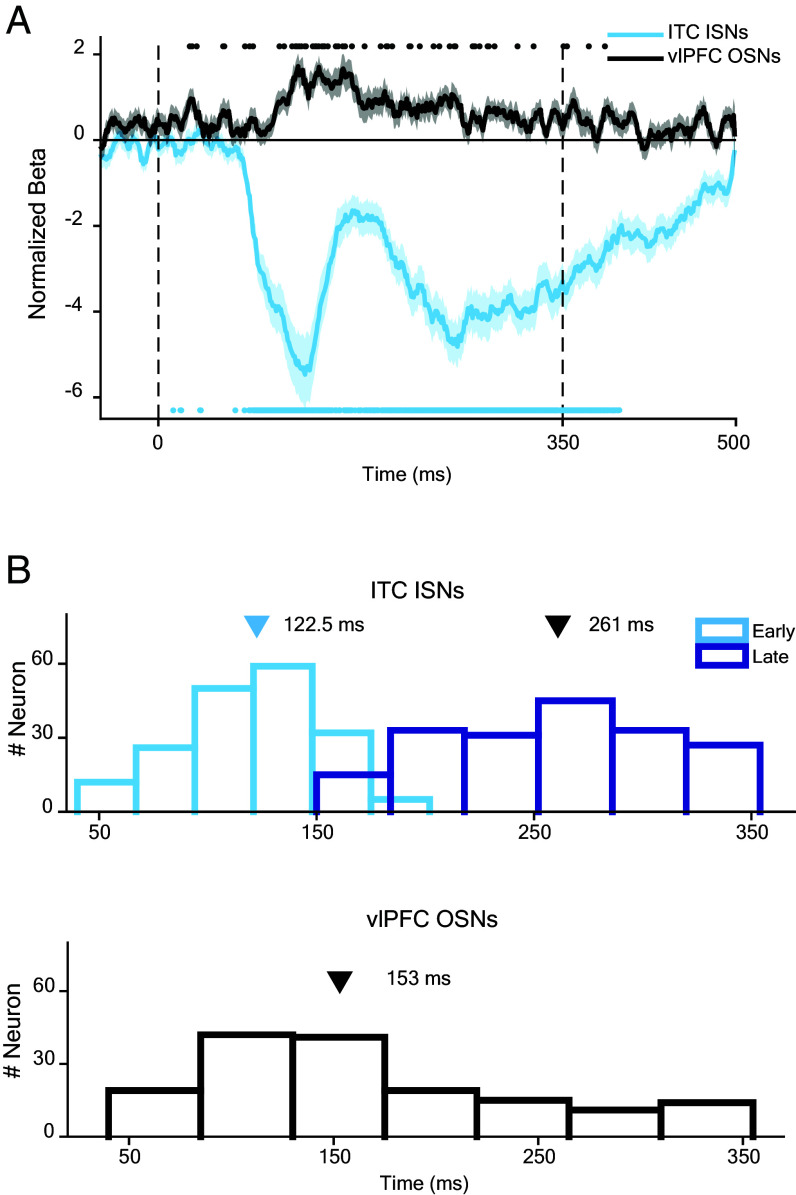
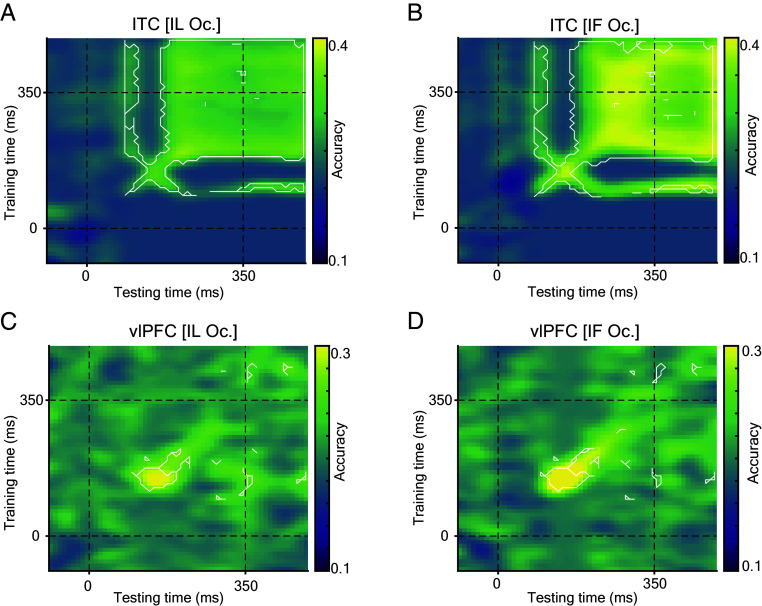
Primates are known for their exceptional ability to recognize faces. However, we still have much to learn about how their brains process faces when they are partially hidden. When we cover parts of a face, it affects how our brains respond, even though we still perceive the face as a whole. This suggests that complex brain networks are at work in understanding partially hidden faces. To explore this further, we studied two brain regions, the ventrolateral prefrontal cortex (vlPFC) and the inferior temporal cortex (ITC), while showing primate images of faces with parts occluded. We found that vlPFC neurons were more active when faces were partially covered, while ITC neurons preferred fully visible faces. Interestingly, the ITC seemed to process occluded faces in a separate phase after the vlPFC responded. Our research revealed a coordinated effort between these brain regions based on the level of facial obstruction. Specifically, the vlPFC seemed to play a crucial role, driving the representation of occluded faces in the later phase of ITC processing. Importantly, we also found that the brain processes occluded faces differently from those that are fully visible, suggesting specialized mechanisms for handling these situations. These findings highlight the importance of feedback from the vlPFC in understanding occluded faces in the ITC region of the brain. Understanding these neural processes not only enhances our understanding of how primates perceive faces but also provides insights into broader aspects of visual cognition.

Keywords: face recognition; inferior temporal cortex; occlusion; ventrolateral prefrontal cortex.


Conflict of interest statement

Competing interests statement:The authors declare no competing interest.

Figures

Fig. 1.
Fig. 1.
The behavioral task involved processing category information. (A) In the passive task, monkeys fixated on a central point on the computer monitor while the stimulus was presented at that point. Simultaneously, spike activity and LFPs were recorded using a single electrode from the ITC and vlPFC regions of the monkey. Each stimulus condition was presented for 350 ms, followed by a 500 ms interstimulus interval (ISI). Example stimuli used in this study are shown. (B) In terms of category coding, ITC and vlPFC neurons exhibited category representations. Significance differences with baseline (−100 to 0 ms) were indicated by blue and red dots under the graph (error bars represent SEM; Wilcoxon rank-sum test; P < 0.01). (C and D) Sample PSTHs for neurons from the ITC and vlPFC at different occlusion levels are shown in (C and D), respectively.
Fig. 2.
Fig. 2.
Population responses in ITC and vlPFC neurons. (A) Average responses (0 to 350 ms) to occlusion were normalized (columns). The visible area is ranked along the abscissa, so each column may show a different amount of occlusion for each neuron. From left to right, the level of occlusion increases while the visible area decreases. Neurons were studied with four levels of occlusion (184 ITC neurons and 161 vlPFC neurons). Responses were normalized to each neuron’s highest response. (B) Most ITC neurons responded strongly (yellow) to low-level occluded faces and weakly (blue) to higher levels of occlusion. (C) Most vlPFC neurons responded strongly (yellow) to occluded faces and less strongly (blue) to low-level occluded faces. Specifically, 131/184 (71%) of ITC neurons and 63/161 (39%) of vlPFC neurons responded to intact faces. The responses of ITC and vlPFC neurons to occluded faces were 29% (53/184) and 61% (98/161), respectively. (D) Average responses normalized using data from ISN and OSN vlPFC at intact and full occlusion levels. The purple dots indicate significant differences between responses to intact and fully occluded images (error bars represent SEM; Wilcoxon signed-rank test; P < 0.05). (E) The responses in panels A and D were fitted using the distribution of linear regression slopes. (F) Negative slopes were present in the majority of ITC neurons (131/184), indicating stronger responses to intact stimuli; the median slope was −0.19. (G) In contrast, positive slopes were observed for the majority of vlPFC neurons (98/161), indicating higher responses to occluded stimuli; the median slope was 0.05. (H) Overall, these findings highlight the differential neural responses in the ITC and vlPFC to various levels of occlusion.
Fig. 3.
Fig. 3.
Population coding using RSA. (A and B) The neural representational dissimilarity matrices (RDMs) were calculated in a time window of 30 ms for each area (ITC in part a; vlPFC in part c) covering all neurons (see the Materials and Methods) section. (C and D) The model is constructed to simulate the representation and processing of information in the brain. These predicted patterns are then compared to the actual patterns of neural activity measured experimentally. (E and F) RSA yields intriguing results by contrasting the actual patterns of neural activity (represented by RDMs) over time for the ITC and vlPFC regions with the predicted patterns generated by the model. In the ITC region, there is a greater degree of similarity between the neural activity patterns and the intact model compared to the fully occluded model. Conversely, in the vlPFC region, there is a greater similarity between the neural activity patterns and the fully occluded model compared to the intact model. (G and H) Furthermore, as the level of occlusion increases, the bar plot demonstrates a decrease in the correlation of RSA for the ITC region. In contrast, for the vlPFC region, the correlation of RSA increases with higher levels of occlusion. The error bars, representing the SE, are depicted based on 500 bootstrap iterations. The lines beneath the curves on the e and f indicate significance with zero (bootstrap test, P < 0.05).
Fig. 4.
Fig. 4.
Dissociation of occlusion compared to face identity representation in the ITC and vlPFC. (A) Displays the contribution of occlusion level extracted from the GLM analysis over time for the ITC (blue) and vlPFC (black) regions. The black and blue dots positioned above and below the figure indicate the time points at which there is a significant difference compared to the baseline (the shadow represents the SEM, calculated over the number of neurons; Wilcoxon signed-rank test; P < 0.05). (B) The histogram illustrates the peak times for part a. Specifically, the ITC region exhibits two distinct phases, with peak times occurring at approximately 122 and 261 ms, respectively. On the other hand, the vlPFC region demonstrates a single peak at around 153 ms.
Fig. 5.
Fig. 5.
Population decoding using SVM classification. (A) The bar plot illustrates the decoding performance of gender (male and female) across different levels of occlusion. It is evident that the decoding of gender in the ITC region is higher for intact images, while the decoding of gender in the vlPFC region is more pronounced for occluded images. (B) The bar chart depicts the difference in decoding accuracy between the vlPFC and ITC (vlPFC-ITC) across different levels of occlusion (the error bars represent the SE). This plot exclusively displays data from the first phase of the ITC. The yellow bar plots represent the shuffled data. An asterisk on each bar denotes a significant difference compared to the shuffled data.
Fig. 6.
Fig. 6.
Neural information flow in the ITC and vlPFC. (A) The application of an autoregressive model on RDMs involves using these representations as input to predict future ones, assuming that the current state of the system can be predicted based on its past states. Granger causality analysis can be applied to assess whether RDMs in one brain region can predict or “cause” RDMs in another, revealing the directional flow of information between regions. This analysis aids in understanding how neural representations in one region may influence or drive representations in another over time. (B) The plot of Granger causality on RDMs illustrates the direction of information flow between the ITC and vlPFC regions. The blue curve shows information flowing from the ITC to the vlPFC during time intervals 95 to 130, 145 to 220, and 305 to 320 ms, and this is significantly different from the baseline.
Fig. 7.
Fig. 7.
Comparative analysis of time–time decoding in the ITC and vlPFC. (A) The temporal dynamics of decoding accuracy for faces with IL occlusion in the ITC region are revealed by the time–time decoding analysis. Two distinct phases of decoding are observed, with the first phase occurring between 70 and 200 ms and the second phase occurring after 200 ms. (B) Similarly, in the time–time decoding analysis for faces with IF occlusion in the ITC region, two distinct phases are observed. However, the decoding performance accuracy is higher compared to faces with IL occlusion. (C and D) In the vlPFC region, the time–time decoding analysis demonstrates that the decoding accuracy reaches its peak between 125 and 200 ms, regardless of the level of occlusion. Notably, there is a significant difference in the decoding accuracy between faces with IF occlusion and faces with IL occlusion in the vlPFC region bootstrap test (P < 0.05).
Fig. 8.
Fig. 8.
Uncovering the influence of occlusion on neural synchronization. (A) The PLV between the ITC and vlPFC regions is shown for intact stimuli and full occlusion. Prior to the second phase of the ITC, there is a high PLV observed in the 7 to 17 Hz frequency range. The difference heat map clearly indicates a greater degree of locking in the presence of occlusion. (B) In the analysis of PLV for the frequency range of 7 to 17 Hz over time, a significant difference is observed between the intact and full occlusion conditions within the time window of 155 to 195 ms. (C) In the scatter plot, it is evident that a higher proportion of the pairs for PLV show greater PLVs for full occlusion compared to intact images (62%), indicating a significant difference (Wilcoxon signed-rank test, with P < 0.01). The median value of −0.29 for this distribution indicates that the majority of the PLVs are skewed toward the side of full occlusion.
Fig. 9.
Fig. 9.
Microsaccade and pupil size responses. (A) Microsaccades for intact and fully occluded conditions are similar until 250 ms. After 250 ms, microsaccades increase more for the fully occluded faces compared to the intact stimulus. (B) Pupil size for intact and fully occluded conditions is similar throughout the entire time period, with no significant differences between them. The blue dots show the significant times between two intact and full occluded image responses (the error bar represents SEM; Wilcoxon sign rank test; P < 0.05).

References

    1. Burton A. M., Jenkins R., Hancock P. J., White D., Robust representations for face recognition: The power of averages. Cogn. Psychol. 51, 256–284 (2005). - PubMed
    1. Jacques C., et al. , The neural basis of rapid unfamiliar face individuation with human intracerebral recordings. Neuroimage 221, 117174 (2020). - PubMed
    1. Taubert J., Weldon K. B., Parr L. A., Robust representations of individual faces in chimpanzees (Pan troglodytes) but not monkeys (Macaca mulatta). Anim. Cogn. 20, 321–329 (2017). - PubMed
    1. Thatere A., Meshram A., Verma P., Jirapure A., Eds., “Face recognition under occlusion: An efficient handcrafted feature & SVM based approach” in 2024 IEEE International Conference on Interdisciplinary Approaches in Technology and Management for Social Innovation (IATMSI), Thatere A., Meshram A., Verma P., Jirapure A., Eds. (IEEE, 2024).
    1. Fu M., Wang Z., Fan D., Wu H., Eds., “Occlusion face recognition based on improved attention mechanism” in International Conference on Computer Graphics, Artificial Intelligence, and Data Processing (ICCAID 2022), Fu M., Wang Z., Fan D., Wu H., Eds. (SPIE, 2023).

Grants and funding

LinkOut - more resources