. 2024 Nov 26;121(48):e2407835121.
doi: 10.1073/pnas.2407835121. Epub 2024 Nov 18.

HIV-1 budding requires cortical actin disassembly by the oxidoreductase MICAL1

Affiliations

HIV-1 budding requires cortical actin disassembly by the oxidoreductase MICAL1

Thomas Serrano et al. Proc Natl Acad Sci U S A. .

Abstract

Many enveloped viruses bud from the plasma membrane that is tightly associated with a dense and thick actin cortex. This actin network represents a significant challenge for membrane deformation and scission, and how it is remodeled during the late steps of the viral cycle is largely unknown. Using superresolution microscopy, we show that HIV-1 buds in areas of the plasma membrane with low cortical F-actin levels. We find that the cellular oxidoreductase MICAL1 locally depolymerizes actin at budding sites to promote HIV-1 budding and release. Upon MICAL1 depletion, F-actin abnormally remains at viral budding sites, incompletely budded viruses accumulate at the plasma membrane and viral release is impaired. Remarkably, normal viral release can be restored in MICAL1-depleted cells by inhibiting Arp2/3-dependent branched actin networks. Mechanistically, we find that MICAL1 directly disassembles branched-actin networks and controls the timely recruitment of the Endosomal Sorting Complexes Required for Transport scission machinery during viral budding. In addition, the MICAL1 activator Rab35 is recruited at budding sites, functions in the same pathway as MICAL1, and is also required for viral release. This work reveals a role for oxidoreduction in triggering local actin depolymerization to control HIV-1 budding, a mechanism that may be widely used by other viruses. The debranching activity of MICAL1 could be involved beyond viral budding in various other cellular functions requiring local plasma membrane deformation.

Keywords: Arp2/3; ESCRT; HIV-1 budding; MICAL1; actin.


Conflict of interest statement

Competing interests statement:The authors declare no competing interest.

Figures

Fig. 1.
Fig. 1.
MICAL1 depletion reduces HIV-1 release from infected cells. (A) WB analysis of HIV-1 Gag products in infected HeLa cells treated with indicated siRNAs (panels Infected cells) and corresponding supernatants (panel Supernatant). Loading control: GAPDH. Equal volumes of cell and supernatant samples were loaded. This experiment was repeated at least three times independently with similar results. (B) Quantification by Gag-p24 ELISA of HIV-1 release in HeLa cells treated with either Control or MICAL1 siRNAs. Results were normalized to control RNAi conditions (set at 100%). Error bars represent SD calculated from 4 independent experiments, each done in triplicate. Two-tailed unpaired Student’s t test. (C) Quantification by ELISA of released Gag-p24 in the supernatant of infected HeLa cells treated with either Control or MICAL1 siRNAs at indicated times after infection. Error bars represent SD calculated from one experiment done in triplicate. Two-tailed unpaired Student’s t test. (D, Left) Transmission electron microscopy images of released viruses from infected HeLa cells treated with either Control or MICAL1 siRNAs. (Scale bars, 200 nm.) (Right) Quantification of the proportion of mature vs. immature capsids. n = 232 (Control RNAi) and n = 165 (MICAL1 RNAi) released capsids. Fisher’s exact test. (E) The virus infectivity was scored by measuring beta-galactosidase levels in infected HeLa P4C5 reporter cells treated with either Control or MICAL1 siRNAs. The beta-galactosidase values were normalized to the amount of released Gag-p24. Results were normalized to control RNAi conditions (set at 100%). Error bars represent SD calculated from three independent experiments. Two-tailed unpaired Student’s t test. (F) WB analysis of HIV-1 Gag products in infected THP-1 cells treated with indicated siRNAs (panels Infected cells) and corresponding supernatants (panel Supernatant). Loading control: GAPDH. Equal volumes of cell and supernatant samples were loaded. This experiment was repeated at least three times independently with similar results. (G) Quantification by Gag-p24 ELISA of HIV-1 release in THP-1 cells treated with either Control or MICAL1 siRNAs. Results were normalized to control RNAi conditions (set at 100%). Error bars represent SD calculated from three independent experiments, each done in triplicate. Two-tailed unpaired Student’s t test. (H) Endogenous MICAL1 from infected (NL4-3) or noninfected (Ni) HeLa cells was revealed with anti-MICAL1 antibodies (control immunoprecipitation = Rabbit IgG). Coimmunoprecipitated Gag-p55 (red star) was revealed with anti-Gag antibodies. The lower band corresponds to nonspecific background also present in noninfected cells.
Fig. 2.
Fig. 2.
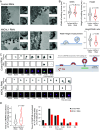
MICAL1 depletion induces accumulation of HIV-1 budding particles at the plasma membrane. (A) Z projection of spinning disk confocal images of infected HeLa cells treated with indicated siRNAs and labeled with anti-Gag (green) and anti-Env (magenta) antibodies. (Scale bars, 10 μm.) (B) Quantification of the area covered by Gag staining in infected cells (arbitrary units, arb. units). Results were normalized to control RNAi conditions (set at 1.0) Error bars represent SD calculated from four independent experiments. n = 145 (Control RNAi) and n = 154 (MICAL1 RNAi) cells analyzed. Two-tailed unpaired Student’s t test. (C) Correlative light-scanning electron microscopy (SEM) of HeLa cells transfected with NL4-3-Gag-GFP provirus after control (Left) or MICAL1 (Right) depletion. Phase-contrast (TRANS), fluorescent, and SEM pictures with corresponding zooms of budding regions are presented. (Scale bars, 10 μm for fluorescence pictures and 1 μm for SEM.) (D) Quantification of the number of viruses at the cell surface per 30 μm2 budding regions (violin plot with median and interquartiles). n = 47 budding regions from 13 cells analyzed in Control RNAi conditions and n = 35 budding regions from nine cells analyzed in MICAL1 RNAi conditions. Kolmogorov–Smirnov test.
Fig. 3.
Fig. 3.
MICAL1 depletion impairs normal budding and delays ESCRT-III recruitment at budding sites. (A) TEM of infected HeLa cells treated with either Control or MICAL1 siRNAs. (Scale bars, 200 nm.) (B) Width, Height, and Height/Width ratio of budding virions in infected HeLa cells treated with either Control or MICAL1 siRNAs. Mean of three independent experiments (violin plot with median and interquartiles). n = 132 (Control RNAi) and n = 134 (MICAL1 RNAi) buds. Two-tailed unpaired Student’s t test. (C) Time-lapse images (one image every 30 s for 45 min) using TIRF microscopy of HeLa cells stably expressing GFP-CHMP4B (green) and transfected with plasmid encoding Gag-mCherry (magenta) after treatment with either Control or MICAL1 siRNAs. (Scale bars, 1 μm.) (D) Quantification of the time of CHMP4B recruitment at VLP budding sites. (Left) Violin plot with median and interquartiles. (Right) Histograms of distribution of CHMP4B recruitment times. n = 75 VLPs from eight cells and 92 VLPs from eight cells in Control RNAi and MICAL1 RNAi conditions, respectively. N = 3 independent experiments. Kolmogorov–Smirnov test.
Fig. 4.
Fig. 4.
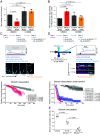
MICAL1 depletion impairs F-actin clearance at HIV-1 budding sites. (A, Top) Spinning disk confocal images of infected HeLa cells treated with either Control (Left) or MICAL1 (Right) siRNAs and labeled with anti-Gag (green) antibody and fluorescent phalloidin (magenta). Extra: Extracellular space. Cyto: cytoplasm. (Bottom) Plot profile of the Gag and Phalloidin intensity of corresponding images. (Scale bars, 2 μm.) (B) Quantification of F-actin intensity (using fluorescent phalloidin) at Gag-positive (Gag+) and Gag-negative (Gag–) regions (normalized to Gag- regions), in Control and MICAL1-depleted HeLa cells (n = 132 and n = 154 Gag+ budding regions from seven cells analyzed in Control RNAi and MICAL1 RNAi conditions, respectively). Error bars represent SD. Two way-ANOVA multiple comparisons. (C) Quantification of the variations of F-actin intensity in Gag+ regions compared to adjacent Gag- regions. n = 176 Gag+ regions and n = 196 Gag+ regions from 12 cells analyzed in Control and MICAL1 RNAi conditions, respectively. Error bars represent SD calculated from three independent experiments. Two-tailed unpaired Student’s t test. (D) 3D-STORM images of infected HeLa cells treated with either Control (Left) or MICAL1 (Right) siRNAs and labeled with anti-Gag antibody (green) and fluorescent phalloidin (magenta). (Scale bars, 200 nm.) (E) Quantification of F-actin presence at budding sites using 3D-STORM images. n = 74 and n = 98 budding viruses from three cells analyzed in Control RNAi and MICAL1 RNAi conditions, respectively. Error bars represent SD. Two-tailed unpaired Student’s t test.
Fig. 5.
Fig. 5.
Inhibiting branched-actin nucleation restores normal HIV-1 release in MICAL1-depleted cells, and MICAL1 exhibits debranching activity. (A) Quantification by Gag-p24 ELISA of HIV-1 release in Control and MICAL1-depleted HeLa cells, treated with either dimethyl sulfoxide (DMSO) or CK666 (75 μM). Results were normalized to control RNAi treated with DMSO conditions (set at 100%). Error bars represent SD calculated from three independent experiments, each done in triplicate. One-way ANOVA multiple comparisons. (B) Quantification of the area covered by Gag staining in infected cells (arbitrary units, arb.units.). Error bars represent SD calculated from three independent experiments. n = 185, 188, 206, and 185 cells analyzed for Control RNAi+DMSO, Control RNAi+CK666, MICAL1 RNAi+DMSO and MICAL1 RNAi+CK666 conditions, respectively. One-way ANOVA multiple comparisons. (C, Top) Schematic of branching and debranching experiment in an in vitro reconstitution assay using an open microchamber. (Middle) Fluorescence microscope image sequence, showing the dissociation (yellow arrow) of an actin filament branch (cyan+blue arrow) from its mother filament (magenta, and cyan+blue star). The time interval between images is 5 s. Filaments were monitored in the presence of 0.3 μM 10% ATTO-488 labeled G-actin (cyan)—causing all barbed ends to elongate—with or without 50 nM MICAL11-499 (active catalytic domain) and 60 μM NADPH. (Scale bar, 5 μm.) (Bottom) Fraction of remaining (undissociated) actin filament branches as a function of time, in the presence or absence of MICAL11-499 and NADPH. The shaded areas show the 65% CI. Between control (pooled repeats) and 50 nM (pooled repeats), P < 0.0001 (log-rank test). (D, Top) Schematic of the debranching experiment in an in vitro reconstitution assay using a microfluidics chamber. Filaments are exposed to different conditions (with or without MICAL11-499 and NADPH) side by side, in the same chamber. (Middle) The microscope image sequence shows the dissociation (yellow arrow) of an actin filament branch (cyan+blue arrow) from its mother filament (magenta, and cyan+blue star). The time interval between images is 5 s. (Scale bar, 5 μm.) (Bottom) Fraction of remaining (undissociated) actin filament branches as a function of time, under indicated conditions. Each curve shows the surviving fraction of different populations of n branches over time. In all these experiments, the average force on branch junctions was 0.32 (±0.03, SD) pN at t = 0 and increased at a rate of 0.00056 (±0.00011, SD) pN/s as the branches elongated over time. The shaded areas show the 65% CI. Between different concentrations (pooled repeats), P < 0.0001 (log-rank test). (E) Percentage of branches that renucleate after dissociating, in the presence of 60 µM NADPH and different concentrations of MICAL11-499. Each data point corresponds to one experiment, monitoring, from left to right, n = 22, 16, 26, 16, 25, 29, 30, 26, 24 dissociated branches (same filament populations as in D). Error bars show binomial SD.
Fig. 6.
Fig. 6.
MICAL1 and its activator the GTPase Rab35 act in the same pathway in HIV-1 release. (A) WB analysis of HIV-1 Gag products in infected HeLa cells treated with indicated siRNAs (panels Infected cells) and corresponding supernatants (panel Supernatant). Loading control: GAPDH. Equal volumes of cell and supernatant samples were loaded. This experiment was repeated at least three times independently with similar results. (B) Quantification by Gag-p24 ELISA of HIV-1 release in infected HeLa cells treated with either Control, MICAL1, Rab35, or MICAL1+Rab35 siRNAs. Results were normalized to control RNAi conditions (set at 100%). Error bars represent SD calculated from three independent experiments, each done in triplicate. One-way ANOVA multiple comparisons. (C) Quantification of the area covered by Gag staining in infected cells (arbitrary units, arb.units.). Error bars represent SD calculated from three independent experiments. n = 126, 133, 122, and 131 cells analyzed for Control RNAi, MICAL1 RNAi, Rab35 RNAi, and MICAL1+Rab35 RNAi conditions, respectively. One-way ANOVA multiple comparisons. (D) Spinning disk confocal images of genome-edited HeLa cells that express endogenous Rab35 tagged with GFP and stained with anti-Gag (magenta) antibody and GFP-Booster nanobody (green) after infection. (Scale bars, 10 μm.) (E) Model for F-actin clearance by MICAL1 at budding site during HIV-1 budding. We propose that Rab35 at HIV-1 budding sites activates the redox enzyme MICAL1, which locally disassembles cortical F-actin through its depolymerizing and debranching activities. This is required for complete budding and normal ESCRT-III recruitment and thereby promotes viral release.

References

    1. Demirov D. G., Orenstein J. M., Freed E. O., The late domain of human immunodeficiency virus type 1 p6 promotes virus release in a cell type-dependent manner. J. Virol. 76, 105–117 (2002). - PMC - PubMed
    1. Garrus J. E., et al. , Tsg101 and the vacuolar protein sorting pathway are essential for HIV-1 budding. Cell 107, 55–65 (2001). - PubMed
    1. Martin-Serrano J., Zang T., Bieniasz P. D., HIV-1 and Ebola virus encode small peptide motifs that recruit Tsg101 to sites of particle assembly to facilitate egress. Nat. Med. 7, 1313–1319 (2001). - PubMed
    1. VerPlank L., et al. , Tsg101, a homologue of ubiquitin-conjugating (E2) enzymes, binds the L domain in HIV type 1 Pr55(Gag). Proc. Natl. Acad. Sci. U.S.A. 98, 7724–7729 (2001). - PMC - PubMed
    1. von Schwedler U. K., et al. , The protein network of HIV budding. Cell 114, 701–713 (2003). - PubMed

LinkOut - more resources