. 2024 Nov 26;121(48):e2409674121.
doi: 10.1073/pnas.2409674121. Epub 2024 Nov 18.

Metabolic scaling, energy allocation tradeoffs, and the evolution of humans' unique metabolism

Affiliations

Metabolic scaling, energy allocation tradeoffs, and the evolution of humans' unique metabolism

Andrew K Yegian et al. Proc Natl Acad Sci U S A. .

Abstract

All organisms use limited energy to grow, survive, and reproduce, necessitating energy allocation tradeoffs, but there is debate over how selection impacted metabolic budgets and tradeoffs in primates, including humans. Here, we develop a method to compare metabolic rates as quotients of observed relative to expected values for mammals corrected for size, body composition, environmental temperature, and phylogenetic relatedness. Contrary to previous analyses, these quotients reveal that nonhuman primates have total metabolic rates expected for similar-sized mammals in similar environments. In addition, data from several small-scale societies show that humans evolved exceptionally high resting, activity, and total metabolic rates apparently by overcoming tradeoffs between resting and active energy expenditures that constrain other primates. Enhanced metabolic rates help humans fuel expanded brains, faster reproductive rates, extended longevity, and high percentage of body fat.

Keywords: evolution; human; metabolism; primate; tradeoffs.


Conflict of interest statement

Competing interests statement:The authors declare no competing interest.

Figures

Fig. 1.
Fig. 1.
Thermodynamic model of energy allocation. (A) Assuming that heat generated by TEE must be exchanged with the environment to maintain constant body temperature, then for a given TEE, there must be a tradeoff between AEE and REE (or their quotients AMQ and RMQ). Diverging from this gradient requires either more or less heat exchange with the environment. (B) Test of the model using data on nonhuman primates and mammals, all of which fall along gradient of TMQ = 1. In contrast, human populations from diverse environments and subsistence strategies all fall above the average mammalian gradient of TMQ = 1, indicating an improved ability to exchange heat thus allowing higher AEEs for a given REE. Hadza are hunter-gatherers from Tanzania, the Tsimane are forager-horticulturalists form the Amazon, the Gambia, and Aymara are subsistence farmers from tropical Africa and highland Bolivia, U represents a postindustrial American population, and X is a global average of 110 populations.
Fig. 2.
Fig. 2.
Allometric regression models. Total, resting, and active energy expenditure relative to body size and environmental temperature. (A and B) Logarithmic plots of total (A) and resting (B) energy expenditure versus body mass. Hadza are indicated by the dark red closed circle, chimpanzees by the dark red open circle, other primates by light red, and nonprimate legged eutherian mammals by gray. Both resting and TEE scale to body mass with an exponent of 0.72. (CE) Resting total and active energy expenditure as a function of environmental temperature (Te). All expenditures are partial residuals that correct for body mass using the relationships shown in A and B and are reported as the percentage expected based on mass alone. Note that AEE declines with Te in mammals (D) but is independent of Te in humans (F), with Hadza indicated by the dark red closed circle and 116 other human sample means plotted in blue.
Fig. 3.
Fig. 3.
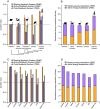
Interspecific and intraspecific variation in resting, active, and TEEs. (A) Evolution of resting, active, and TMQs (RMQ, AMQ, and TMQ) for select primate clades including a human hunter-gatherer population represented by the Hadza (from ref. 9) and with rodents as an outgroup (see Materials and Methods for data sources). All data are averages of males and females with 95% CI shown when available. In monkeys and chimpanzees, TMQ values are not significantly different from the average mammal value of 1.0, but RMQs are higher and AMQs are lower; in contrast, RMQ, AMQ, and TMQ in the hunter-gatherer population are significantly above 1.0. (B) Estimated resting and active energy expenditures in MJ/d of the same taxa standardized to a 47.2 kg body mass, 39.7 kg fat-free mass, and 28 °C. (C and D) Metabolic quotients (C) and standardized resting and active energy expenditures in MJ/d (D) for five nonindustrial populations including the Hadza, a sample of Americans, and a global sample of 110 populations (from ref. 28). Although AMQ varies widely among human populations with only Americans being less active that similar-sized mammals, TMQ and RMQ are substantially above expected values for similar-sized mammals, and there is minimal variation in daily REE after standardizing for size, body composition, and environmental temperature. See Materials and Methods for details on how values were derived for each clade.
Fig. 4.
Fig. 4.
Human metabolic quotients are high for mammals and vary widely within populations. Resting, active, and TMQs (RMQ, AMQ, and TMQ) are shown as dimensionless vertical scales. Mean quotient values for the Hadza (red), USA (blue), and chimpanzees (white) are plotted on the scales along with the expected value of 1.0 based on the average mammal. Violin plots show the distributions of quotient values along the scales: Gray distributions to the right represent interspecific variation within the legged mammal dataset, while red (Hadza) and blue (USA) distributions to the Left represent intraspecific variation within the two human populations. Mammal species means are also indicated by black open circles to the right of the scales, while human individuals are indicated by opaque red and blue closed circles to the left of the scales. Note that the Hadza RMQ value comes from REE data estimated by anthropometric equations rather than measured by indirect calorimetry as in the USA sample. Eight species with TMQ values at the extremes of the interspecific distribution are indicated by numbers: 1) African wild dog (Lycaon pictus), 2) Springbok (Antidorcas marsupialis), 3) Common shrew (Sorex araneus), 4) Mountain beaver (Aplodontia rufa), 5) Cairo spiny mouse (Acomys cahirinus), 6) Brown-throated sloth (Bradypus variegatus), 7) Grant’s golden mole (Eremitalpa granti), and 8) Common rock rat (Zyzomys argurus).

References

    1. Kaplan H., Hill K., Lancaster J., Hurtado A. M., A theory of human life history evolution: Diet, intelligence, and longevity. Evol. Anthropol. 9, 156–185 (2000).
    1. Hawkes K., O’Connell J. F., Jones N. G., Alvarez H., Charnov E. L., Grandmothering, menopause, and the evolution of human life histories. Proc. Natl. Acad. Sci. U.S.A. 95, 1336–1339 (1998). - PMC - PubMed
    1. Wrangham R. W., Jones J. H., Laden G., Pilbeam D., Conklin-Brittain N., The raw and the stolen: Cooking and the ecology of human origins. Curr. Anthropol. 40, 567–594 (1999). - PubMed
    1. Kraft T. S., et al. , The energetics of uniquely human subsistence strategies. Science 374, eabf0130 (2022). - PubMed
    1. Pontzer H., et al. , Metabolic acceleration and the evolution of human brain size and life history. Nature 533, 390–392 (2016). - PMC - PubMed

LinkOut - more resources