. 2025 May 13;148(5):1723-1739.
doi: 10.1093/brain/awae379.

Three-dimensional tissue engineered skeletal muscle modelling facioscapulohumeral muscular dystrophy

Affiliations

Three-dimensional tissue engineered skeletal muscle modelling facioscapulohumeral muscular dystrophy

Marnix Franken et al. Brain. .

Abstract

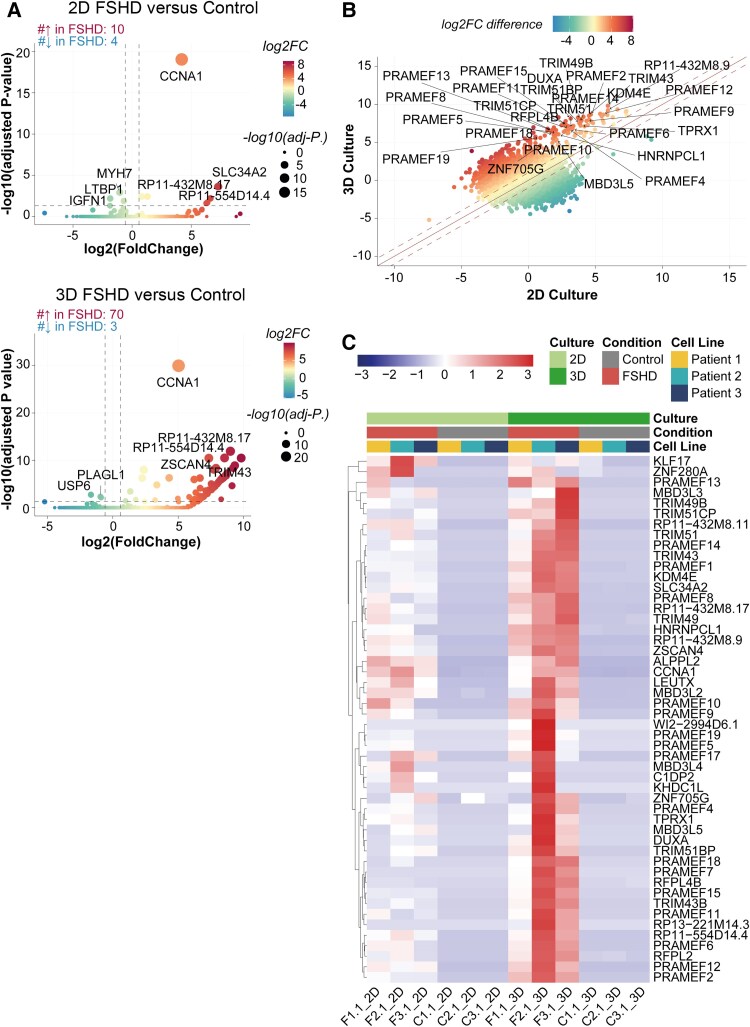
Facioscapulohumeral muscular dystrophy (FSHD) is caused by sporadic misexpression of the transcription factor double homeobox 4 (DUX4) in skeletal muscles. So far, monolayer cultures and animal models have been used to study the disease mechanism of FSHD and for development of FSHD therapy, but these models do not fully recapitulate the disease and there is a lack of knowledge on how DUX4 misexpression leads to skeletal muscle dysfunction. To overcome these barriers, we have developed a 3D tissue engineered skeletal muscle (3D-TESM) model by generating genetically matched myogenic progenitors from human induced pluripotent stem cells of three mosaic FSHD patients. 3D-TESMs derived from genetically affected myogenic progenitors recapitulated pathological features including DUX4 and DUX4 target gene expression, smaller myofibre diameters and reduced absolute forces upon electrical stimulation. RNA-sequencing data illustrated increased expression of DUX4 target genes in 3D-TESMs compared with 2D myotubes, and cellular differentiation was improved by 3D culture conditions. Treatment of 3D-TESMs with three different small molecules identified in drug development screens in 2D muscle cultures showed no improvements, and sometimes even declines, in contractile force and sarcomere organization. These results suggest that these compounds either have a detrimental effect on the formation of 3D-TESMs, an effect that might have been overlooked or was challenging to detect in 2D cultures and in vivo models, and/or that further development of the 3D-TESM model is needed. In conclusion, we have developed a 3D skeletal muscle model for FSHD that can be used for preclinical research focusing on DUX4 expression and downstream pathways of FSHD in relationship to contractile properties. In the future, we expect that this model can also be used for preclinical drug screening.

Keywords: disease modelling; double homeobox 4; facioscapulohumeral muscular dystrophy; human induced pluripotent stem cells; mosaic; three-dimensional tissue engineering.


Conflict of interest statement

E.v.d.W., W.W.M.P.P., S.M.v.d.M. and J.C.d.G. are inventors on a patent in the field of muscle-on-a-chip. S.M.v.d.M. has acted as consultant and/or is a member of the advisory board for several companies that develop therapeutics for FSHD, is co-inventor on several FSHD patent applications and is a Board member for Renogenyx.

Figures

Figure 1
Figure 1
Schematic overview of the formation of 3D-TESMs. (A) Schematic diagram of the formation of non-affected and affected 3D tissue engineered skeletal muscles (3D-TESMs) from mosaic FSHD1 patients. Skin fibroblasts were obtained from mosaic FSHD1 patients and reprogrammed into human induced pluripotent stem cells (hiPSCs). Single hiPSC colonies were picked, expanded and screened for their D4Z4 repeat array by gel electrophoresis and subsequent Southern blotting, and labelled as either FSHD clone (contracted D4Z4 repeat array) or control clone (normal D4Z4 repeat array). Next, hiPSC clones were differentiated into myogenic progenitors (MPs) using a transgene-free myogenic differentiation protocol. MPs were used to generate functional 3D-TESMs. (B) Schematic workflow of the formation of a 3D-TESM in a 24-well plate. MPs were mixed with a hydrogel mixture consisting of fibrinogen and Matrigel. Prior to casting, thrombin was added, and subsequently, the mixture was pipetted into a ‘T-bone’ mould made from polydimethylsiloxane with two flexible pillars, followed by differentiation to a functional 3D-TESM. FSHD = facioscapulohumeral muscular dystrophy type 1.
Figure 2
Figure 2
Characterization of non-affected and affected myogenic progenitors from mosaic FSHD1 patients in 2D myotube cultures. (A) Proliferation curve of genetically matched non-affected (C) and affected (F) myogenic progenitors (MPs) from Patient 1 clone 1 (C1.1 and F1.1), Patient 2 clone 1 (C2.1 and F2.1) and Patient 3 clone 1 (C3.1 and F3.1) in 2D myotube cultures. (B) Cell cycle duration of MPs from A. Each dot represents one biological replicate, and the error bars denote the standard deviation (SD). (C) Time line of MP differentiation in 2D myotube cultures. Cells were grown for 2 days in growth medium, after which the medium was replaced with differentiation medium containing 10 μM SB431542 (TGFβ pathway inhibitor). After 4 days of differentiation, cells were either fixed for immunofluorescence (IF) staining or harvested for RNA. (D) Representative immunofluorescence images of differentiated MPs. Nuclei were stained with Hoechst (blue), and myosin was stained with MF20 (green). (E) Quantification of fusion index [percentage fused nuclei (in myotubes) out of total amount of nuclei] after MP differentiation in 2D myotube cultures. Per cell line, five random fields were analysed. Each dot represents one random field. (FH) Gene expression analyses of DUX4 (F), ZSCAN4 (G) and MYH3 (H) from differentiated MPs in 2D myotube cultures using RT-qPCR. Gene expression is shown as relative expression to the housekeeping gene GUSB. Each dot represents one biological replicate, and the error bars denote the SD. (B and EH) Statistical analysis was performed using Student’s unpaired t-tests. ns = not significant. *P < 0.05, **P < 0.01, ***P < 0.001, ****P < 0.0001. FSHD1 = facioscapulohumeral muscular dystrophy type 1.
Figure 3
Figure 3
Characterization of non-affected and affected myogenic progenitors from mosaic FSHD1 patients in 3D-TESMs differentiated for 14 days. (A) Time line of myogenic progenitor (MP) differentiation into 3D tissue engineered skeletal muscles (3D-TESMs). Cells were grown for 2 days in 3D growth medium, after which the medium was changed to 3D differentiation medium supplemented with 10 μM SB431357 (TGFβ pathway inhibitor). At Day 14 of differentiation, 3D-TESMs were subjected to electrical stimulation for contractile force measurements, after which 3D-TESMs were either fixed for immunofluorescence (IF) staining or harvested for RNA. (B) Relative width sizes of non-affected (C) and affected (F) 3D-TESMs grown from MPs of Patient 1 clone 1 (C1.1 and F1.1), Patient 2 clone 1 (C2.1 and F2.1) and Patient 3 clone 1 (C3.1 and F3.1) over time. Statistical analysis was performed using Student’s unpaired t-tests. Data are shown as the average of 12 3D-TESMs per line, with error bars denoting the standard deviation (SD). Relative width sizes were normalized to Day 0 of differentiation. ns = not significant; *P < 0.05. (CE) Gene expression analyses of MYH3 (C), MYOG (D) and MYOD (E) from non-affected and affected 3D-TESMs by RT-qPCR. Gene expression is shown as relative expression to the housekeeping gene GUSB. Statistical analysis was performed using Student’s unpaired t-tests. Each dot represents one biological replicate, and the error bars denote the SD. ns = not significant. (F) Representative images of whole-mount immunofluorescence staining of 3D-TESMs. Nuclei were stained with Hoechst (blue), and muscle fibres were stained for titin (green). (G) Representative images of cross-sections from non-affected and affected 3D-TESMs. Cross-sections were stained with Hoechst (blue), anti-titin (green) and anti-dystrophin (red) antibodies. FSHD1 = facioscapulohumeral muscular dystrophy type 1.
Figure 4
Figure 4
Differences between non-affected and affected 3D-TESMs from mosaic FSHD1 patients differentiated for 14 days. (A) Absolute forces of non-affected and affected 3D tissue engineered skeletal muscles (3D-TESMs) after electrical stimulation at 1 Hz (twitch; grey bars) and 20 Hz (tetanic; dark grey bars). Each dot represents one biological replicate, and the error bars denote the standard deviation (SD). (B) Specific forces of 3D-TESMs as in A, normalized for their cross-sectional area. Each dot represents one biological replicate, and the error bars denote the SD. (CE) Gene expression analysis of DUX4 (C), ZSCAN4 (D) and TRIM43 (E) in non-affected and affected 3D-TESMs using RT-qPCR. Gene expression is shown as relative expression to the housekeeping gene GUSB. Each dot represents one biological replicate, and the error bars denote the SD. (F) Quantification of the minimal Feret’s myofibre diameter (in μm) from myofibres stained for dystrophin in 3D-TESM cross-sections. A minimum of 450 myofibres was analysed per biological replicate (n ≥ 3) per cell line. Values are shown as the mean ± SD. (G) Representative images of whole-mount-stained 3D-TESMs at ×40 magnification. 3D-TESMs were stained for titin (white). (H and I) Quantification of sarcomere length (in micrometres) (H) and sarcomere organization score (in arbitrary units) (I) using SotaTool software. A minimum of 30 myofibres was analysed per condition from one biological replicate. (AC, F, H and I) Statistical analysis was performed using Student’s unpaired t-tests. ns = not significant, *P < 0.05, **P < 0.01, **P < 0.01, ***P < 0.001, ****P < 0.0001. FSHD1 = facioscapulohumeral muscular dystrophy type 1.
Figure 5
Figure 5
RNA sequencing analysis from 2D and 3D cultures of non-affected and affected myogenic progenitors from mosaic FSHD1 patients. (A) Volcano plots depicting the results of differential gene expression analysis by comparing affected (FSHD) and non-affected (control) samples within the 2D cultures (top) or 3D cultures (bottom). Colour scales depict the log2FoldChange (log2FC) of each gene, and the size of dots shows the value of −log10(adjusted P-value). Genes were classified as differentially expressed when they showed a minimum 1.5-fold expression change [|log2(FC)| > log2(1.5)] and statistical significance (adjusted P-value <0.05). (B) Scatter plot showing the log2FC difference of each gene between 2D culture and 3D culture. Colour scales depict the log2FC difference. Red represents the larger difference in log2FC in 3D culture and green represents the larger difference in log2FC in 2D culture. (C) Heat map showing the expression level of detected DUX4 target genes in each RNA-sequencing sample. The data were normalized in TMM using DEseq2. Colour scales depict the expression level normalized in z-score. -FSHD1 = facioscapulohumeral muscular dystrophy type 1.
Figure 6
Figure 6
Treatment of affected myogenic progenitors from mosaic FSHD1 patients in 2D myotube cultures with DUX4 inhibitors. (A) Time line of treatment of myogenic progenitors (MPs) in 2D myotube cultures. Cells were grown for 2 days in proliferation medium, after which medium was changed to 2D differentiation medium containing DUX4 inhibitors. MPs were differentiated and treated for 4 days, after which they were harvested for RNA. (BD) Gene expression analyses of DUX4 (C), ZSCAN4 (D) and MYH3 (E) in differentiated MPs of Patient 2 FSHD clone 1 in 2D myotube cultures after treatment with CK1 (final concentration ranging from 250 to 5000 nM), pamapimod (Pam; final concentration ranging from 0.1 to 1000 nM) or rebastinib (Reb; final concentration ranging from 30 to 3000 nM), using RT-qPCR. Gene expression is shown as relative expression to the housekeeping gene GUSB. Each dot represents one biological replicate, and the error bars denote the standard deviation. Significance was determined using one-way ANOVA with Bonferroni multiple comparison correction for DMSO-treated 3D tissue engineered skeletal muscles. ns = not significant, *P < 0.05, **P < 0.01, ***P < 0.001. FSHD1 = facioscapulohumeral muscular dystrophy type 1.
Figure 7
Figure 7
Treatment of non-affected and affected myogenic progenitors from mosaic FSHD1 patients in 3D-TESMs with DUX4 inhibitors for 4 days. Non-affected and affected 3D tissue engineered skeletal muscles (3D-TESMs) of mosaic FSHD1 Patient 3 (C3.1 and F3.1) were non-treated (NT) or treated daily starting at initiation of differentiation for 4 days with DMSO, CK1 inhibitor (final concentration 250 and 500 nM), pamapimod (Pam; final concentrations 100 and 1000 nM) or rebastinib (Reb; 30 and 300 nM). (A) Time line of treatment of 3D-TESMs. Cells were grown for 2 days in proliferation medium, after which the medium was changed to 3D differentiation medium supplemented with 10 μM SB431542 and DUX4 inhibitors. Differentiation medium containing DUX4 inhibitors was replaced every day. On Day 4 of differentiation, 3D-TESMs were subjected to electrical stimulation for contractile force measurements. Thereafter, 3D-TESMs were either fixed for immunofluorescence (IF) staining or harvested for RNA. (B) Absolute forces after electrical stimulation at 1 Hz (twitch; grey bars) or 20 Hz (tetanic; dark grey bars). Each dot represents one biological replicate, and the error bars denote the standard deviation (SD). (CE) Gene expression analyses of MYH3 (C), DUX4 (D) and ZSCAN4 (E) from treated C3.1 and F3.1 3D-TESMs using RT-qPCR. Gene expression is shown as relative expression to the housekeeping gene GUSB. Each dot represents one biological replicate, and the error bars denote the SD. (F) Representative images of whole-mount staining of treated 3D-TESMs from C3.1 and F3.1. Immunofluorescence (IF) staining was performed with Hoechst (blue) and anti-titin (green). (G and H) Quantification of sarcomere length (in μm) (G) and sarcomere organization score (in arbitrary units) (H) of single fibres from images shown in F using SotaTool software. For each condition, a minimum of seven fibres was analysed from one biological replicate. (BE, G and H) Significance was determined using one-way ANOVA with Bonferroni multiple comparison correction for DMSO-treated non-affected (B, G and H) or affected (CE) 3D-TESMs. ns = not significant. *P < 0.05, **P < 0.01, ***P < 0.001, ****P < 0.0001. FSHD1 = facioscapulohumeral muscular dystrophy type 1.

References

    1. Bonne G, Rivier F, Hamroun D. GeneTable of Neuromuscular Disorders. Accessed 17 June 2024. https://www.musclegenetable.fr/4DACTION/Blob_groupe11
    1. Deenen JC, Arnts H, van der Maarel SM, et al. . Population-based incidence and prevalence of facioscapulohumeral dystrophy. Neurology. 2014;83:1056–1059. - PMC - PubMed
    1. Mostacciuolo ML, Pastorello E, Vazza G, et al. . Facioscapulohumeral muscular dystrophy: Epidemiological and molecular study in a north-east Italian population sample. Clin Genet. 2009;75:550–555. - PubMed
    1. Padberg GWAM. Facioscapulohumeral disease. Leiden University; 1982. https://hdl.handle.net/1887/25818
    1. Lemmers RJ, van der Vliet PJ, Klooster R, et al. . A unifying genetic model for facioscapulohumeral muscular dystrophy. Science. 2010;329:1650–1653. - PMC - PubMed

MeSH terms