. 2024 Nov 18;15(1):9917.
doi: 10.1038/s41467-024-53996-7.

Improved safety of chimeric antigen receptor T cells indirectly targeting antigens via switchable adapters

Affiliations

Improved safety of chimeric antigen receptor T cells indirectly targeting antigens via switchable adapters

Hyung Bae Park et al. Nat Commun. .

Abstract

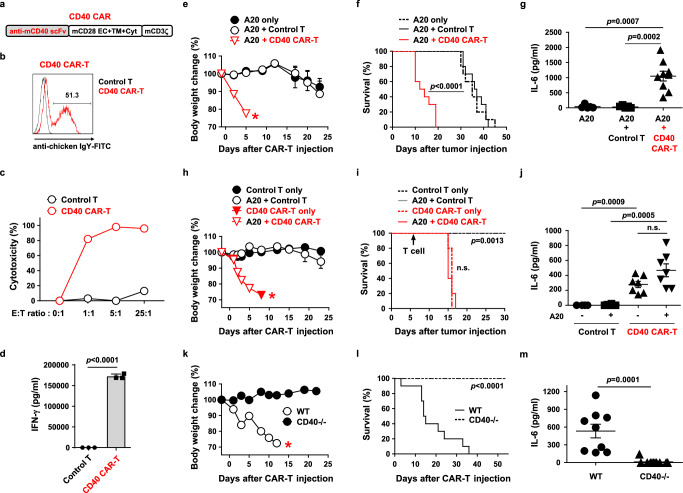
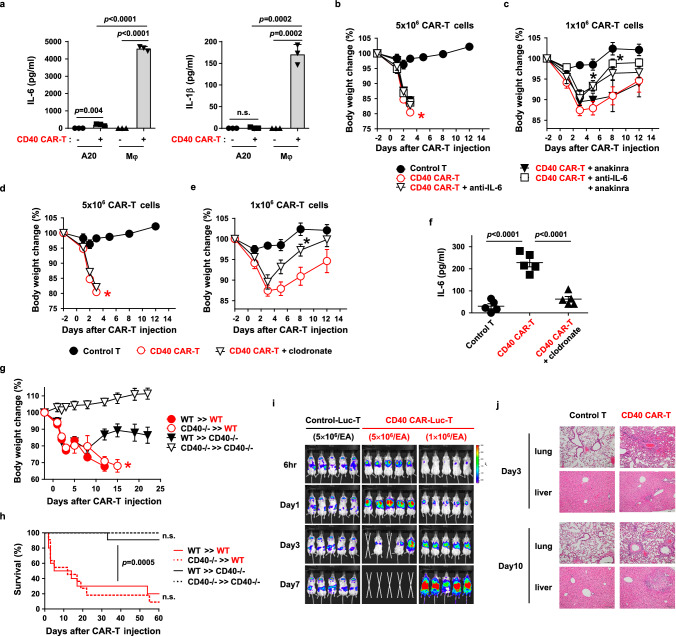
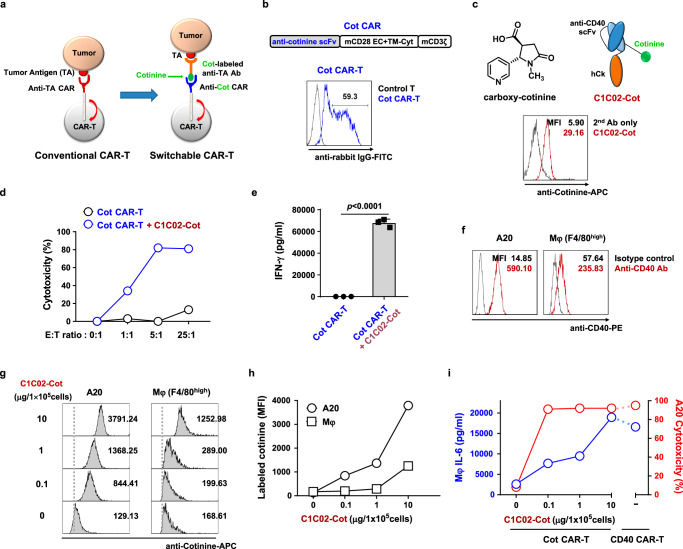
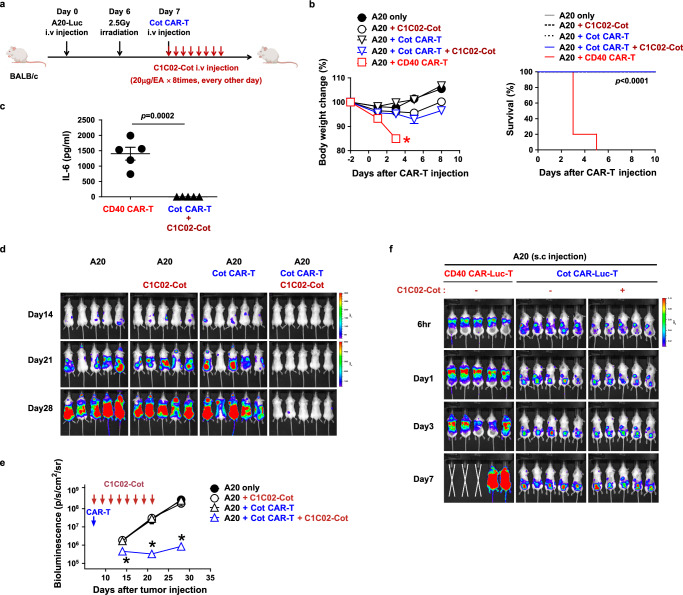
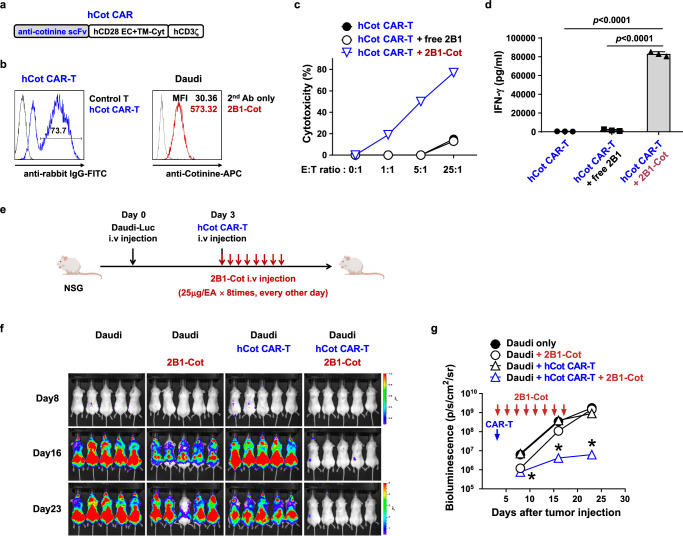
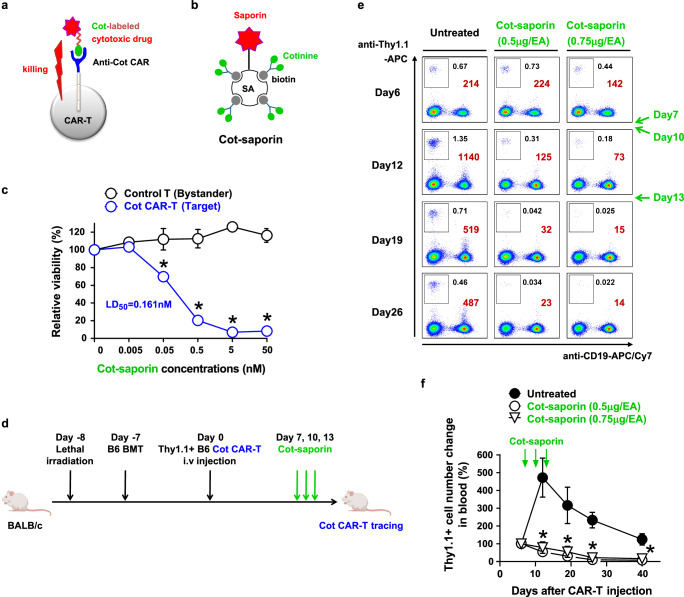
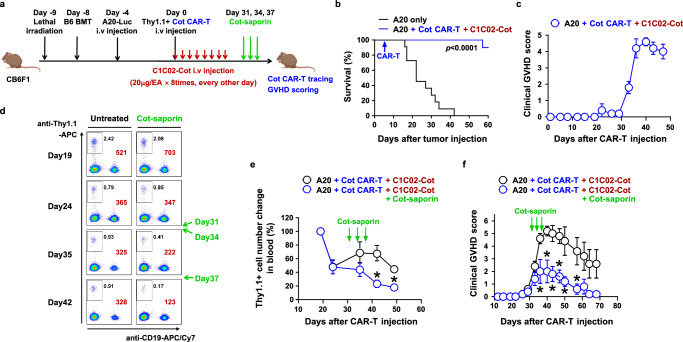
Chimeric antigen receptor T (CAR-T) cells show remarkable efficacy for some hematological malignancies. However, CAR targets that are expressed at high level and selective to tumors are scarce. Several strategies have been proposed to tackle the on-target off-tumor toxicity of CAR-T cells that arise from suboptimal selectivity, but these are complicated, with many involving dual gene expression for specificity. In this study, we show that switchable CAR-T cells with a tumor targeting adaptor can mitigate on-target off-tumor toxicity against a low selectivity tumor antigen that cannot be targeted by conventional CAR-T cells, such as CD40. Our system is composed of anti-cotinine murine CAR-T cells and cotinine-labeled anti-CD40 single chain variable fragments (scFv), with which we show selective tumor killing while sparing CD40-expressing normal cells including macrophages in a mouse model of lymphoma. Simple replacement of the tumor-targeting adaptor with a suicidal drug-conjugated tag may further enhance safety by enabling permanent in vivo depletion of the switchable CAR-T cells when necessary. In summary, our switchable CAR system can control CAR-T cell toxicity while maintaining therapeutic efficacy, thereby expanding the range of CAR targets.


Conflict of interest statement

Competing interests K.C. and E.Y.C. are founders and shareholders of Ticaros Inc. H.B.P., J.E.L., and G.R.J. are currently employees of Ticaros. K.C., J.C., H.B.P., K.H.K., S.I.K., and G.R.J. are co-inventors on the pending patent for anti-CD40 switchable CAR T cells. The other authors declare no competing interests.

Figures

Fig. 1
Fig. 1. Murine CD40 CAR-T cells show lethal on-target off-tumor toxicity in a syngeneic lymphoma model.
a Schematic diagram of the murine CD40 CAR construct. EC, extracellular; TM, transmembrane; Cyt, cytoplasmic domain. b Representative flow cytometry plot of CD40 CAR expression on mouse T cells 4 days after transduction. c Cytotoxicity of CD40 CAR-T cells against A20 cells. d IFN-γ production after co-culture of control T cells or CD40 CAR-T cells with A20 cells for 24 h, measured in triplicate. Results are representative of three independent experiments (c, d). eg Balb/C mice were injected i.v. with A20-Luc cells (1 × 106) on day 0, irradiated (2.5 Gy) for lymphodepletion on day 6, and injected i.v. with control T or CD40 CAR-T cells (5 × 106) on day 7. Body weight change (e, n = 5) and survival (f, n = 10) were measured. Serum levels of IL-6 were measured three days after T cell injection (g, n = 9). Each dot represents the value of a single mouse. hj The same experiments as in eg were performed including the groups not injected with A20-Luc cells. Body weight change (h, n = 5), survival (i, n = 5), and serum levels of IL-6 (j, n = 7) were measured. km Wild-type and CD40 knockout B6 mice were irradiated (3 Gy) on day 6 and injected i.v. with CD40 CAR-T cells (5 × 106) on day 7. Body weight change (k, n = 5), survival (l, n = 10), and serum levels of IL-6 (m, n = 9) were measured. Measurements of body weight were halted when the mice began to die (red asterisks in e, h, k). Data in (e, h, i, and k) are representative of at least two independent experiments. Data in (f, g, j, l, and m) are pooled from two replicate experiments. Data in (d, e, g, h, j, k, and m) are presented as mean ± SEM. Statistical significance was determined by either the log-rank (Mantel-Cox) test (f, i, l) or the unpaired two-tailed t test (d, g, j, m). p: p-value, n.s.: not significant. Source data are provided in the Source Data file.
Fig. 2
Fig. 2. Both hematopoietic and non-hematopoietic expression of CD40 contribute to on-target off-tumor toxicity.
a Production of IL-6 or IL-1β after co-culture of CD40 CAR-T cells with A20 or peritoneal macrophages (Mφ) for 24 h, measured in triplicate. Results are representative of three independent experiments. bf Balb/C mice were irradiated (2.5 Gy) for lymphodepletion on day -1 and injected with 5 × 106 (b, d, f) or 1 × 106 (c, e) control T cells or CD40 CAR-T cells on day 0. IL-6 or IL-1β neutralization (b, c) and phagocyte depletion (df) were performed as described in “Methods”. Body weight change (be, n = 5) and serum levels of IL-6 (f, n = 5) were measured. Each dot in (f) represents the value of a single mouse. *: p = 0.0211 on day 5, p = 0.0187 on day 8 (c), and p = 0.0029 on day 8 (e), compared to CD40 CAR‐T group. g, h BM chimeras were established (e.g., CD40-/-»WT denotes the transfer of donor BMs from CD40-knockout mice to B6 wild-type recipients). After 8 weeks, chimeric mice were irradiated (2.5 Gy) on day -1 and injected with CD40 CAR-T cells (5 × 106) on day 0. Body weight change (g, n = 5) and survival (h, n = 10) were measured. p for WT»CD40-/- versus WT»WT (h). i Balb/C mice were irradiated (2.5 Gy) on day -1 and injected with GFP-efflux T (control-Luc-T) or CD40 CAR-efflux T cells (CD40 CAR-Luc-T) (5 or 1 × 106) on day 0. In vivo, the distribution of injected T cells was visualized by bioluminescence imaging. j Histology of lung and liver was examined by H&E staining 3 and 10 days after CAR-T (1 × 106) injection (100× magnification, scale bar: 200 μm). Measurements of body weight were halted when the mice began to die (red asterisks in b, d, g). Data in (h) are pooled from two replicate experiments. All other data are representative of at least two independent experiments. Data in ag are presented as mean ± SEM. Statistical significance was determined by 1-way ANOVA (c, e), unpaired two-tailed t test (f), or log-rank (Mantel-Cox) test (h). p: p-value, n.s.: not significant. Source data are provided in the Source Data file.
Fig. 3
Fig. 3. Cotinine-labeled anti-CD40 scFv can be used as a dose-adjustable adapter for switchable Cot CAR-T cells in vitro.
a Scheme of conventional CAR-T and switchable CAR-T cells. b Schematic diagram of the murine Cot CAR construct and a representative flow cytometry plot of Cot CAR expression on mouse T cells 4 days after transduction. c Chemical structure of carboxy cotinine (top left). Schematic diagram of cotinine-labeled anti-mouse CD40 scFv-Cκ (C1C02-Cot) (top right). Representative flow cytometry plot of binding of C1C02-Cot to A20 cells (bottom). d Cytotoxicity of Cot CAR-T cells against A20 cells preincubated with C1C02-Cot. e IFN-γ production after co-culture of Cot CAR-T cells with A20 cells preincubated with C1C02-Cot for 24 h, measured in triplicate. Data are presented as mean ± SEM. Statistical significance was determined by an unpaired two-tailed t test. Results are representative of three independent experiments (d, e). f CD40 expression levels in A20 cells and F4/80 (+) peritoneal macrophages (Mφ) as determined by staining with a commercially available anti-mouse CD40 antibody. g, h Comparison of dose-dependent cell binding affinity of C1C02-Cot between A20 and macrophage. Mean fluorescence intensities (MFIs) of binding are shown as values within the plot (g) and as a graph (h). i For toxicity readouts, macrophages were preincubated with various concentrations of C1C02-Cot and co-cultured with Cot CAR-T or CD40 CAR-T cells for 24 h. The amount of IL-6 in culture supernatants was measured (mean ± SEM, left axis and blue lines). For efficacy readouts, A20 cells (target) were preincubated with various concentrations of C1C02-Cot and then co-cultured with Cot CAR-T cells (effector) at an E:T ratio of 5:1 for 6 h. CD40 CAR-T cells were co-cultured with target cells not treated with C1C02-Cot. Percent cytotoxicity was calculated from flow cytometry-based viable cell counting (right axis and red lines). Results in gi are representative of at least two independent experiments. p: p-value. Source data are provided in the Source Data file.
Fig. 4
Fig. 4. Anti-mouse CD40 switchable CAR-T cells eliminate lymphoma cells in vivo without overt toxicity.
a Experimental scheme for the treatment of murine B-cell lymphoma using syngeneic Cot CAR-T cells. Balb/C mice were injected i.v. with A20-Luc cells (1 × 106) on day 0, irradiated (2.5 Gy) for lymphodepletion on day 6, and injected with Cot CAR-T cells (5 × 106) on day 7. From the day of CAR-T cell injection, C1C02-Cot (20 μg/head) was injected i.v. every other day for a total of 8 times. b Body weight change (n = 5) and survival (n = 5) were measured. Measurements of body weight were halted when the mice began to die (red asterisk). c Serum levels of IL-6 were measured 3 days after CAR-T injection (n = 5). Each dot represents the value of a single mouse. Statistical significance was determined by log-rank (Mantel-Cox) test (b) and unpaired two-tailed t test (c). d, e Bioluminescence imaging of tumor burden at indicated time points after A20-Luc cell injection (d). Bioluminescence intensity is calculated as the mean flux (p/s/cm2/sr) of a region of interest (ROI) in an individual mouse. Statistical significance between groups at each time point (n = 5) was determined by the nonparametric Kruskal-Wallis test (e). *: p = 0.0172 on day 14, p = 0.011 on day 21, and p = 0.0115 on day 28, compared to A20 only group. f In vivo CAR-T tracing using luciferase-expressing CAR-T cells and bioluminescence imaging. Balb/C mice were injected s.c. on the back with A20 cells. When tumor mass was detectable at the injection site, mice were irradiated (2.5 Gy) and injected the next day with CD40 CAR-Luc-T cells or Cot CAR-Luc-T cells (5 × 106) with or without C1C02-Cot injection every other day. Bioluminescence imaging was performed at the indicated time points after CAR-T cell injection. Data in (b, c, and e) are presented as mean ± SEM. Results are representative of at least three (b, d, e) or two (c, f) independent experiments. p: p-value. Source data are provided in the Source Data file.
Fig. 5
Fig. 5. Anti-tumor efficacy of anti-CD40 switchable CAR-T cells is recapitulated with an anti-human CD40 adapter and human Cot CAR-T cells in vivo.
a Schematic diagram of the hCot CAR construct. b Representative flow cytometry plot of Cot-CAR expression on human T cells 5 days after transduction (left); cotinine-labeled 2B1-Cκ (2B1-Cot) binding to Daudi cells (right). c Cytotoxicity of hCot CAR-T cells against Daudi cells preincubated with 2B1-Cκ (free 2B1) or 2B1-Cot. d IFN-γ production after co-culture of hCot CAR-T cells with Daudi cells preincubated with free 2B1 or 2B1-Cot for 24 h, measured in triplicate. Statistical significance was determined by an unpaired two-tailed t test. Results are representative of three independent experiments (c, d). e Experimental scheme for the treatment of human B-cell lymphoma xenografts with hCot CAR-T cells. NSG mice were injected i.v. with Daudi-Luc cells (5 × 105) on day 0 and hCot CAR-T cells (1 × 107) on day 3. From the day of CAR-T cell injection, 2B1-Cot (25 μg/head) was injected i.v. every other day for a total of 8 times. f, g Bioluminescence imaging of tumor burden at the indicated time points after Daudi-Luc cell injection (f). Bioluminescence intensity is calculated as the mean flux (p/s/cm2/sr) of a region of interest (ROI) in an individual mouse (g). Statistical significance between groups at each time point (n = 5) was determined by the nonparametric Kruskal-Wallis test. *: p = 0.0019 on day 8, p = 0.001 on day 16, and p = 0.0025 on day 23, compared to Daudi only group. Results are representative of at least two independent experiments. Data in (d and g) are presented as mean ± SEM. p: p-value. Source data are provided in the Source Data file.
Fig. 6
Fig. 6. Anti-cotinine CAR can be used as a suicidal receptor using a cotinine-drug conjugate.
a Scheme of Cot CAR-T cell suicide induced by a cotinine-labeled cytotoxic drug. b Schematic diagram of cotinine-labeled saporin (Cot-saporin). c In vitro toxicity of Cot-saporin on murine Cot CAR-T cells. Labeled control T cells (bystander) and unlabeled Cot CAR-T cells (target) were mixed in a 1:1 ratio and incubated with serial dilutions of Cot-saporin. After 48 h in a medium containing IL-2, viable bystander and target cells were counted, and viability was calculated as described in Methods. LD50 value is defined as the dose at which Cot-saporin was lethal for 50% of Cot CAR-T cells. Statistical significance was determined by unpaired two‐tailed t test (n = 3, p = 0.0059 at 0.05 nM, p = 0.0002 at 0.5 nM, and p < 0.0001 at 5 nM and 50 nM). d Experimental scheme for in vivo depletion of allogeneic Cot CAR-T cells by Cot-saporin treatment. Lethally irradiated Balb/C mice were injected with T cell-depleted B6 BM cells. After 7 days, Cot CAR-T cells derived from Thy1.1-congenic B6 mice were sorted and injected i.v. into the mice. Cot-saporin (0.5 or 0.75 μg/head) was injected intraperitoneally three times at 3-day intervals from 7 days after CAR-T cell injection. e Cot CAR-T cells were traced by flow cytometry from 6 days after CAR-T cell transfer. Numbers are percentages (black) or absolute numbers (brown) of Cot CAR-T cells (boxes, Thy1.1+CD19- cells) in a fixed volume (7 μl) of peripheral blood. f Relative kinetics of Cot CAR-T cell expansion in peripheral blood. Absolute numbers of Cot CAR-T cells at each time point in (e) were normalized to the numbers on day 6. Statistical significance between groups at each time point was determined by 1-way ANOVA (n = 5, *: p = 0.0011 on day 12, p = 0.0122 on day 19, p < 0.0001 on day 26, and p = 0.0015 on day 40, compared to the untreated group). Data in (c and f) are presented as mean ± SEM. Results are representative of two independent experiments (c, e, f). p: p-value. Source data are provided in the Source Data file.
Fig. 7
Fig. 7. Cotinine-drug conjugate can eliminate allogeneic CAR-T cells after tumor eradication to reduce GVHD side effect.
a Experimental scheme for alleviation of GVHD by Cot-Saporin in an allogeneic Cot CAR-T cell therapy model in haploidentical HSCT recipients. Lethally irradiated CB6F1 mice were injected with T cell-depleted B6 BM cells. After 4 days, A20-Luc cells were injected to mimic tumor recurrence after HSCT. Four days later, Cot CAR-T cells derived from Thy1.1-congenic B6 mice and C1C02-Cot proteins were administered as in Fig. 4a for tumor eradication. b, c Survival (b, n = 10) and clinical GVHD score (c, n = 5) were monitored periodically. Survival data were pooled from two replicate experiments. df The same experiment as in (b, c) was performed except that when GVHD began to develop after CAR-T cell injection, Cot-saporin (0.5 μg/head) was administered intraperitoneally three times at 3-day intervals (days 31, 34, and 37 after CAR-T cell injection). Cot CAR-T cells were traced by flow cytometry from 19 days after CAR-T cell transfer. Numbers are percentages (black) or absolute numbers (brown) of Cot CAR-T cells (boxes, Thy1.1+CD19- cells) in a fixed volume (7 μl) of peripheral blood (d). Relative kinetics of Cot CAR-T cell expansion in peripheral blood (e). Absolute numbers of Cot CAR-T cells at each time point in (d) were normalized to the numbers on day 19 (n = 5). *: p = 0.0053 on day 42 and p = 0.0015 on day 49. Clinical GVHD score (n = 5) was monitored periodically (f). *: p = 0.0355 on day 36, p = 0.0108 on day 40, p = 0.0059 on day 43, p = 0.0033 on day 47, p = 0.0269 on day 50, and p = 0.0311 on day 57. Data in (c, e, f) are presented as mean ± SEM. Statistical significance was determined by log-rank (Mantel-Cox) test (b) or by unpaired two-tailed t test (e, f). Results are representative of at least two independent experiments (bf). p: p-value. Source data are provided in the Source Data file.

References

    1. Kershaw, M. H., Teng, M. W., Smyth, M. J. & Darcy, P. K. Supernatural T cells: genetic modification of T cells for cancer therapy. Nat. Rev. Immunol.5, 928–940 (2005). - PubMed
    1. Maude, S. L. et al. Chimeric antigen receptor T cells for sustained remissions in leukemia. N. Engl. J. Med.371, 1507–1517 (2014). - PMC - PubMed
    1. Gill, S. & Brudno, J. N. CAR T-Cell therapy in hematologic malignancies: Clinical role, toxicity, and unanswered questions. Am. Soc. Clin. Oncol. Educ. Book41, 1–20 (2021). - PubMed
    1. Rafiq, S., Hackett, C. S. & Brentjens, R. J. Engineering strategies to overcome the current roadblocks in CAR T cell therapy. Nat. Rev. Clin. Oncol.17, 147–167 (2020). - PMC - PubMed
    1. Lamers, C. H. et al. Treatment of metastatic renal cell carcinoma with CAIX CAR-engineered T cells: clinical evaluation and management of on-target toxicity. Mol. Ther.21, 904–912 (2013). - PMC - PubMed

Publication types

MeSH terms

LinkOut - more resources