. 2024 Nov 18;9(1):326.
doi: 10.1038/s41392-024-02019-4.

EphrinB2-mediated CDK5/ISL1 pathway enhances cardiac lymphangiogenesis and alleviates ischemic injury by resolving post-MI inflammation

Affiliations

EphrinB2-mediated CDK5/ISL1 pathway enhances cardiac lymphangiogenesis and alleviates ischemic injury by resolving post-MI inflammation

Yingnan Bai et al. Signal Transduct Target Ther. .

Abstract

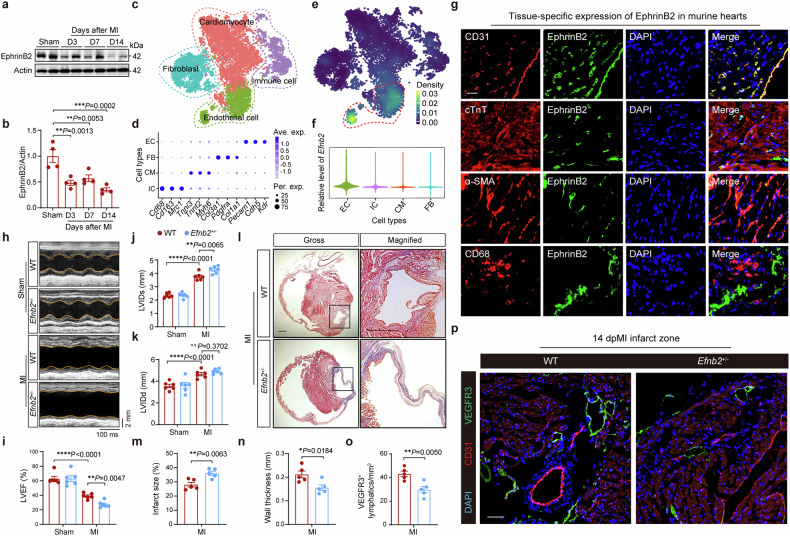
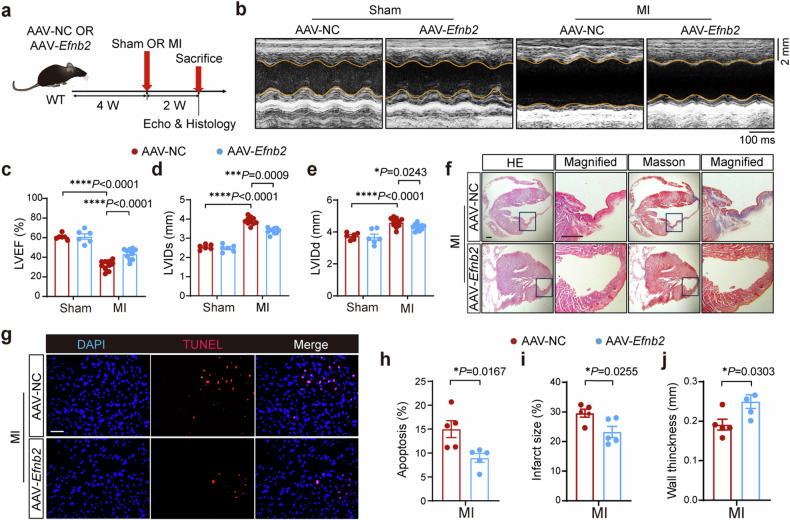
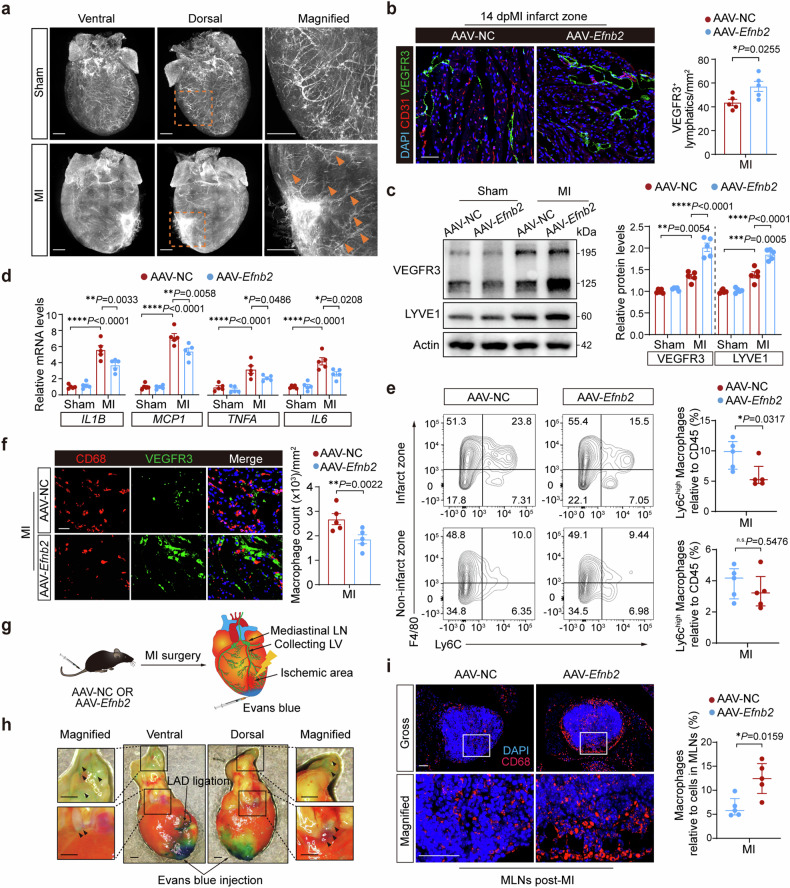
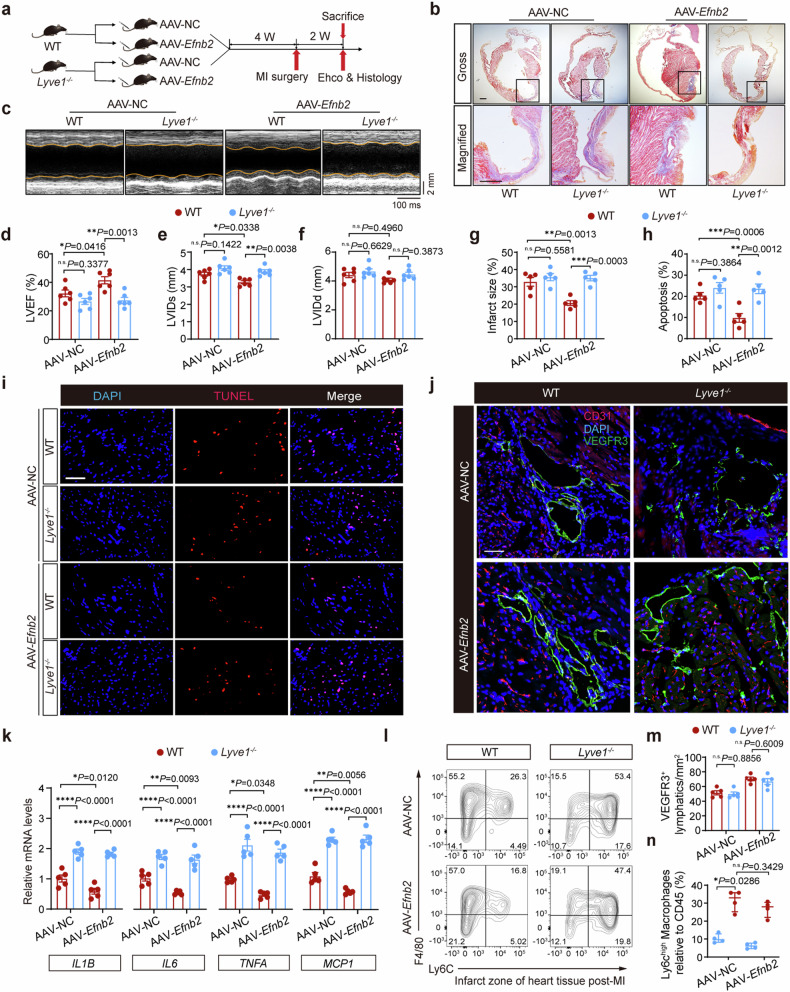
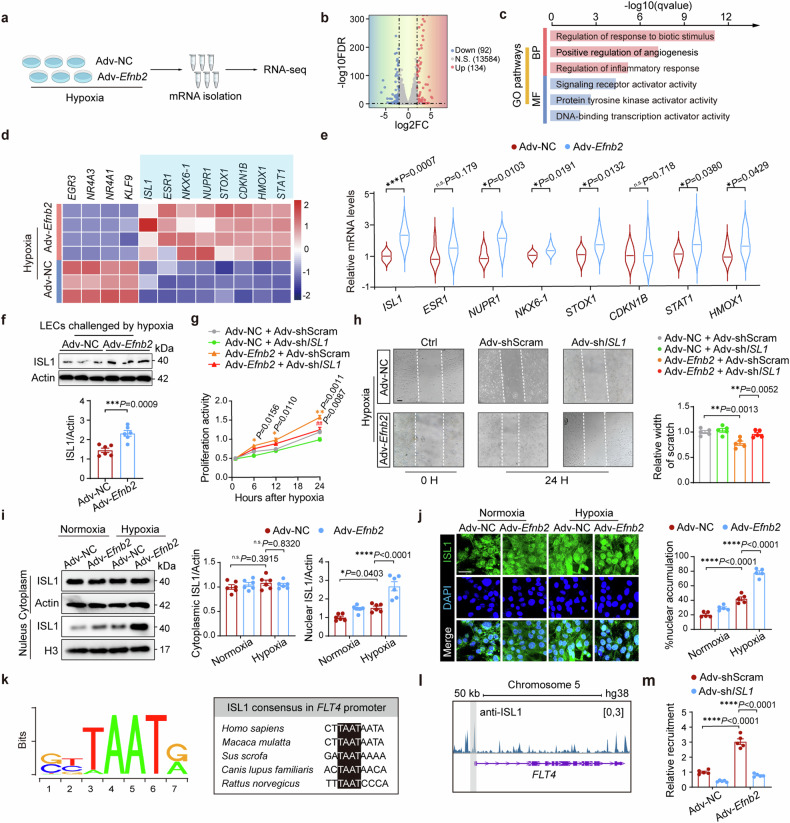
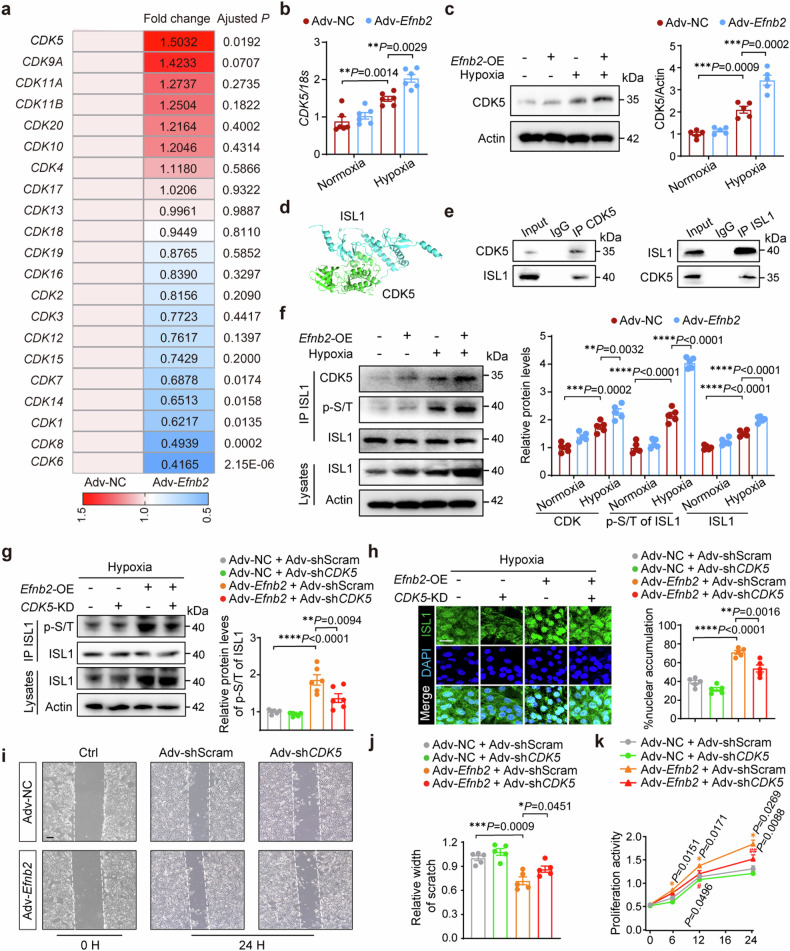
EphrinB2 (erythropoietin-producing hepatoma interactor B2) is a key Eph/ephrin family member, promoting angiogenesis, vasculogenesis, and lymphangiogenesis during embryonic development. However, the role of EphrinB2 in cardiac lymphangiogenesis following myocardial infarction (MI) and the potential molecular mechanism remains to be demonstrated. This study revealed that EphrinB2 prevented ischemic heart post-MI from remodeling and dysfunction by activating the cardiac lymphangiogenesis signaling pathway. Deletion of EphrinB2 impaired cardiac lymphangiogenesis and aggravated adverse cardiac remodeling and ventricular dysfunction post-MI. At the same time, overexpression of EphrinB2 stimulated cardiac lymphangiogenesis which facilitated cardiac infiltrating macrophage drainage and reduced inflammation in the ischemic heart. The beneficial effects of EphrinB2 on improving clearance of inflammatory response and cardiac function were abolished in Lyve1 knockout mice. Mechanistically, EphrinB2 accelerated cell cycling and lymphatic endothelial cell proliferation and migration by activating CDK5 and CDK5-dependent ISL1 nuclear translocation. EphrinB2 enhanced the transcriptional activity of ISL1 at the VEGFR3 (FLT4) promoter, and VEGFR3 inhibitor MAZ51 significantly diminished the EphrinB2-mediated lymphangiogenesis and deteriorated the ischemic cardiac function. We uncovered a novel mechanism of EphrinB2-driven cardiac lymphangiogenesis in improving myocardial remodeling and function after MI.


Conflict of interest statement

Conflict of interest The authors declare no competing interests.

Figures

Fig. 1
Fig. 1
A key role of EphrinB2 in cardiac lymphangiogenesis after acute myocardial infarction (AMI). a Representative immunoblotting images showing EphrinB2 protein levels in the hearts of wild-type (WT) mice subjected to sham or MI operation (at 3, 7, and 14 days after operation). b Quantification of a normalized to Actin and presented relative to the sham group (n = 4 per group). c t-distributed stochastic neighbor embedding (t-SNE) plot showing the cardiac cells isolated from murine hearts that were clustered into four cell populations using the single-cell RNA sequencing data (GSE120064). Colors indicate different cell populations. d Dot plot showing feature genes for the four cell populations. e Feature plot showing the transcriptional expression of Efnb2 in each cell. Colors denote the relative expression of Efnb2. f Violin plot showing the transcriptional expression of Efnb2 across the four cell populations. g Representative immunofluorescence staining images showing myocardium co-stained by EphrinB2 (green) and DAPI (blue) with CD31 (red), cTnT (red), αSMA (red) and CD68 (red), respectively. Scar bar: 20 μm. h Representative M-mode echocardiographic images showing the cardiac function of Efnb2+/− mice and their WT littermates after sham or MI operation. The yellow lines indicate the endocardium of the anterior and posterior walls at mid-papillary muscle level. ik Quantification of echocardiographic parameters in h (LVEF, LVIDs, and LVIDd, n = 6 per group). l Representative histological images showing infarct and fibrosis area of Efnb2+/− mice and their WT littermates after MI operation assessed by Masson Trichrome staining. Magnified views of black boxes are shown in the right lane. Scar bar: 1 mm. m, n Quantification of infarct size of myocardium and wall thickness of the infarct area (n = 5 per group). o Quantification of p (n = 5 per group). (p) Representative immunofluorescence images showing myocardium co-stained by CD31 (red), VEGFR3 (green), and DAPI (blue) of Efnb2+/− mice and their WT littermates after MI operation. Scar bar: 50 μm. *P < 0.05, **P < 0.01, ***P < 0.001, ***P < 0.0001. b by Kruskal–Wallis with Dunn test, ik by one-way ANOVA with Tukey posthoc test, and mo by unpaired Student’s test. D days, ave. exp. average expression, per. exp., percent expresse, LVEF left ventricularejection fraction, LVIDs left ventricular internal dimension during systole, LVIDd left ventricular internal dimension during diastole, DAPI 4’,6-diamidino-2-phenylindole, and TUNEL terminal deoxynucleotidyl transferase-mediated dUTP-biotin nick end labeling
Fig. 2
Fig. 2
Overexpression of EphrinB2 improved cardiac function post-MI. a Schematic diagram depicting the experimental strategy for EphrinB2 overexpression. b Representative M-mode echocardiographic images showing the cardiac function of WT mice that were injected with AAV-NC or AAV-Efnb2 after sham or MI operation. The yellow lines indicate the endocardium of the anterior and posterior walls at mid-papillary level. ce Quantification of echocardiographic parameters in b (LVEF, LVIDs, and LVIDd, n = 6-10 per group). f Representative histological images showing infarct and fibrosis area of WT mice that were injected with AAV-NC or AAV-Efnb2 after sham or MI operation assessed by HE and Masson Trichrome staining. Magnified views of black boxes are shown at the right of gross views. Scar bar: 500 μm. g Representative TUNEL staining images showing cell apoptosis in the hearts from indicated groups. Scar bar: 50 μm. h Quantification of g (n = 5 per group). i, j Quantification of infarct size of the myocardium and wall thickness of the infarct area in f (n = 5 per group). *P < 0.05, **P < 0.01, ***P < 0.001, ****P < 0.0001. ce by one-way ANOVA with Tukey post-hoc test, and hj by unpaired Student’s test. AAV adeno-associated virus serotype, NC negative control, HE hematoxylin and eosin, LVEF left ventricular ejection fraction, LVIDs left ventricular internal dimension during systole, LVIDd left ventricular internal dimension during diastole, DAPI 4’,6-diamidino-2-phenylindole and TUNEL terminal deoxynucleotidyltransferase-mediated dUTP-biotin nick end labeling
Fig. 3
Fig. 3
Overexpression of EphrinB2 promotes cardiac lymphangiogenesis and reduces cardiac inflammation post-MI. a Whole mount imaging showing endogenous tdTomato (white) fluorescence in the hearts from Lyve1-Cre; Rosa26-tdTomato mice after sham or MI operation. Magnified views of yellow dashed boxes are shown in the right lane. The yellow arrows highlight the lymphatics in the infarct area and border zone. Scar bar: 1 mm. b (Left) Representative immunofluorescence staining images showing myocardium co-stained by CD31 (red), VEGFR3 (green), and DAPI (blue) of mice injected with AAV-Efnb2 or AAV-NC after MI operation. Scar bar: 50 μm. (Right) Quantification of VEGFR3+ lymphatics (n = 5 per group). c (Left) Representative immunoblotting images showing the protein levels of VEGFR3 and LYVE1 in the hearts from indicated groups. (Right) Quantification of immunoblotting results normalized to Actin and presented relative to the AAV-NC group (n = 5 per group). d Real-time quantitative reverse transcription polymerase chain reaction (RT-qPCR) analysis determining the mRNA expressions of pro-inflammatory genes in the hearts of mice that were injected with AAV-NC or AAV-Efnb2 at day 7 post-operation (n = 5 per group). e (Left) Fluorescence-activated cell sorter (FACS) analysis of CD45+CD11b+Ly6GF4/80+Ly6Chigh macrophages in the murine hearts at day 7 post-MI. (Right) Quantification of CD45+CD11b+Ly6GF4/80+Ly6Chigh macrophages as the percentage of CD45+ cells (n = 5 per group). f Representative immunofluorescence staining images showing the myocardium co-stained by CD68 (red), VEGFR3 (green), and DAPI (blue) in indicated groups. Scar bar: 20 μm. g Schematic diagram depicting the experimental strategy for Evans blue injection from cardiac apex to lymph nodes through the lymphatic system. h Representative heart images of Evans blue in the mediastinal lymph nodes and lymphatics. Scar bar: 1 mm. i (Left) Representative immunofluorescence staining images showing mediastinal lymph node co-stained by CD68 (red) and DAPI (blue) in indicated groups. Scar bar: 50 μm. (Right) Quantification of CD68+ macrophages as the percentage of cells in MLNs. *P < 0.05, **P < 0.01, ***P < 0.001, ****P < 0.0001. c, d by one-way ANOVA with Tukey post-hoc test, b by unpaired Student’s test, and e and i by Mann–Whitney U test. MLN mediastinal lymphatic node, and LV lymphatic vessel
Fig. 4
Fig. 4
Lyve1 deficiency abrogates the anti-inflammatory effects of EphrinB2 post-MI. a Schematic diagram depicting the experimental strategy for EphrinB2 overexpression in Lyve1−/− mice and their WT littermates. b Representative histological images from Lyve1−/− mice and their WT littermates that were injected with AAV-NC or AAV-Efnb2 assessed by Masson Trichrome staining. Magnified views of black boxes are shown in the bottom lane. Scar bar: 1 mm. c Representative M-mode echocardiographic images showing the cardiac function of Lyve1−/− mice and their WT littermates that were injected with AAV-NC or AAV-Efnb2. The yellow lines indicate the endocardium of the anterior and posterior walls at mid-papillary muscle level. df Quantification of echocardiographic parameters in c (LVEF, LVIDs, and LVIDd, n = 6 per group). g Quantification of infarct size of myocardium in b (n = 5 per group). h Quantification of apoptotic cells as percentage of all cells in i. i Representative TUNEL staining images showing cell apoptosis in indicated groups. Scar bar: 50 μm. j Representative immunofluorescence staining images showing the myocardium co-stained by CD31 (red), VEGFR3 (green), and DAPI (blue) in indicated groups. Scar bar: 50 μm. k Real-time quantitative reverse transcription polymerase chain reaction (RT-qPCR) analysis determining the mRNA expressions of pro-inflammatory genes in the hearts in indicated groups at day 7 post-MI (n = 5 per group). l (Left) Fluorescence-activated cell sorter (FACS) analysis of CD45+CD11b+Ly6GF4/80+Ly6Chigh macrophages in the murine hearts at day 7 post-MI. m Quantification of the density of VEGFR3+ lymphatics in j. n Quantification of CD45+CD11b+Ly6GF4/80+Ly6Chigh macrophages as the percentage of CD45+ cells in l (n = 4 per group). *P < 0.05, **P < 0.01, ***P < 0.001, ****P < 0.0001. d–h, k, and m by one-way ANOVA with Tukey post-hoc test, and n by Mann-Whitney U test. LVEF left ventricular ejection fraction, LVIDs left ventricular internal dimension during systole, LVIDd left ventricular internal dimension during diastole, DAPI 4’,6-diamidino-2-phenylindole, HE hematoxylin and eosin, and TUNEL terminal deoxynucleotidyltransferase-mediated dUTPbiotin nick end labeling
Fig. 5
Fig. 5
EphrinB2 promoted lymphatic proliferation and migration via the upregulation and nuclear translocation of ISL1. a Schematic diagram depicting the experimental strategy for RNA sequencing. b Volcano plot showing significantly differentially expressed genes (DEGs) in lymphatic endothelial cells (LECs) transfected with Adv-NC or Adv-Efnb2 following RNA sequencing. Genes with log2fold-change ≥2.0 and adjusted P < 0.05 were considered DEGs. c Barplot showing significantly enriched gene ontology (GO) pathways. d Heat map showing DEGs involed in endothelial cell proliferation. e RT-qPCR analysis determining the mRNA expressions of genes in d from LECs transfected with Adv-NC and Adv-Efnb2 in hypoxic conditions (n = 6 per group). f (Top) Representative immunoblotting images showing ISL1 protein levels in LECs treated with Adv-NC or Adv-Efnb2 under hypoxia. (Bottom) Quantification of the immunoblotting results normalized to Actin (n = 5 per group). g Cell proliferation activity of LECs transfected with Adv-NC or Adv-Efnb2 and Adv-shScram or Adv-shISL1 under hypoxic conditions for indicated times (0, 6, 12, 24 hours) assessed by CCK-8 assay. *(yellow)P < 0.05, **(yellow)P < 0.01 for Adv-Efnb2 + Adv-shScram vs Adv-NC + Adv-shScram; #(red)P < 0.05, ##(red)P < 0.01 for Adv-Efnb2+Adv-shISL1 vs Adv-Efnb2 + Adv-shScram. h (Left) Wound healing assay determing the effect of ISL1 knockdown under normoxic or hypoxic conditions for 24 hours. The white dashed lines indicate the terminals of the scratch. Scar bar: 200 μm. (Right) Quantification of results presented relative to normoxia+Adv-shScram group (n = 5 per group). i (Left) Representative immunoblotting images showing the nuclear and cytoplasmic extracts of ISL1 in LECs transfected with Adv-NC and Adv-Efnb2 under normoxic or hypoxic conditions. (Right) Quantification of the immunoblotting results normalized to Actin and presented relative to normoxia + Adv-NC group (n = 6 per group). j (Left) Representative immunofluorescence staining images showing LECs co-stained by ISL1 (green) and DAPI (blue) in indicated groups. Scar bar: 20 μm. (Right) Quantification of the immunofluorescence staining intensity in the LEC nuclei presented relative to the Adv-NC group (n = 5 per group). k Schematic illustration of conserved ISL1 consensus located at FLT4 promoter region across species. l Representative ChIP-seq track of ISL1 peaks across the FLT4 gene. The grey interval indicates the promoter region of FLT4 gene. (m) Chromatin immunoprecipitation (ChIP) assay showing the relative recruitment of ISL1 at FLT4 promoter region in indicated groups (n = 5 per group). *P < 0.05, **P < 0.01, ***P < 0.001, ****P < 0.0001. e, f by unpaired Student’s test. hj, and m by one-way ANOVA with Tukey post-hoc test, and g by two-way repeated measurement ANOVA with Bonferroni’s multiple comparisons test. BP biological process, MF molecular function, false discovery rate, and FC fodl change, and hg human genome
Fig. 6
Fig. 6
EphrinB2 induced nuclear translocation of ISL1 through activating CDK5 pathway. a Heatmap showing the expressions of CDKs in RNA-seq data. b RT-qPCR analysis determining the mRNA expression of CDK5 in LECs transfected with Adv-NC and Adv-Efnb2 under normoxic or hypoxic conditions (n = 6 per group). c (Left) Representative immunoblotting images showing CDK5 protein levels in LECs transfected with Adv-NC or Adv-Efnb2 under normoxic or hypoxic conditions. (Right) Quantification of the immunoblotting results normalized to Actin and presented relative to normoxia + Adv-NC group (n = 5 per group). d A predicted docking model of CKD5 and ISL1 with ClusPro. e Co-IP assay was performed to measure the interaction between CDK5 and ISL1. f (Left) Representative immunoblotting images showing immunoprecipitation (IP) assay for CDK5 binding to ISL1 and P-S/T levels of ISL1 in LECs transfected with Adv-NC or Adv-Efnb2 under normoxic or hypoxic conditions. (Right) Quantification of the immunoblotting results normalized to ISL1 or Actin and presented relative to normoxia + Adv-NC group (n = 6 per group). g (Left) Representative immunoblotting images showing immunoprecipitation (IP) assay for P-S/T levels of ISL1 in LECs in indicated groups in hypoxic conditions. (Right) Quantification of the immunoblotting results normalized to ISL1 and presented relative to Adv-NC + Adv-shScram group (n = 6 per group). h (Left) Representative immunofluorescence images showing LECs co-stained by ISL1 (green) and DAPI (blue) in indicated groups. Scar bar: 20 μm. (Right) Quantification of the immunofluorescence staining intensity in the nuclei presented relative to the Adv-NC + Adv-shScram group (n = 5 per group). i Wound healing assay determining th effect of CDK5 knockdown under hypoxic conditions for 24 h. The white dashed lines indicate the terminals of the scratch. Scar bar: 200 μm. j Quantification of i presented relative to Adv-NC + Adv-shScram group (n = 5 per group). k Cell proliferation activity of LECs with Adv-NC or Adv-Efnb2 and Adv-shScram or Adv-shCDK5 under hypoxic conditions for indicated times (0, 6, 12, 24 hours) assessed by CCK-8 assay. *(yellow)P < 0.05, **(yellow)P < 0.01 for Adv-Efnb2 + Adv-shScram vs Adv-NC + Adv-shScram; #(red)P < 0.05, ##(red)P < 0.01 for Adv-Efnb2+Adv-shCDK5 vs Adv-Efnb2 + Adv-shScram. *P < 0.05, **P < 0.01, ***P < 0.001, ****P < 0.0001. b, c, fh, and j by one-way ANOVA with Tukey post-hoc test, and k by two-way repeated measurement ANOVA with Bonferroni’s multiple comparisons test

References

    1. Ji, R. C. The role of lymphangiogenesis in cardiovascular diseases and heart transplantation. Heart Fail Rev27, 1837–1856 (2022). - PMC - PubMed
    1. Henri, O. et al. Selective stimulation of cardiac lymphangiogenesis reduces myocardial edema and fibrosis leading to improved cardiac function following myocardial infarction. Circulation133, 1484–1497 (2016). - PubMed
    1. Houssari, M. et al. Lymphatic and immune cell cross-talk regulates cardiac recovery after experimental myocardial infarction. Arterioscler Thromb Vasc Biol40, 1722–1737 (2020). - PMC - PubMed
    1. Brakenhielm, E. & Alitalo, K. Cardiac lymphatics in health and disease. Nat Rev Cardiol16, 56–68 (2019). - PubMed
    1. Jankowska-Steifer, E. et al. Assessing functional status of cardiac lymphatics: From macroscopic imaging to molecular profiling. Trends Cardiovasc Med.31, 333–338 (2021). - PubMed

Publication types

MeSH terms