. 2024 Nov 18;15(1):9966.
doi: 10.1038/s41467-024-54116-1.

Rapid biphasic decay of intact and defective HIV DNA reservoir during acute treated HIV disease

Affiliations

Rapid biphasic decay of intact and defective HIV DNA reservoir during acute treated HIV disease

Alton Barbehenn et al. Nat Commun. .

Abstract

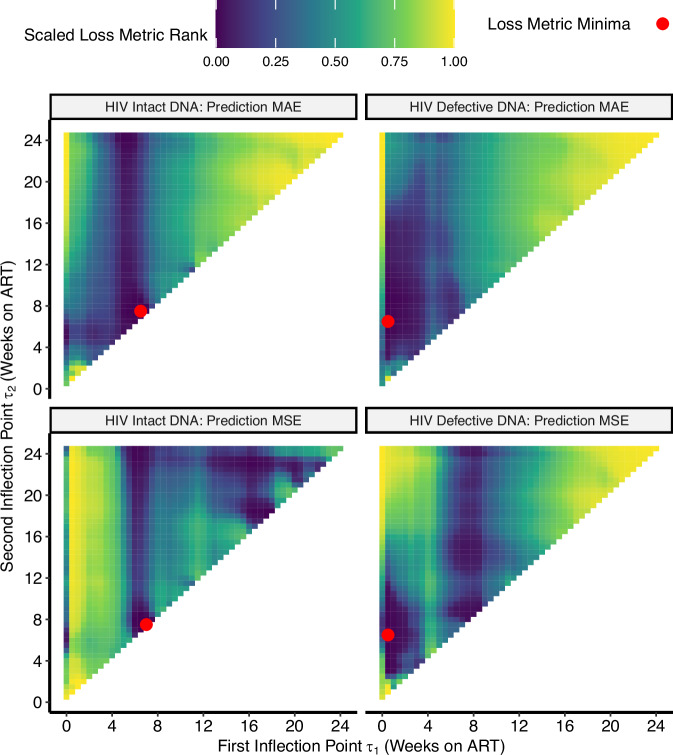
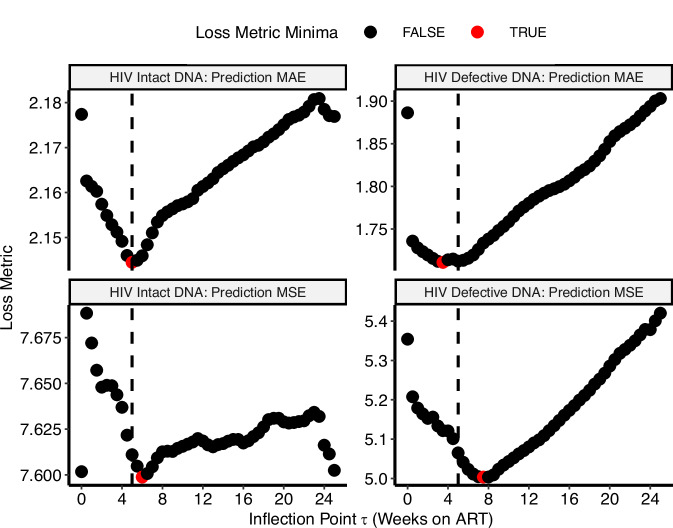
Despite antiretroviral therapy (ART), HIV persists in latently-infected cells (the HIV reservoir) which decay slowly over time. Here, leveraging >500 longitudinal samples from 67 people living with HIV (PLWH) treated during acute infection, we developed a mathematical model to predict reservoir decay from peripheral CD4 + T cells. Nonlinear generalized additive models demonstrated rapid biphasic decay of intact DNA (week 0-5: t1/2 ~ 2.83 weeks; week 5-24: t1/2 ~ 15.4 weeks) that extended out to 1 year. These estimates were ~5-fold faster than prior decay estimates among chronic treated PLWH. Defective DNA had a similar biphasic pattern, but data were more variable. Predicted intact and defective decay rates were faster for PLWH with earlier timing of ART initiation, higher initial CD4 + T cell count, and lower pre-ART viral load. In this study, we advanced our limited understanding of HIV reservoir decay at the time of ART initiation, informing future curative strategies targeting this critical time.


Conflict of interest statement

Competing interests The authors declare no competing interests.

Figures

Fig. 1
Fig. 1. The distribution of study participants in the UCSF Treat Acute HIV cohort.
A total of 67 participants met inclusion criteria for acute HIV, defined as < 100 days since the estimated date of detected HIV infection (EDDI) using the Infection Dating Tool (https://tools.incidence-estimation.org/idt/); these estimates were then used to estimate acute HIV Fiebig stages (a),. The majority of the cohort was of non-White self-reported race/ethnicity, consistent with national trends for people incident acute HIV (b).
Fig. 2
Fig. 2. Determination of optimal inflection points for HIV intact and defective DNA triphasic decay models.
Using the triphasic models for HIV intact (left panel) and defective (right panel) DNA, we then determined the optimal inflection points, τ, by minimizing the predicted mean absolute error (MAE; top panels) using leave-one-out cross-validation or the predicted mean squared error (MSE; bottom panels). Red dots denote the optimal inflection points, τ, for each model and prediction loss metric. For HIV intact DNA, the first (x-axis) and second (y-axis) inflection points were relatively similar, suggesting that a single inflection point – i.e., a biphasic model – adequately described the data. For HIV defective DNA, the first inflection point (x-axis) was close to zero, this again suggested that a biphasic model reasonably described the data.
Fig. 3
Fig. 3. Determination of optimal inflection points for HIV intact and defective DNA biphasic decay models.
Using the biphasic models for HIV intact (left panel) and defective (right panel) DNA, we then determined the optimal inflection point, τ, by minimizing the predicted mean absolute error (MAE; top panels) using leave-one-out cross-validation or the predicted mean squared error (MSE; bottom panels). An inflection point of τ = 5 weeks (vertical dashed line) best-fit decay patterns for both HIV intact (left panels) and defective (right panels) DNA. Red dots denote the best τ for each model and prediction error metric.
Fig. 4
Fig. 4. Predicted decay patterns of HIV intact and defective DNA during acute treated HIV from weeks 0–24.
Decay patterns for observed (thin gray lines) HIV intact and total defective (a), as well as 3’ and 5’ defective (b) DNA closely fit with average model predictions (thick black lines). Sampling time points are labeled on the x-axis (including a week 2 study visit during which confirmatory HIV test results were disclosed). We estimated average predicted participant decay rates by taking the mean of Ei (estimated time between HIV infection and ART initiation), Ci (initial CD4 + T cell count), and Vi (log10 pre-ART plasma viral load) across participants from final models.
Fig. 5
Fig. 5. HIV intact and defective DNA decay patterns were associated with known clinical factors associated with HIV reservoir size.
The observed HIV DNA data are shown as thin gray lines for each participant, while the decay pattern for the model-predicted average participant is shown as thick black lines. Biphasic decay patterns for HIV intact (left panel) and combined defective (3’ plus 5’, right panel) were faster among participants initiating ART earlier (< 30 days vs. 30–100 days) (a), with higher initial CD4 + T cell counts (shown by tertiles) (b), and lower pre-ART viral load (shown by tertiles) (c).
Fig. 6
Fig. 6. Predicted HIV intact and defective DNA decay rates, by tertiles of clinical factors associated with HIV reservoir size.
We performed bootstrapping to estimate the average predicted decay rates of HIV intact (left panels) and defective (right panels) DNA, stratified by tertiles of known clinical factors associated with HIV reservoir size: timing of ART initiation (a), initial CD4 + T cell count (b), and pre-ART viral load (c). Figures depict the bootstrapped mean and its 95% confidence interval.

Update of

References

    1. Chun, T. W. et al. Rebound of plasma viremia following cessation of antiretroviral therapy despite profoundly low levels of HIV reservoir: implications for eradication. AIDS24, 2803–2808 (2010). - PMC - PubMed
    1. Hocqueloux, L. et al. Long-term immunovirologic control following antiretroviral therapy interruption in patients treated at the time of primary HIV-1 infection. AIDS24, 1598–1601 (2010). - PubMed
    1. White, J. A. et al. Complex decay dynamics of HIV virions, intact and defective proviruses, and 2LTR circles following initiation of antiretroviral therapy. Proc. Natl. Acad. Sci. USA119, e2120326119 (2022). - PMC - PubMed
    1. Perelson, A. S. et al. Decay characteristics of HIV-1-infected compartments during combination therapy. Nature387, 188–191 (1997). - PubMed
    1. Kwon, K. J. & Siliciano, R. F. HIV persistence: clonal expansion of cells in the latent reservoir. J. Clin. Invest.127, 2536–2538 (2017). - PMC - PubMed

Publication types