. 2024 Nov 19;15(1):9996.
doi: 10.1038/s41467-024-54299-7.

G12/13-mediated signaling stimulates hepatic glucose production and has a major impact on whole body glucose homeostasis

Affiliations

G12/13-mediated signaling stimulates hepatic glucose production and has a major impact on whole body glucose homeostasis

Srinivas Pittala et al. Nat Commun. .

Abstract

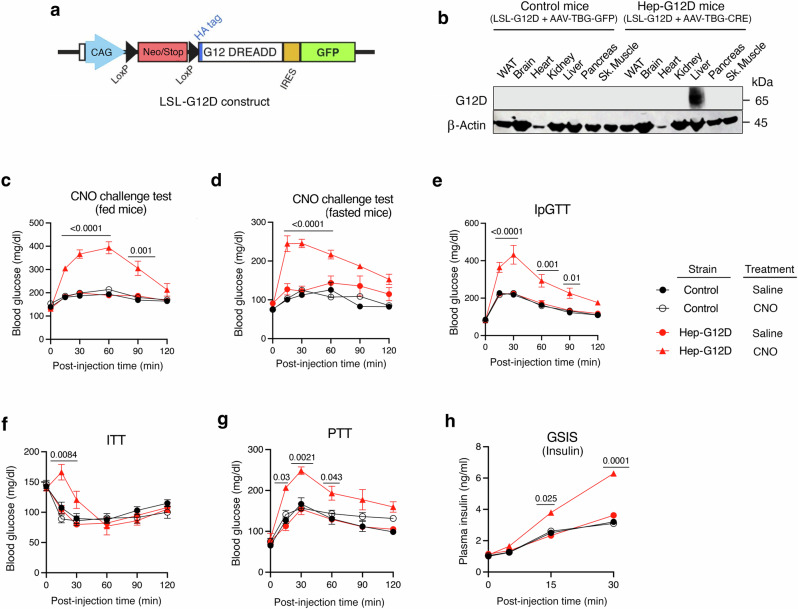
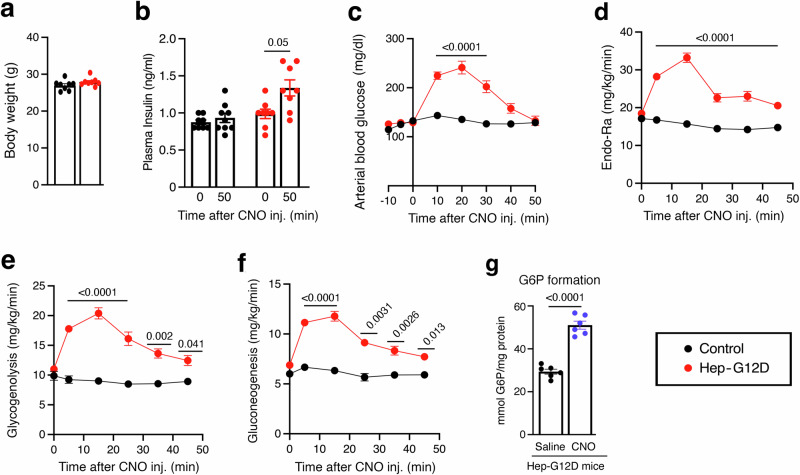
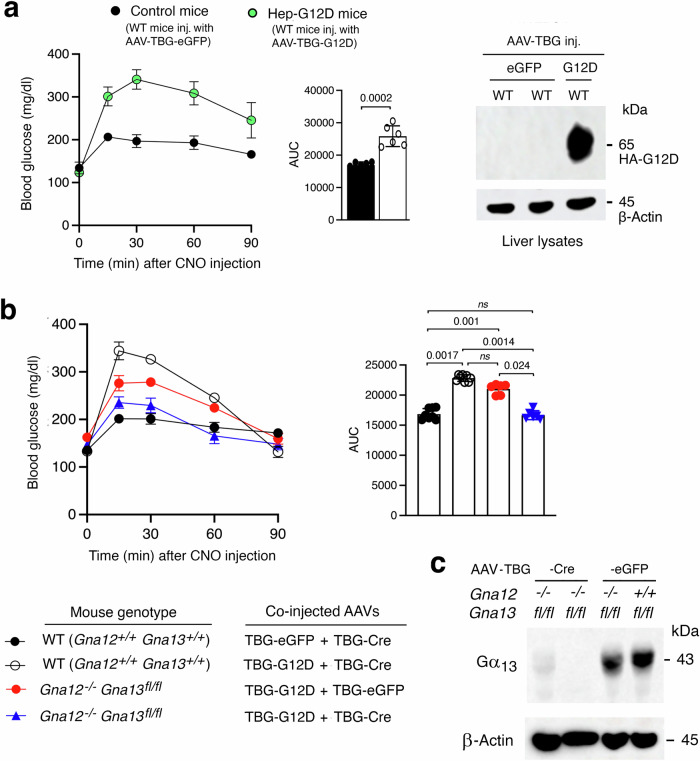
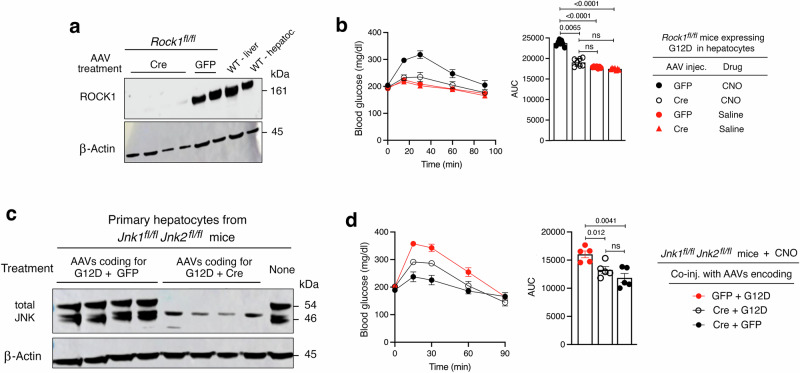
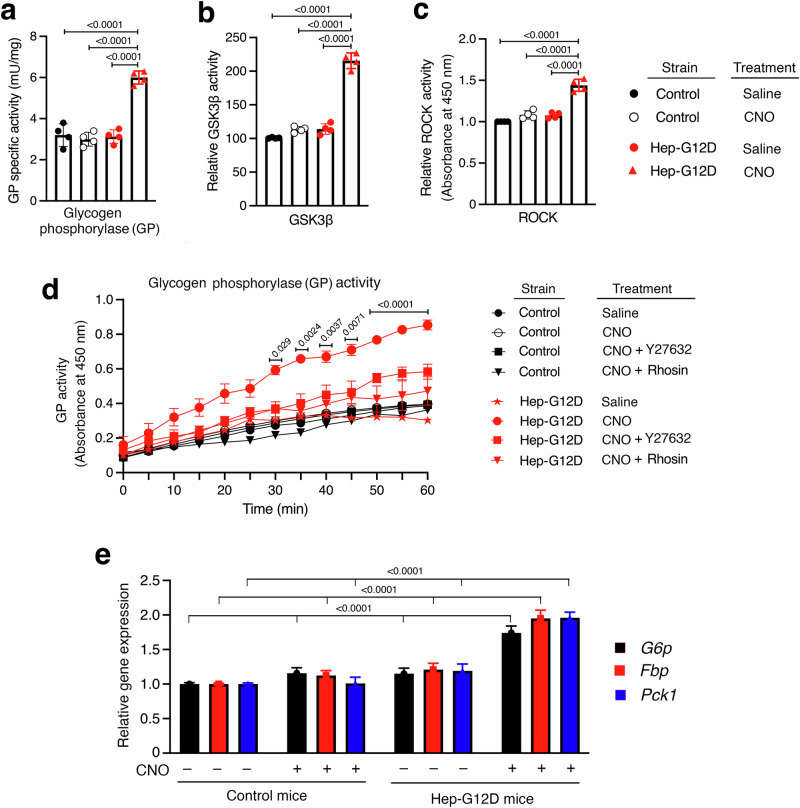
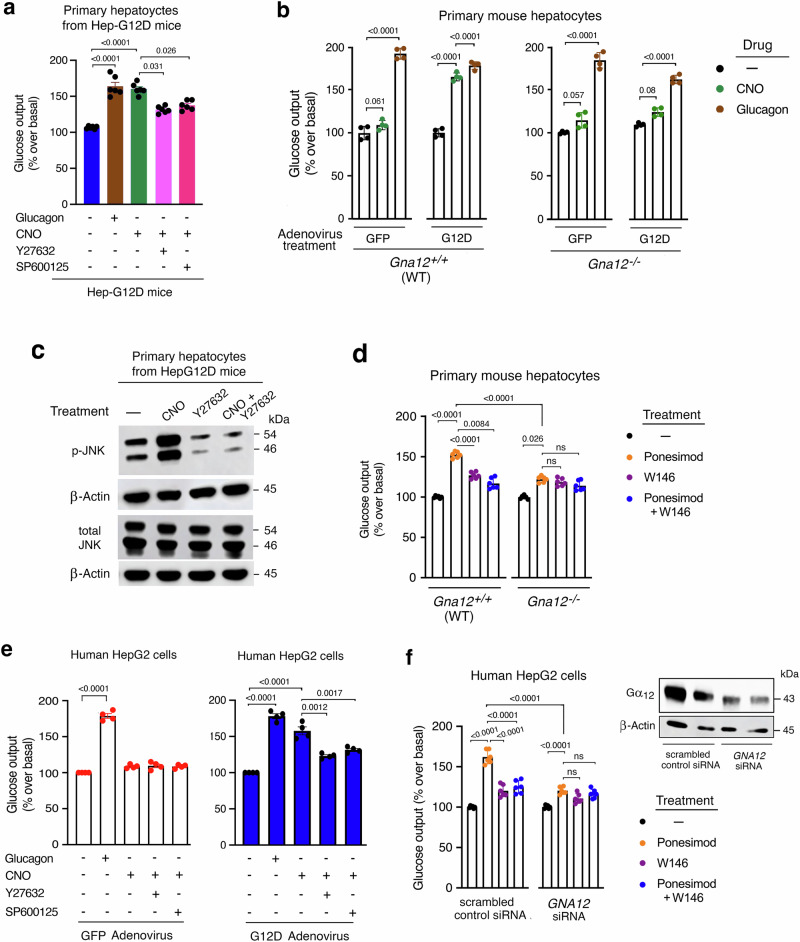
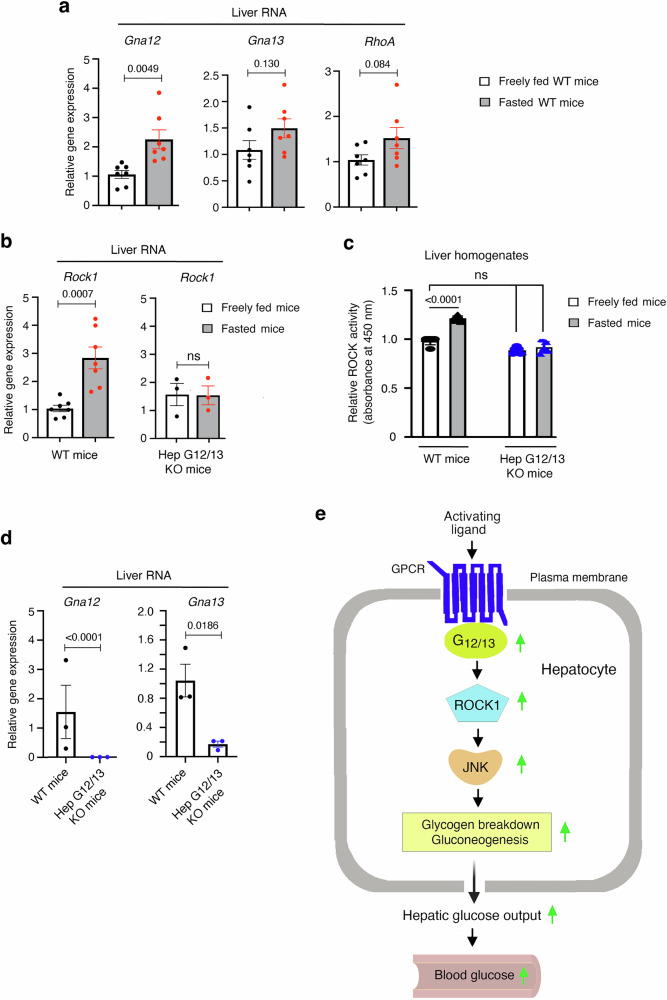
Altered hepatic glucose fluxes are critical during the pathogenesis of type 2 diabetes. G protein-coupled receptors represent important regulators of hepatic glucose production. Recent studies have shown that hepatocytes express GPCRs that can couple to G12/13, a subfamily of heterotrimeric G proteins that has attracted relatively little attention in the past. Here we show, by analyzing several mutant mouse strains, that selective activation of hepatocyte G12/13 signaling leads to pronounced hyperglycemia and that this effect involves the stimulation of the ROCK1-JNK signaling cascade. Using both mouse and human hepatocytes, we also show that activation of endogenous sphingosine-1-phosphate type 1 receptors strongly promotes glucose release in a G12/13-dependent fashion. Studies with human liver samples indicate that hepatic GNA12 (encoding Gα12) expression levels positively correlate with indices of insulin resistance and impaired glucose homeostasis, consistent with a potential pathophysiological role of enhanced hepatic G12/13 signaling.


Conflict of interest statement

Competing interests The authors declare no competing interests.

Figures

Fig. 1
Fig. 1. In vivo metabolic studies with Hep-G12D mice maintained on regular chow.
a The indicated construct was inserted into the mouse Rosa26 locus, resulting in LSL-G12D mice. b Immunoblot showing selective expression of G12D in the liver of LSL-G12D mice following i.v. injection with the AAV-TBG-Cre virus (Hep-G12D mice). The G12D receptor was detected with an anti-HA antibody that recognized the HA epitope tag that had been fused to the N-terminus of G12D (a). G12D was not expressed in LSL-G12D mice treated with the AAV-TBG-eGFP control virus (control littermates). ch In vivo metabolic tests performed with Hep-G12D mice and control littermates. c, d CNO challenge tests. Freely fed (c) or fasted (d) mice (12 h overnight fast) were injected i.p. with CNO (3 mg/kg) or saline, followed by monitoring of blood glucose levels (n = 8 per group). e I.p. glucose tolerance test performed after a 12 h fast (IpGTT, 2 g glucose/kg) (n = 8 per group). f Insulin tolerance test carried out after a 4 h fast (ITT, 0.75 U insulin/kg, i.p.) (n = 8 per group). g Pyruvate tolerance test following a 12 hr fast (PTT, 1 g sodium pyruvate/kg, i.p.) (n = 8 per group). h Glucose-stimulated insulin secretion (GSIS; 2 g glucose/kg, i.p.). Following injection of the glucose bolus, plasma insulin levels were measured at the indicated time points (n = 8 per group). All studies were performed using 3-4-month-old male mice maintained on regular chow. Data represent means ± s.e.m. Numbers above horizontal bars refer to p-values. Statistical significance was determined by 2-way ANOVA followed by Bonferroni’s post-hoc test (c–h). Sk. muscle, skeletal muscle. Source data are provided as a Source Data file.
Fig. 2
Fig. 2. In vivo euglycemic clamp studies with Hep-G12D mice.
Effect of CNO on hepatic glucose fluxes in Hep-G12D mice in vivo. All studies were carried out with male Hep-G12D mice and control littermates maintained on regular chow. a Body weight (age: 15 weeks; n = 8 per group). b Plasma insulin levels before and 50 min after CNO injection (n = 8 or 9 per group). cf Changes in arterial blood glucose levels (c), rate of glucose appearance (endogenous glucose flux; Endo-Ra) (d), hepatic glycogenolysis (e), and gluconeogenesis (f), following treatment of Hep-G12D mice and control littermates with CNO (3 mg/kg, i.v.) (n = 8 or 9 per group). All studies (af) were carried out with chronically catheterized, conscious 15-week-old male mice. g Hepatic glucose-6-phosphate (G6P) formation. Following a 4 h fast, Hep-G12D mice (12-week-old males) were treated with saline or CNO (3 mg/kg, i.v.). Five min later, livers were collected, and G6P levels were determined in liver lysates (n = 6 mice/group). Data represent means ± s.e.m. Numbers above horizontal bars refer to p-values (af, 2-way ANOVA followed by Bonferroni’s post-hoc test; (g), two-tailed unpaired Student’s t test). Source data are provided as a Source Data file.
Fig. 3
Fig. 3. G12D-mediated hyperglycemic effects require hepatic G12/13 signaling.
WT mice (background: C57BL/6) and Gna12−/−Gna13fl/fl mutant mice with the same genetic background were maintained on regular chow for 8 weeks. Subsequently, WT mice were injected i.v. with AAV-TBG-eGFP (control mice) or AAV-TBG-G12D (Hep-G12D mice). One week later, freely fed mice were injected i.p. with CNO (3 mg/kg) or saline, followed by the monitoring of blood glucose levels. a CNO treatment of WT mice injected with the G12D virus causes pronounced hyperglycemia (mouse age: 8 weeks; n = 6 per group). The Western blot to the right shows that G12D is present in liver lysates from WT mice injected with the G12D virus but not in liver lysates from WT mice treated with the eGFP virus. The HA-tagged G12D receptor was detected with anti-HA antibody. b WT and Gna12−/−Gna13fl/fl mice were injected with the indicated AAV combinations (mouse age: 10 weeks; n = 6 per group). Note that the hyperglycemic effects caused by CNO treatment of G12D-expressing mice (WT mice treated with AAVs coding for eGFP and Cre) is absent in G12D-expressing mice lacking Gα12 and Gα13 in their hepatocytes (Gna12−/− Gna13fl/fl mice injected with AAVs coding for G12D and Cre). c Immunoblot showing the lack of Gα13 expression in primary hepatocytes prepared from Gna12−/−Gna13fl/fl mice treated with the AAV-TBG-Cre virus. Similar results were obtained in three additional independent experiments. All studies were carried out with male mice. Data represent means ± s.e.m. Numbers above horizontal bars refer to p values (panel a: two-tailed unpaired Student’s t-test; (b): 2-way ANOVA followed by Bonferroni’s post-hoc test). ns, no statistically significant difference. Source data are provided as a Source Data file.
Fig. 4
Fig. 4. ROCK1 and JNK signaling are required for G12D-mediated hyperglycemia.
Rock1fl/fl, Jnk1fl/fl Jnk2fl/fl, and all other mice used were maintained on regular chow for 8 weeks. Mice were then injected with either AAV-TBG-eGFP plus AAV-TBG-G12D or AAV-TBG-Cre plus AAV-TBG-G12D. One week later, freely fed mice were injected i.p. with CNO (3 mg/kg) or saline, followed by the measurement of blood glucose levels. a Immunoblot showing the lack of ROCK1 expression in primary hepatocytes prepared from Rock1fl/fl mice treated with the AAV-TBG-Cre virus. b The hyperglycemic effect caused by CNO treatment of Hep-G12D mice is absent in Hep-G12D mice lacking ROCK1 in hepatocytes. c Immunoblot showing the relative lack of JNK1/2 expression in primary hepatocytes prepared from Jnk1fl/fl Jnk2fl/fl mice treated with the AAV-TBG-Cre virus. d Inactivation of the Jnk1 and Jnk2 genes in hepatocytes leads to a marked reduction in the magnitude of CNO-induced hyperglycemic responses in Hep-G12D mice. Data are given as means ± s.e.m. (n = 6 mice/group). Numbers above horizontal bars refer to p-values (2-way ANOVA followed by Bonferroni’s post-hoc test). ns, no statistically significant difference. Source data are provided as a Source Data file.
Fig. 5
Fig. 5. Hepatic enzyme activity assays and gene expression analysis.
All experiments were carried out with 12-week-old male Hep-G12D mice and control littermates maintained on regular chow. Assays were performed with liver tissue homogenates obtained from mice 30 min after i.p. injection with CNO (3 mg/kg) or saline. (ac), Enzyme activity assays. The activities of hepatic glycogen phosphorylase (GP) (a), GSK3β (b), and ROCK (c) were determined. d GP activity kinetic assay using mouse primary hepatocytes from Hep-G12D mice and control littermates. The following drugs were used: CNO (10 μM), Y27632 (ROCK inhibitor, 10 μM), and rhosin (RhoA inhibitor, 10 μM). e Expression levels of key genes regulating hepatic glucose metabolism using liver RNA obtained from mice 30 min after i.p. injection with CNO (3 mg/kg) or saline (-). Gene expression levels were obtained via qRT-PCR and normalized relative to β-actin RNA expression. Data represent means ± s.e.m. (n = 6 mice/group). Numbers above horizontal bars refer to p values. Statistical significance was determined by 2-way ANOVA followed by Bonferroni’s post-hoc test. Source data are provided as a Source Data file.
Fig. 6
Fig. 6. Glucose output assays carried out with primary mouse hepatocytes and human HepG2 cells.
a Primary hepatocytes prepared from Hep-G12D mice were incubated in the absence or presence of CNO (10 μM), and glucose outflow was examined 5 h later. Cells were also treated with glucagon (100 nM), CNO plus Y-27632 (ROCK inhibitor), and CNO plus SP600125 (JNK inhibitor) (10 µM each drug) ((n = 6 mice per group). b Primary hepatocytes prepared from WT or Gna12−/− mice injected with the indicated adenoviruses were incubated with CNO (10 µM) or glucagon (100 nM), followed by the measurement of total glucose secretion for 5 h later (n = 4 independent experiments). c Western blot analysis of G12D-mediated JNK activation. Primary hepatocytes obtained from Hep-G12D mice were treated with CNO and other drugs. A representative blot is shown. Two additional independent experiments yielded similar results. d Ponesimod-induced glucose production is abolished in mouse hepatocytes with Gα12 deficiency. Primary hepatocytes from 9 to 10-week old WT (C57BL/6) and Gna12−/− mice were incubated in the presence of ponesimod (10 µM; S1PR1 agonist), either alone or in the presence of W146 (1 µM), a selective S1PR1 antagonist. Total glucose output was measured 5 h later (n = 6 mice per group). e Glucose output assays with human HepG2 cells. HepG2 cells infected with the indicated adenoviruses were incubated with CNO and other drugs. Glucose secretion was determined after a 3 h incubation period. Data are from four independent experiments, each carried out in triplicate. f Ponesimod-induced glucose output is nearly abolished in HepG2 cells following treatment with GNA12 siRNA. HepG2 cells were treated with either scrambled control siRNA or GNA12 siRNA. Cells were then incubated in the presence of ponesimod (10 µM), either alone or in the presence of W146 (1 µM), followed by glucose output measurements 3 h later. Data are from three independent experiments, each carried out in triplicate. The insert shows a representative Western blot examining the expression of Gα13. Data are given as means ± s.e.m. Numbers above horizontal bars refer to p values (2-way ANOVA followed by Bonferroni’s post-hoc test). ns, no statistically significant difference. Source data are provided as a Source Data file.
Fig. 7
Fig. 7. Fasting increases hepatic Gna12 and Rock1 expression levels and ROCK1 activity in WT mice.
Total mRNA was isolated from 10-week-old WT mice (males) that had free access to food or that had been fasted for 24 h. a, b The expression of Gna12 and Rock1 are upregulated in fasted mice, as determined via qRT-PCR. c Fasted WT mice also show a significant increase in hepatic ROCK activity, as studied with liver homogenates. bd The fasting-induced increases in hepatic Rock1 expression and ROCK activity are abolished in Hep-G12/13 KO mice (whole body Gα12 KO mice lacking Gα13 selectively in hepatocytes; see Methods for details). e Scheme depicting how receptor-mediated activation of hepatic G12/13 signaling promotes glucose output from hepatocytes. Data are given as means ± s.e.m. (n = 7/group). Numbers above horizontal bars refer to p-values (two-tailed unpaired Student’s t-test (a, b, d); 2-way ANOVA followed by Bonferroni’s post-hoc test (c)). Source data are provided as a Source Data file.

References

    1. Han, H. S., Kang, G., Kim, J. S., Choi, B. H. & Koo, S. H. Regulation of glucose metabolism from a liver-centric perspective. Expl Mol. Med.48, e218 (2016). - PMC - PubMed
    1. Lin, H. V. & Accili, D. Hormonal regulation of hepatic glucose production in health and disease. Cell Metab.14, 9–19 (2011). - PMC - PubMed
    1. Petersen, M. C., Vatner, D. F. & Shulman, G. I. Regulation of hepatic glucose metabolism in health and disease. Nat. Rev. Endo.13, 572–587 (2017). - PMC - PubMed
    1. Regard, J. B., Sato, I. T. & Coughlin, S. R. Anatomical profiling of G protein-coupled receptor expression. Cell135, 561–571 (2008). - PMC - PubMed
    1. Kimura, T., Pydi, S. P., Pham, J. & Tanaka, N. Metabolic functions of G protein-coupled receptors in hepatocytes-potential applications for diabetes and NAFLD. Biomolecules10, 1445 (2020). - PMC - PubMed

Publication types

MeSH terms

Substances

LinkOut - more resources