. 2024 Nov 19;15(1):9999.
doi: 10.1038/s41467-024-54291-1.

Enzymatically catalyzed molecular aggregation

Affiliations

Enzymatically catalyzed molecular aggregation

Wen-Jin Wang et al. Nat Commun. .

Abstract

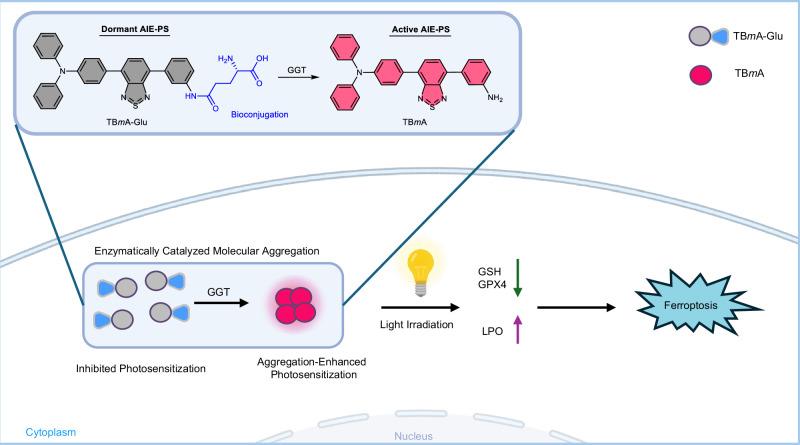
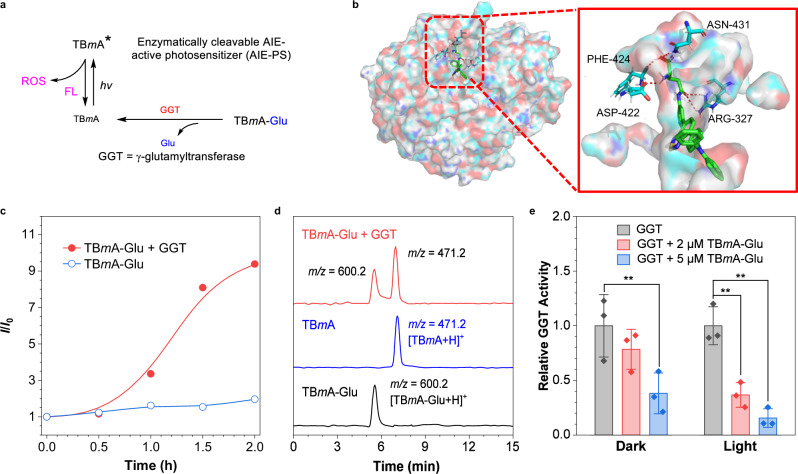
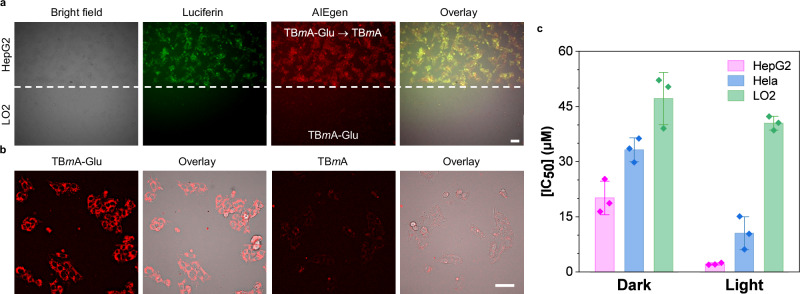
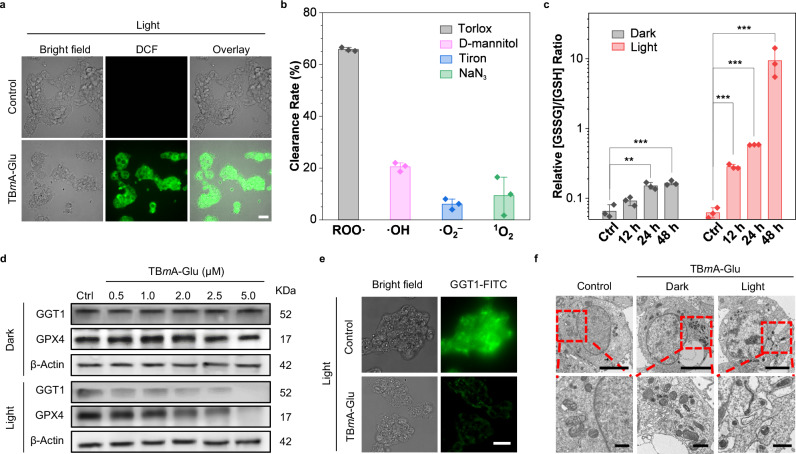
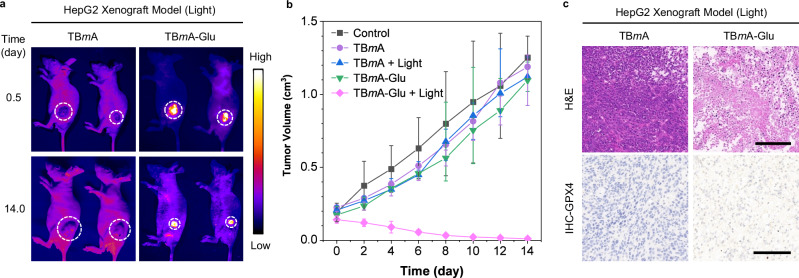
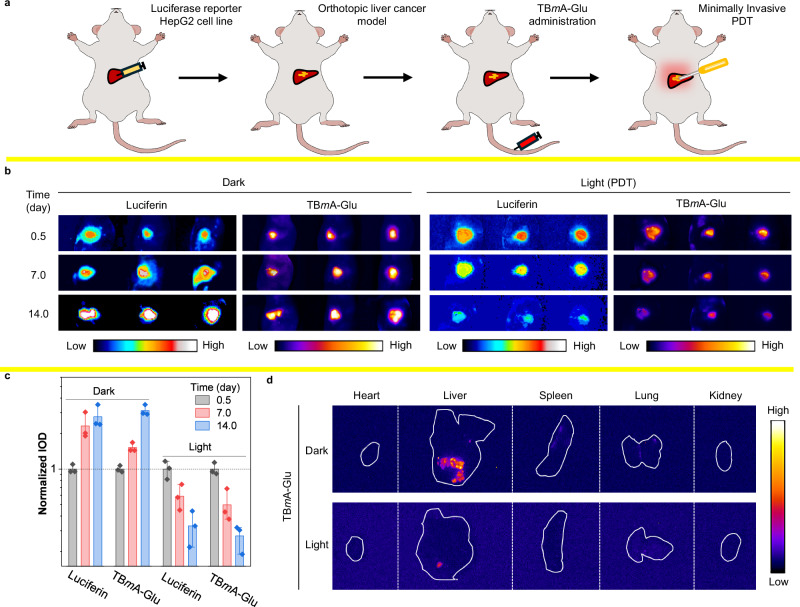
The dynamic modulation of the aggregation process of small molecules represents an important research objective for scientists. However, the complex and dynamic nature of internal environments in vivo impedes controllable aggregation processes of single molecules. In this study, we successfully achieve tumor-targeted aggregation of an aggregation-induced emission photosensitizer (AIE-PS), TBmA, with the catalysis of a tumor-overexpressed enzyme, γ-Glutamyl Transferase (GGT). Mechanistic investigations reveal that TBmA-Glu can be activated by GGT through cleavage of the γ-glutamyl bond and releasing TBmA. The poor water solubility of TBmA induces its aggregation, leading to aggregation-enhanced emission and photodynamic activities. The TBmA-Glu not only induces glutathione (GSH) depletion through GGT photo-degradation but also triggers lipid peroxidation accumulation and ferroptosis in cancer cells through photodynamic therapy. Finally, the in vivo studies conducted on female mice using both tumor xenograft and orthotopic liver cancer models have also demonstrated the significant anti-cancer effects of TBmA-Glu. The exceptional cancer-targeting ability and therapeutic efficiency demonstrated by this GGT activatable AIE-PS highlights enzymatic-mediated modulation as an effective approach for regulating small molecule aggregation intracellularly, thereby advancing innovative therapeutic strategies for various diseases.


Conflict of interest statement

Competing interests The authors declare no competing interests.

Figures

Fig. 1
Fig. 1. Schematic elucidation of the aggregation-enhanced photodynamic therapy mechanism mediated by TBmA-Glu.
TBmA-Glu can be activated by GGT to form the aggregates of TBmA, which will induce ferroposis of cancer cells.
Fig. 2
Fig. 2. Construction and characterization of AIE photosensitizers.
a Emission spectra of TBmA (10 μM) in DMF/water mixtures with different fractions of water (fw). b Photographs of TBmA, TBpA, TBmA-Glu, and TBpA-Glu powders and in DMF solutions (fw = 0%) and DMF/water mixture (fw = 99%) taken at room temperature under 365 nm UV illumination. c The generation of total ROS generation (2’,7’-dichlorofluorescein, DCF), hydroxyl radical (hydroxyphenyl fluorescein, HPF) and singlet oxygen (9,10-anthracenediyl-bis(methylene)dimalonic Acid, ABDA) by photosensitizers (5 μM) after white LED light (predominant emission peaks at 450 and 570 nm, Supplementary Fig. 28) irradiation (20 mW·cm−2) for 15 min using the corresponding ROS indicator in PBS/DMSO (v/v = 99:1). DCF, λex = 488 nm. d The plot of the relative emission intensity (I/I0) of DCF (10 μM) in solutions with different fw containing TBmA (5 μM) versus the irradiation (20 mW·cm−2) time, where I0 = PL intensity of DCFH in solutions with different fw without light irradiation. λex = 488 nm. e plot of αAIE (I/I0, where I0 = PL intensity in pure DMF) of TBmA and I/I0 (where I0 = PL intensity of DCF in pure DMF after irradiation with a white LED array (20 mW·cm−2) for 15 min) of DCF in the presence of TBmA (5 μM) versus fw. f The size of the aggregates of TBmA versus fw. Insertion: the size distribution of the TBmA aggregates in 99% (up) and 65% (down) water fraction.
Fig. 3
Fig. 3. Characterization of the GGT-dependent PDT properties of AIE photosensitizers.
a The schematic diagram of the activation of the AIEgen photosensitizer by GGT. b The molecular docking images of TBmA-Glu with GGT (PDB: 4GG2). The TBmA-Glu is colored green, and the molecular surface of GGT is shown as a colorful surface with transparency. The enlarged images show the hydrogen bonds formed between TBmA-Glu and GGT. c Fluorescence intensity changes of TBmA-Glu incubated in the HEPES buffer at 37 °C in the presence and absence of GGT without light irradiation. d LC-MS curves of TBmA-Glu, TBmA-Glu + GGT (incubated in the buffer for 2 h), and TBmA. e The GGT activity changes in the presence of different concentrations of TBmA-Glu under light irradiation (12 J·cm−2). All assays (n = 3) were biologically independent samples, data expressed as average ± standard error; statistical significance: P values, ns: **P < 0.01, calculated with the one-sided Student’s t-test.
Fig. 4
Fig. 4. Characterization of GGT-dependent PDT properties of AIE photosensitizers in cells.
a Confocal laser scanning microscope (CLSM) images of co-incubated cancer (HepG2; luciferase-transfected) and normal (LO2) cells after treatment with TBmA-Glu (5 μM, 12 h). TBmA-Glu, λex = 465 nm, λem = 700 ± 20 nm. Luciferin, λem = 520 ± 20 nm, 120 ms. Three independent experiments were performed. Scale bar: 30 μm. b CLSM images of HepG2 cells after being treated by TBmA-Glu (5 μM) or TBmA (5 μM) for 12 h. Three independent experiments were performed. Scale bar: 30 μm. c The cytotoxicity (IC50, μM) of TBmA-Glu against the cell lines with different GGT expression levels (HepG2 > HeLa > LO2). All assays (n = 3) were biologically independent samples, data expressed as average ± standard error.
Fig. 5
Fig. 5. Investigation of anticancer mechanism for TBmA-Glu.
a Intracellular ROS generation in HepG2 cells PDT treatment groups, DCFH-DA (10 μM, 10 min) used as the indicator. DCF, λex = 488 nm, λem = 500 ± 20 nm. Scale bar, 20 μm. b The Clearance rates of different ROS scavengers (Trolox: 50 μM (ROO· scavenger); d-mannitol: 50 mM (·OH scavenger); Tiron: 10 mM (·O2 scavenger); NaN3: 5 mM (1O2 scavenger)) on the ROS induced by PDT of TBmA-Glu were evaluated. All assays (n = 3) were biologically independent samples, data expressed as average ± standard error. c Impact of TBmA-Glu (2 μM) on cellular GSSG/GSH ratios. All assays (n = 3) were biologically independent samples, data expressed as average ± standard error. Statistical significance: P values, ***P < 0.001, calculated with the one-sided Student’s t-test. d The expression levels of GGT and GPX4 in HepG2 cells of TBmA-Glu dark and PDT groups. Three independent experiments were performed. e The expression level of GGT1 in HepG2 cells in TBmA-Glu (2 μM) or 1% DMSO (Ctrl) for PDT groups. Three independent experiments were performed. Scale bar, 20 μm. f Transmission electron microscopy images revealed morphological changes in HepG2 cells treated with TBmA-Glu (2 μΜ, 24 h) without and under light irradiation conditions. Enlarged regions are indicated by red rectangles. Three independent experiments were performed. Scale bars represent lengths of 5  μm and 500 nm (for the enlarged images), respectively.
Fig. 6
Fig. 6. Investigation of the in vivo therapeutic effect of TBmA-Glu mediated phototherapy.
a The fluorescence images represent mice in TBmA-Glu and TBmA PDT treatment groups at the start and end of the treatment process. The white circles indicate the region of tumors. TBmA-Glu and TBmA, λex = 500 nm, λem = 700 nm (Long-pass filter). b Tumor growth curves of tumor-bearing mice (n = 5), data expressed as average ± standard error. The red arrows indicate the time points for drug administration. c The H&E (upper panel) and immunohistochemistry of GPX4 (lower panel) in tumor sections from mice in TBmA-Glu treatment groups. Three independent experiments were performed. Scale bars: 50 μm.
Fig. 7
Fig. 7. Investigation of the therapeutic effect of TBmA-Glu mediated phototherapy in orthotopic liver cancer mouse models.
a Schematic diagram of the modeling process of a mouse model of liver tumor in situ. b The fluorescence images of the in situ hepatoma mice at the start, middle, and end of the treatment process by TBmA-Glu (5 mg/kg). Luminescence, λem = 550 ± 50 nm (Band-pass filter), 1000 ms. TBmA-Glu, λex = 500 nm, λem = 650 nm (Long-pass filter). c The normalized integrated optical density of cancer in the mice of in situ hepatoma models (n = 3) after treated TBmA-Glu (5 mg/kg) with or without light irradiation, data expressed as average ± standard error. d The fluorescence images of the separated organs of the orthotopic liver cancer mice at the end of the therapeutic process. TBmA-Glu, λex = 500 nm, λem = 650 nm (long-pass filter).

References

    1. Grote, M. et al. The molecular vista: current perspectives on molecules and life in the twentieth century. Hist. Phil. Life Sci.43, 16 (2021). - PMC - PubMed
    1. Van Regenmortel, M. H. V. Truth in science and in molecular recognition, post-truth in human affairs. J. Mol. Recognit.33, e2827 (2020). - PubMed
    1. Zhao, Z., Zhang, H., Lam, J. W. Y. & Tang, B. Z. Aggregation-induced emission: new vistas at the aggregate level. Angew. Chem. Int. Ed.59, 9888–9907 (2020). - PubMed
    1. Guo, T. et al. Towards bioresource-based aggregation-induced emission luminogens from lignin beta-O-4 motifs as renewable resources. Nat. Commun.14, 6076 (2023). - PMC - PubMed
    1. Yang, J., Fang, M. & Li, Z. Organic luminescent materials: the concentration on aggregates from aggregation‐induced emission. Aggregate1, 6–18 (2020).

Publication types

LinkOut - more resources