

An annual land cover dataset for the Baltic Sea Region with crop types and peat bogs at 30 m from 2000 to 2022
- PMID: 39557873
- PMCID: PMC11574315
- DOI: 10.1038/s41597-024-04062-w
An annual land cover dataset for the Baltic Sea Region with crop types and peat bogs at 30 m from 2000 to 2022
Abstract
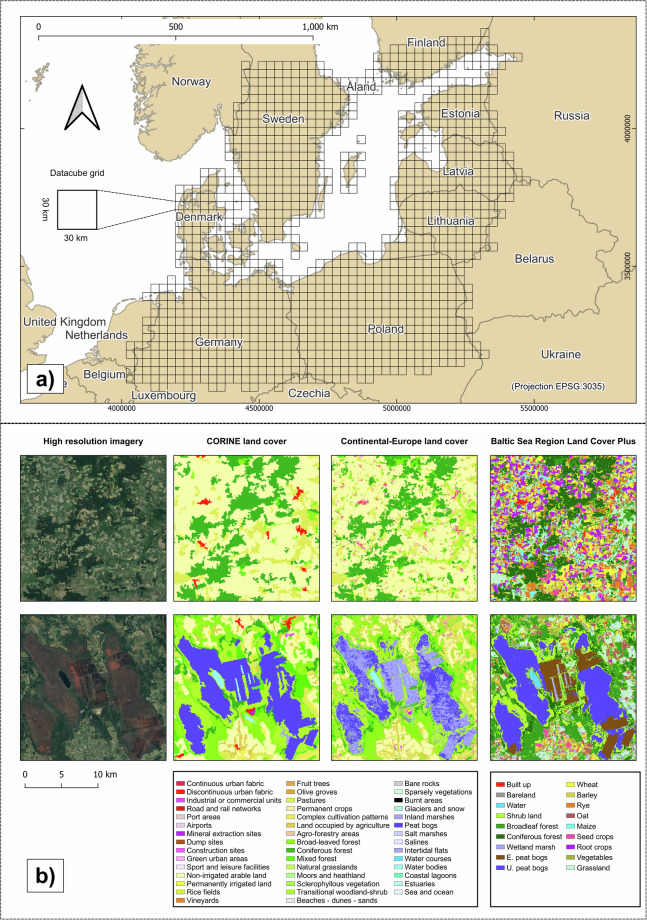
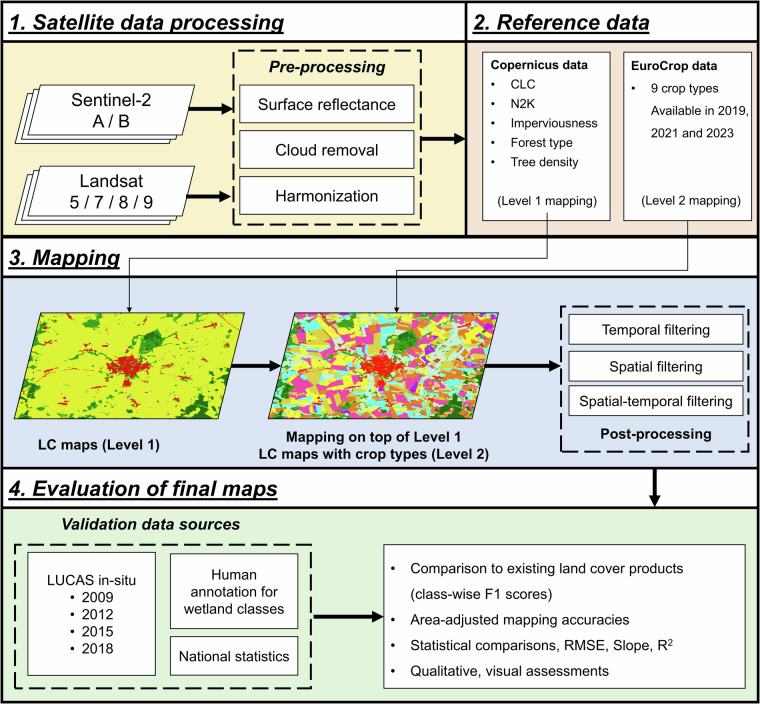
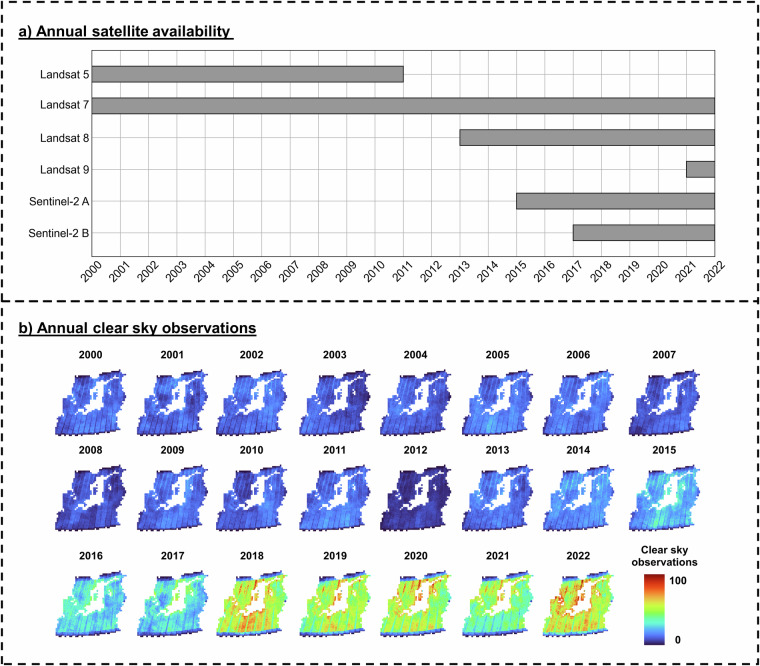
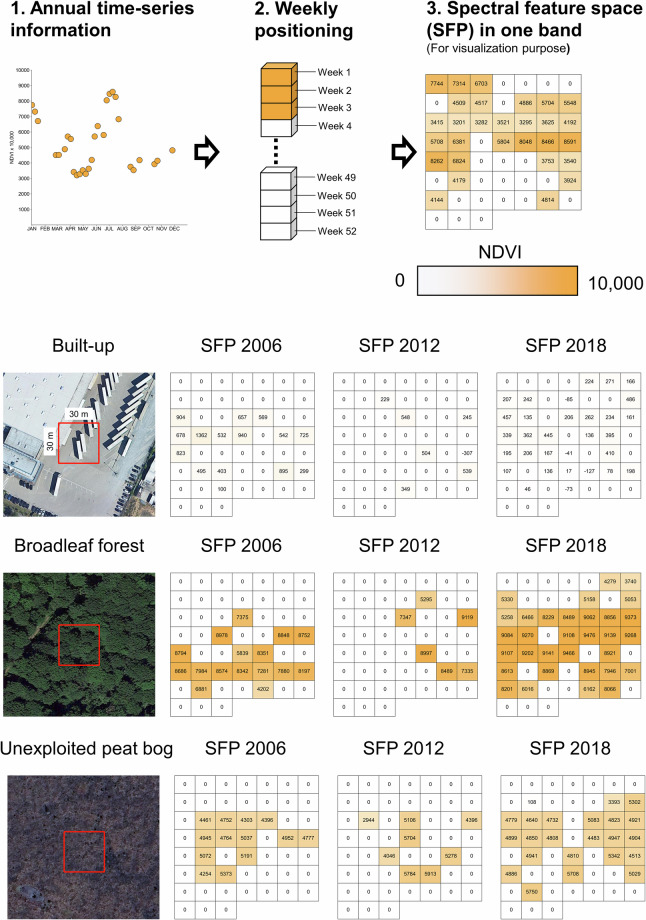
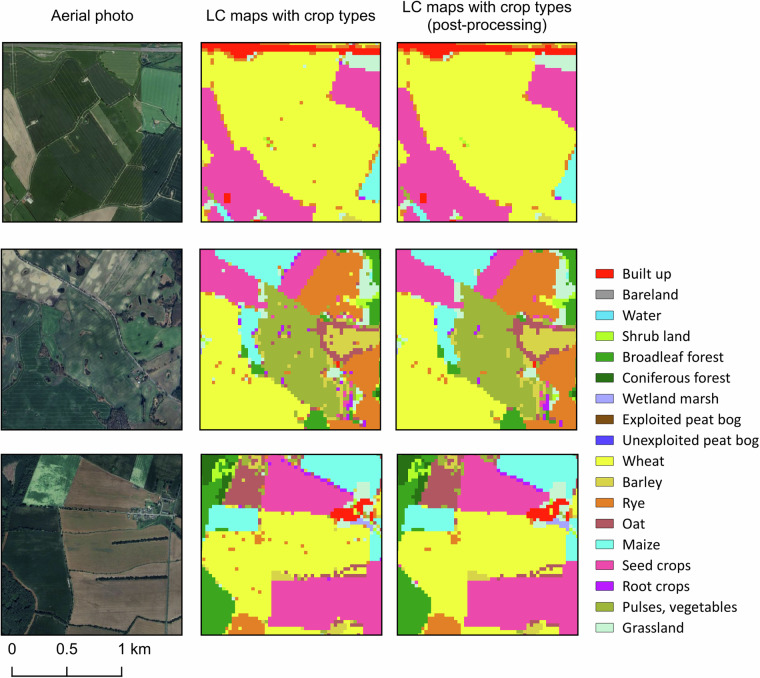
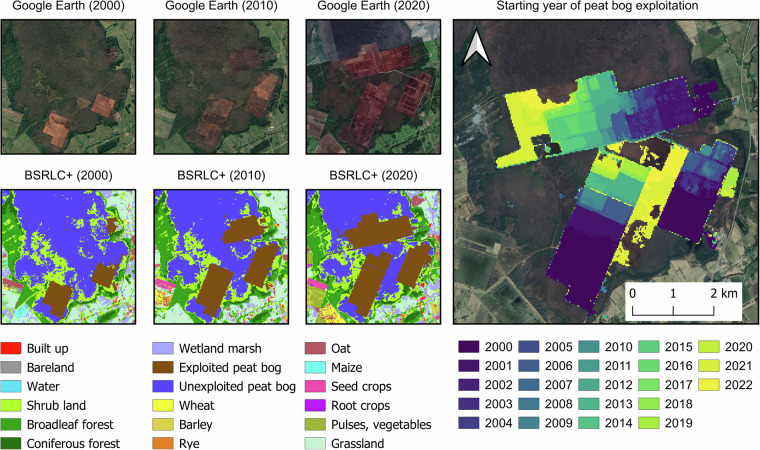
We present detailed annual land cover maps for the Baltic Sea region, spanning more than two decades (2000-2022). The maps provide information on eighteen land cover (LC) classes, including eight general LC types, eight major crop types and grassland, and two peat bog-related classes. Our maps represent the first homogenized annual dataset for the region and address gaps in current land use and land cover products, such as a lack of detail on crop sequences and peat bog exploitation. To create the maps, we used annual multi-temporal remote sensing data combined with a data encoding structure and deep learning classification. We obtained the training data from publicly available open datasets. The maps were validated using independent field survey data from the Land Use/Cover Area Frame Survey (LUCAS) and expert annotations from high-resolution imagery. The quantitative and qualitative results of the maps provide a reliable data source for monitoring agricultural transformations, peat bog exploitation, and restoration activities in the Baltic Sea region and its surrounding countries.
© 2024. The Author(s).
Conflict of interest statement
Figures


References
-
- Gómez, C., White, J. C. & Wulder, M. A. Optical remotely sensed time series data for land cover classification: A review. ISPRS Journal of Photogrammetry and Remote Sensing116, 55–72, 10.1016/j.isprsjprs.2016.03.008 (2016).
-
- European Union, C. L. M. S. European Environment Agency (EEA) -Dataset: CORINE Land Cover 1990-2018. https://land.copernicus.eu/pan-european/corine-land-cover (2022).
-
- Pflugmacher, D., Rabe, A., Peters, M. & Hostert, P. Mapping pan-European land cover using Landsat spectral-temporal metrics and the European LUCAS survey. Remote Sensing of Environment221, 583–595, 10.1016/j.rse.2018.12.001 (2019).
-
- Buchhorn, M. et al. Copernicus Global Land Cover Layers—Collection 2. Remote Sensing1210.3390/rs12061044 (2020).
-
- Malinowski, R. et al. Automated Production of a Land Cover/Use Map of Europe Based on Sentinel-2 Imagery. Remote Sensing12 (2020).
LinkOut - more resources
Full Text Sources
