. 2024 Nov 18;14(1):28495.
doi: 10.1038/s41598-024-78920-3.

Cooperative role of LSD1 and CHD7 in regulating differentiation of mouse embryonic stem cells

Affiliations

Cooperative role of LSD1 and CHD7 in regulating differentiation of mouse embryonic stem cells

Sandhya Malla et al. Sci Rep. .

Abstract

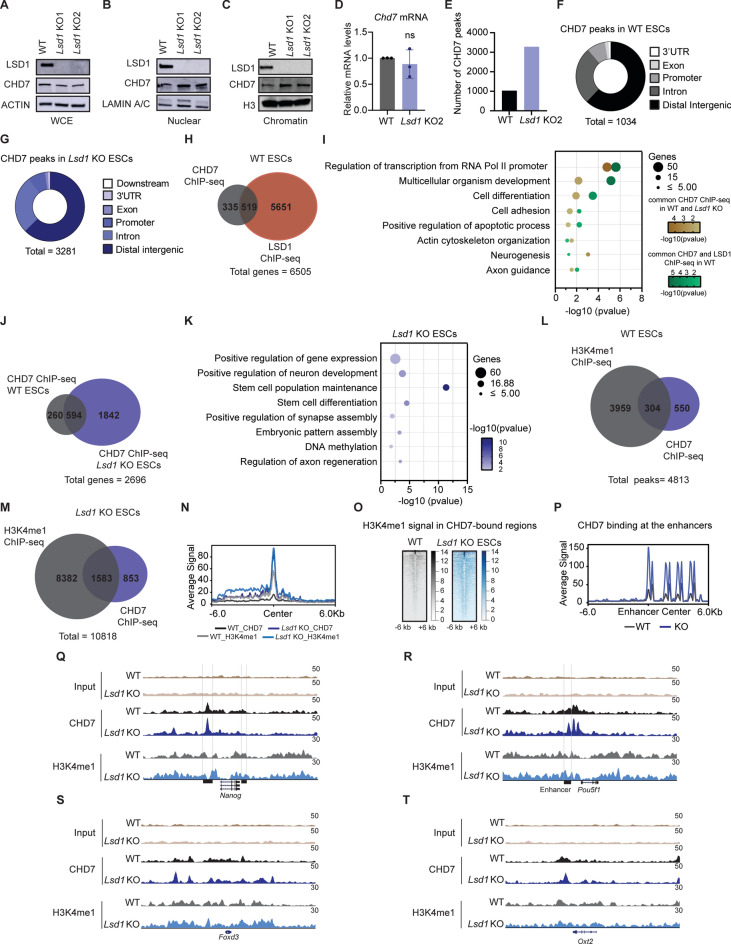
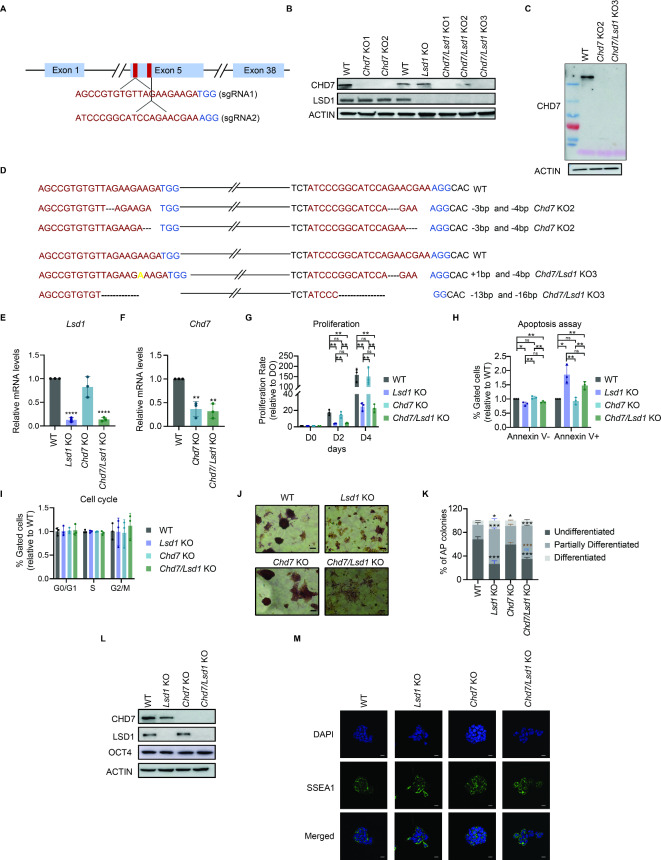
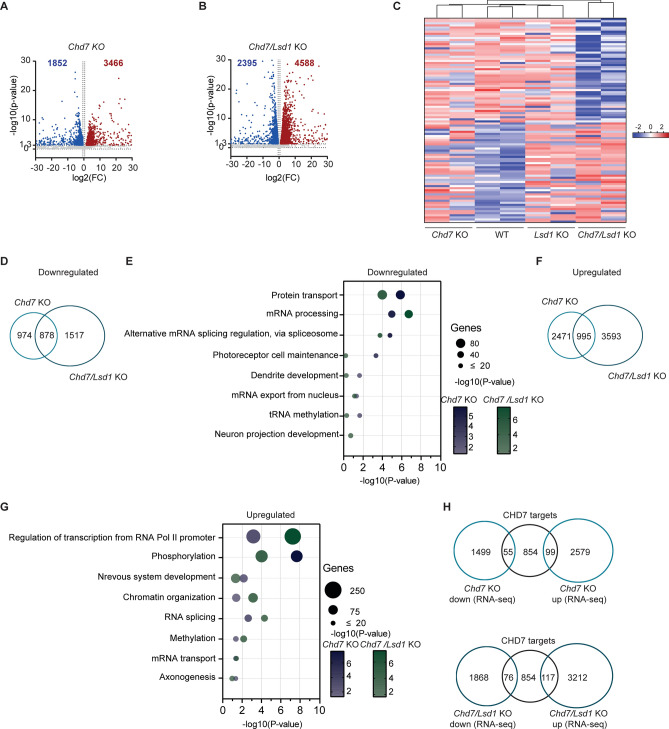
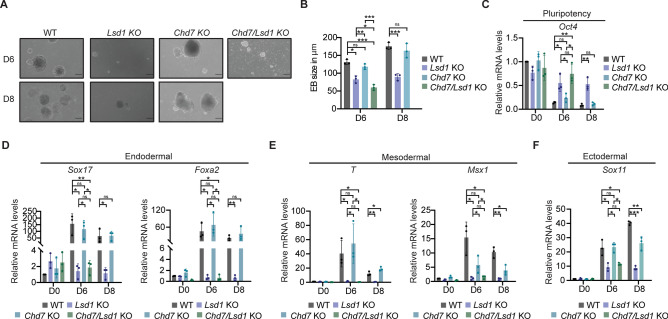
Lysine-specific histone demethylase 1 (LSD1) is a histone demethylase that plays a critical role in epigenetic regulation by removing the methyl group from mono- and di-methylated lysine 4 on histone H3 (H3K4me1/2), acting as a repressor of gene expression. Recently, catalytically independent functions of LSD1, serving as a scaffold for assembling chromatin-regulator and transcription factor complexes, have been identified. Herein, we show for the first time that LSD1 interacts with chromodomain-helicase-DNA-binding protein 7 (CHD7) in mouse embryonic stem cells (ESCs). To further investigate the CHD7-LSD1 crosstalk, we engineered Chd7 and Chd7/Lsd1 knockout (KO) mouse ESCs. We show that CHD7 is dispensable for ESC self-renewal and survival, while Chd7 KO ESCs can differentiate towards embryoid bodies (EBs) with defective expression of ectodermal markers. Intriguingly, Chd7/Lsd1 double KO mouse ESCs exhibit proliferation defects similar to Lsd1 KO ESCs and have lost the capacity to differentiate properly. Furthermore, the increased co-occupancy of H3K4me1 and CHD7 on chromatin following Lsd1 deletion suggests that LSD1 is required for facilitating the proper binding of CHD7 to chromatin and regulating differentiation. Collectively, our results suggest that LSD1 and CHD7 work in concert to modulate gene expression and influence proper cell fate determination.


Conflict of interest statement

Declarations Competing interests The authors declare no competing interests.

Figures

Fig. 1
Fig. 1
CHD7 interacts with LSD1 in ESCs. (A) Scheme representing the workflow for LSD1 immunoprecipitation (IP) and western blot (WB) of LSD1-IP depicting the specificity of LSD1 antibody. IgG was used as a negative control. Input corresponds to 10% of the nuclear extract used for IP. (B) STRING network of LSD1-interacting proteins retrieved from the LC–MS/MS analysis that followed LSD1-IP. Line thickness indicates the strength of data support. (C) GO analysis for cellular components and biological processes of top LSD1-interacting candidates. (D) Molecular functions of the top 13 interacting candidates of LSD1. (E) IP of LSD1 (left panel) and CHD7 (right panel) from nuclear extracts of mouse ESCs followed by WB with anti-LSD1 and anti-CHD7 antibodies. IgG was used as a negative control. Input corresponds to 10% of the nuclear extract used for IP. The represented blots are from different gels of the same biological replicate. (F) IP of LSD1 from nuclear extracts of mouse ESCs pretreated with RNase A (left panel) or DNase I (right panel), followed by WB with anti-LSD1 and anti-CHD7 antibodies. IgG was used as a negative control. Input represents 10% of the nuclear extract used for IP. The represented blots are from different gels of the same biological replicate. (G) Schematic representations of the different domains of CHD7 used for cloning in pCMV8-Flag tagged plasmids. (H) IP of c-MYC from nuclear extracts of HEK293T co-transfected with the indicated constructs from (G) and pSIN-c-MYC containing LSD1 followed by c-MYC and FLAG WB. IgG was used as a negative control. The represented blots are from the same gel of the same biological replicate. Results are one representative of n = 3 independent biological experiments (A, E, F and H) and n = 2 (BD).
Fig. 2
Fig. 2
ChIP-seq analysis of CHD7 and LSD1. (A–C) WB of LSD1 and CHD7 in WCE, nuclear and chromatin fractions of WT and Lsd1 KOs mouse ESCs. ACTIN, LAMIN A/C, and H3 were used as loading controls. The represented blots are from different gels of the same biological replicate. (D) Bar diagram representing RT-qPCR of Chd7 in WT and Lsd1 KO2 mouse ESCs. mRNA levels are relative to WT mouse ESCs. (E) Number of common CHD7 peaks retrieved from two independent biological replicates of CHD7-ChIP seq in WT and Lsd1 KO mouse ESCs. (F and G) Genomic distribution of CHD7 binding in the promoter (within 5 kb upstream of TSS), distal intergenic, exon, UTR, downstream and intron in (F) WT and (G) Lsd1 KO mouse ESCs. (H) Venn diagram of overlapped genes between CHD7 and LSD1 ChIP-seq in WT mouse ESCs. (I) GO analysis of biological processes of genes associated with CHD7 in WT and Lsd1 KO mouse ESCs (brown) and common LSD1 and CHD7 peaks in WT mouse ESCs (green). (J) Venn diagram depicting the genes identified from CHD7 ChIP in WT and Lsd1 KO2 mouse ESCs. (K) GO analysis of biological processes of genes associated with CHD7 ChIP in Lsd1 mouse ESCs. (L and M) Venn diagram representing overlapped genes between H3K4me1 and CHD7 ChIP-seq in (L) WT and (M) Lsd1 KO2 mouse ESCs. (N) Average signal of H3K4me1 and CHD7 ChIP-seq in co-occupied regions in WT and Lsd1 KO2 mouse ESCs. (O) Density plot representing H3K4me1 binding in CHD7 peaks (common with WT and unique to Lsd1 KO2) upon deletion of Lsd1 in mouse ESCs. (P) Occupancy of CHD7 at the enhancers in WT and Lsd1 KO2 mouse ESCs. (Q-T) CHD7 and H3K4me1 ChIP-seq signals in WT and Lsd1 KO2 mouse ESCs at the (Q) Nanog, (R) Pou5f1 (S) Foxd3 and (T) Otx2 genomic regions. Respective inputs are depicted in grey. Enhancers for Nanog and Pou5f1 are marked as black squares. Data are represented as mean ± SD, and each experiment was performed with n = 3 (D) and n = 2 (E) replicates. *P < 0.05, **P < 0.01, ***P < 0.001 and ****P < 0.0001. Data in (D) were analyzed using an unpaired Student’s t-test. Results are one representative of n = 3 independent biological experiments (AC).
Fig. 3
Fig. 3
Assessment of the phenotype of Chd7 and Chd7/Lsd1 KO mouse ESCs. (A) Schematic representation of target sites in the genomic DNA of Chd7. The sgRNAs and PAM sequences are highlighted in red and blue, respectively. (B) Western blot of LSD1 and CHD7 on WCE from selected clones. ACTIN is used as loading control. The represented blots are from different gels. (C) Full western blot of CHD7 on WCE on WT, Chd7 KO2 and Chd7/Lsd1 KO3 mouse ESCs. ACTIN is used as a loading control. (D) Sanger sequencing analysis of Chd7 KO2 (top panel) and Chd7/Lsd1 KO3 mouse ESCs (bottom panel). Deletions and insertions are represented as dashes and in yellow, respectively. (E and F) RT-qPCR of (E) Lsd1 in WT, Lsd1 KO, Chd7 KO, and Chd7/Lsd1 KO ESCs and (F) Chd7 in WT, Chd7 KO and Chd7/Lsd1 KO mouse ESCs. mRNA levels are relative to WT mouse ESCs. (G) Proliferation rate of WT, Lsd1 KO, Chd7 KO, and Chd7/Lsd1 KO mouse ESCs at indicated time points relative to day 0. (H) Percentages of live (Annexin V-) and apoptotic cells (Annexin V +) in WT, Lsd1 KO, Chd7 KO, and Chd7/Lsd1 KO mouse ESCs. (I) Bar diagram depicting the percentages of cells relative to WT at G0/G1, S, and G2/M phases in Lsd1 KO, Chd7 KO, Chd7/Lsd1 KO mouse ESCs. (J) AP staining of WT, Lsd1 KO, Chd7 KO, and Chd7/Lsd1 KO mouse ESCs and (K) Percentages of undifferentiated (UD), partially differentiated (PD), and differentiated (D) colonies from cells analyzed in (K). Scale bars: 20 μm. (L) Western blots of LSD1, CHD7 and OCT4 on the WCE of WT, Lsd1 KO, Chd7 KO and Chd7/Lsd1 KO mouse ESCs. β-ACTIN is used as the loading control. (M) Representative immunofluorescence images of SSEA1 in WT, Lsd1 KO, Chd7 KO and Chd7/Lsd1 KO mouse ESCs. DAPI was used as the nuclear marker. Scale bars, 20 μm. Data are represented as mean ± SD, and each experiment was performed with n = 3 replicates. ns- non-significant, *P < 0.05, **P < 0.01, ***P < 0.001 and **** P < 0.0001. Data in (G, H, and K) were analyzed using an unpaired Student’s t-test, (E, F and I (ns)) analyzed with two-way ANOVA. Each dot in the bar graphs represents independent biological replicates. Statistical comparison for (G, H and I): WT vs Lsd1 KO, Chd7 KO and Chd7/Lsd1 KO; Lsd1 KO vs Chd7 KO and Chd7/Lsd1 KO; and Chd7 KO vs Chd7/Lsd1 KO mouse ESCs. Statistical comparison for K (WT vs Lsd1 KO, Chd7 KO and Chd7/Lsd1 KO is represented in black, Lsd1 KO vs Chd7 KO and Chd7/Lsd1 KO in blue and Chd7 KO vs Chd7/Lsd1 KO mouse ESCs in brown, respectively). Results are one representative of n = 3 independent biological replicates (C, J, L and M).
Fig. 4
Fig. 4
CHD7 regulates transcription of neuronal genes. (A and B) Volcano plots showing the distribution of differentially expressed transcripts in (A) Chd7 KO and (B) Chd7/Lsd1 KO compared to WT mouse ESCs. Red dots represent upregulated genes, blue dots represent down-regulated genes (P < 0.05; fold-change, FC > 1.5). (C) Heatmap depicting upregulated (red) and downregulated (blue) genes retrieved from the RNA-seq data of WT, Lsd1 KO, Chd7 KO and Chd7/Lsd1 KO mouse ESCs. (D) Venn diagram of common downregulated transcripts between Chd7 KO and Chd7/Lsd1 KO ESCs. (E) Biological processes-based GO analysis of downregulated genes in Chd7 KO and Chd7/Lsd1 KO mouse ESCs. (F) Venn diagram of common upregulated transcript between Chd7 KO and Chd7/Lsd1 KO mouse ESCs. (G) Gene ontology analysis of biological processes related to the upregulated genes of Chd7 KO and Chd7/Lsd1 KO compared to WT mouse ESCs. (H and I) Overlap of RNA-seq data of (H) Chd7 KO and (I) Chd7/Lsd1 KO with CHD7 ChIP in WT mouse ESCs showing the downregulated and upregulated genes bound by CHD7. Downregulated and upregulated genes that are bound by CHD7 are depicted in blue and red, respectively.
Fig. 5
Fig. 5
CHD7 is dispensable for EB differentiation. (A) Representative brightfield images of EBs and (B) measurement of EBs size derived from WT, Lsd1 KO, Chd7 KO, and Chd7/Lsd1 KO mouse ESCs at the indicated time points. Scale bars: 200 µm. (CF) RT-qPCR analysis of (C) pluripotency (Oct4), (D) endodermal (Sox17 and Foxa2), (E) mesodermal (T and Msx1), and (F) ectodermal (Sox11) markers in the EBs generated from WT, Lsd1 KO, Chd7 KO, and Chd7/Lsd1 KO mouse ESCs at the indicated days after differentiation. mRNA levels are relative to the expression of WT mouse ESCs at day D0. Data are represented as mean ± SD. *P < 0.05, **P < 0.01, and ***P < 0.001. Data in (BF) were analyzed using an unpaired Student’s t-test. Each dot in the bar graphs represents independent biological replicates. Statistical comparison for (CF): Day 6 (WT vs Lsd1 KO, Chd7 KO and Chd7/Lsd1 KO; Lsd1 KO vs Chd7 KO and Chd7/Lsd1 KO; Chd7 KO vs Lsd1 KO and Chd7/Lsd1 KO mouse ESCs) and Day 8 (WT vs Lsd1 KO, and Chd7 KO mouse ESCs).

References

    1. Kashyap, V. et al. Regulation of stem cell pluripotency and differentiation involves a mutual regulatory circuit of the NANOG, OCT4, and SOX2 pluripotency transcription factors with polycomb repressive complexes and stem cell microRNAs. Stem Cells Dev18 (7), 1093–1108 (2009). - PMC - PubMed
    1. Saunders, A., Faiola, F. & Wang, J. Concise review: Pursuing self-renewal and pluripotency with the stem cell factor Nanog. Stem Cells31 (7), 1227–1236 (2013). - PMC - PubMed
    1. Bernstein, B. E. et al. A bivalent chromatin structure marks key developmental genes in embryonic stem cells. Cell125 (2), 315–326 (2006). - PubMed
    1. Martinez-Gamero, C., Malla, S. & Aguilo, F. LSD1: Expanding functions in stem cells and differentiation. Cells10 (11), 3252 (2021). - PMC - PubMed
    1. Metzger, E. et al. LSD1 demethylates repressive histone marks to promote androgen-receptor-dependent transcription. Nature437 (7057), 436–439 (2005). - PubMed

LinkOut - more resources