

A worldwide study of subcortical shape as a marker for clinical staging in Parkinson's disease
- PMID: 39557903
- PMCID: PMC11574005
- DOI: 10.1038/s41531-024-00825-9
A worldwide study of subcortical shape as a marker for clinical staging in Parkinson's disease
Abstract
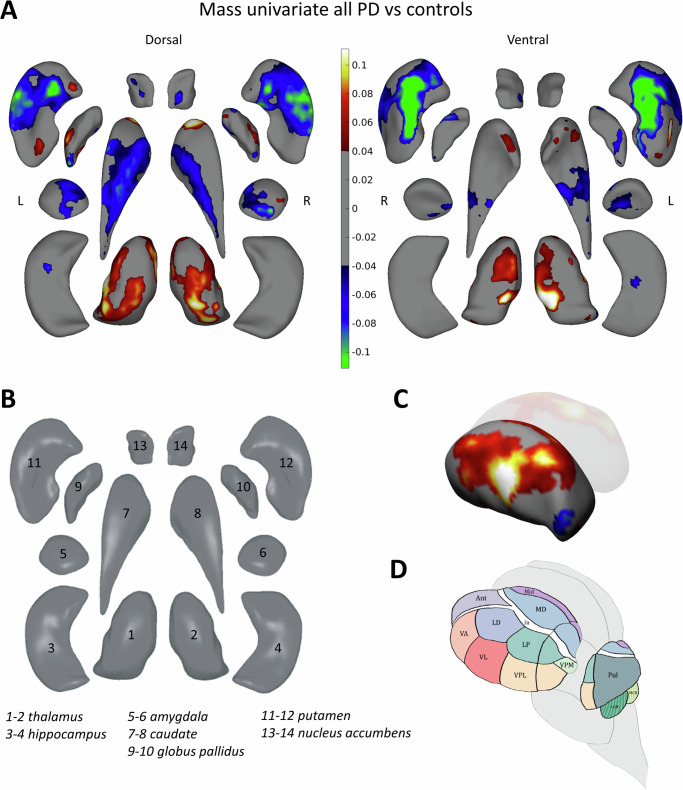
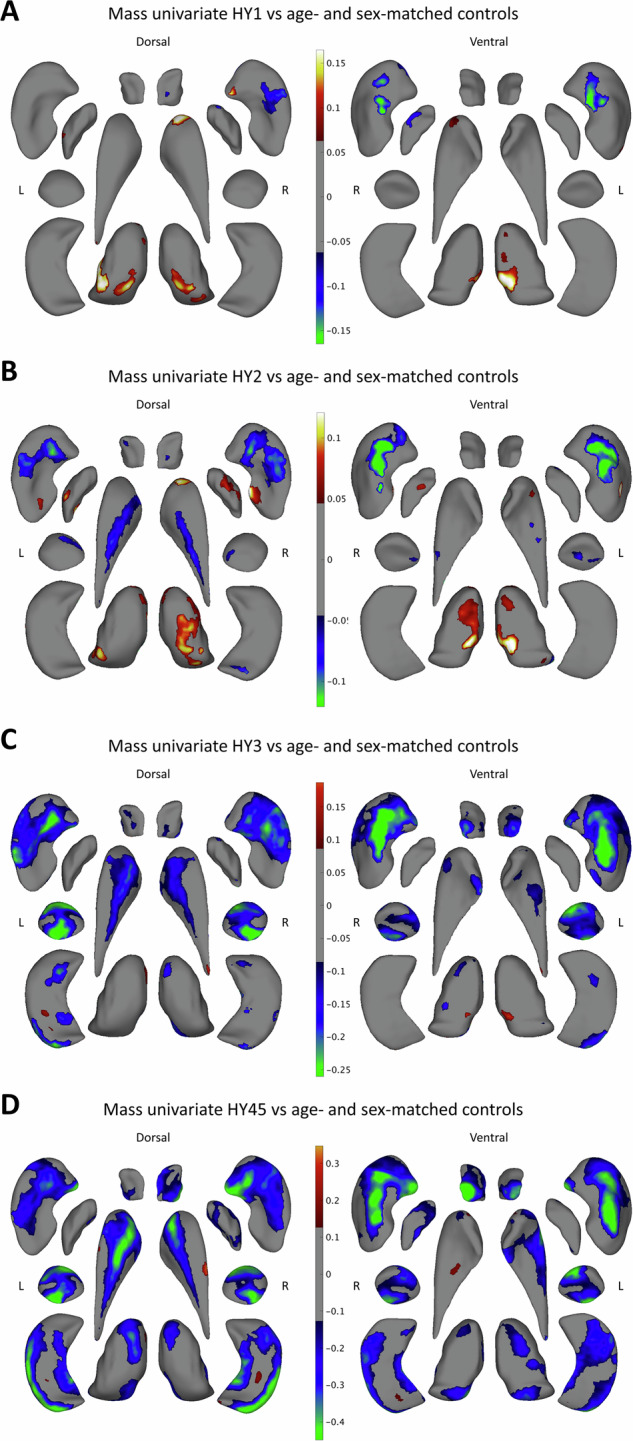
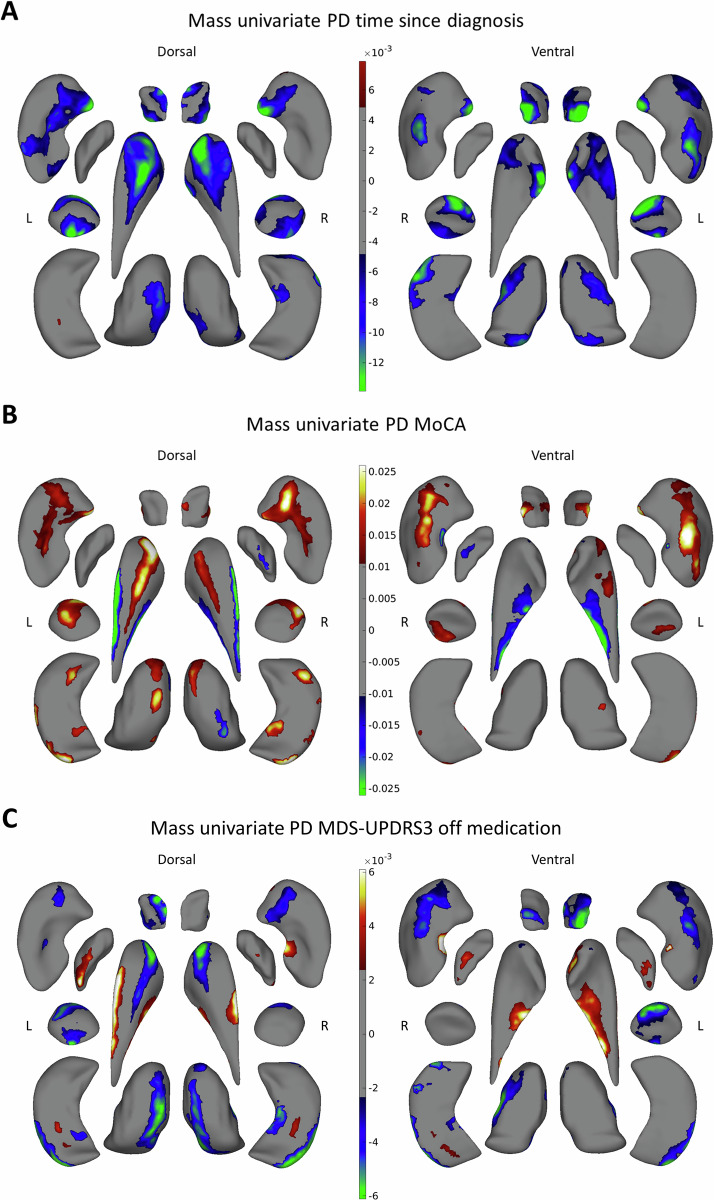
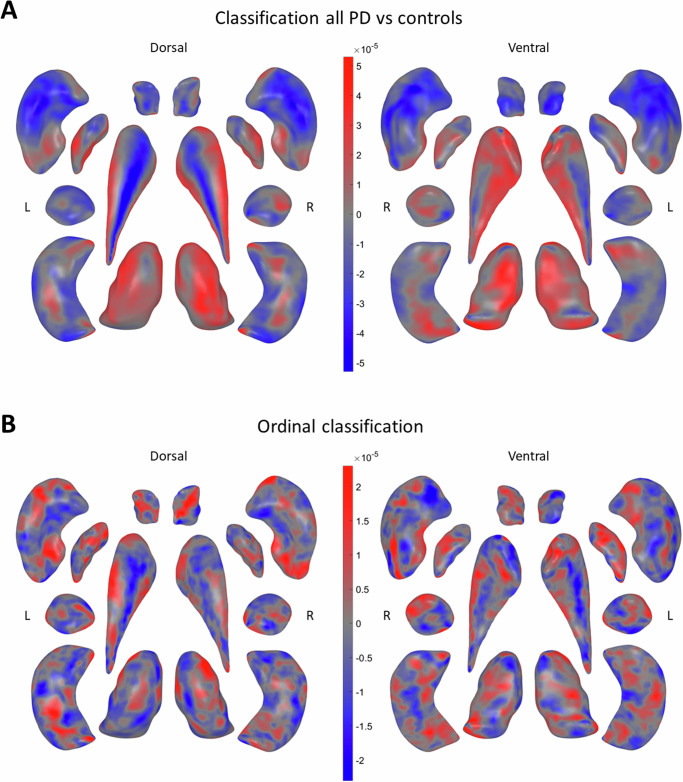
Alterations in subcortical brain regions are linked to motor and non-motor symptoms in Parkinson's disease (PD). However, associations between clinical expression and regional morphological abnormalities of the basal ganglia, thalamus, amygdala and hippocampus are not well established. We analyzed 3D T1-weighted brain MRI and clinical data from 2525 individuals with PD and 1326 controls from 22 global sources in the ENIGMA-PD consortium. We investigated disease effects using mass univariate and multivariate models on the medial thickness of 27,120 vertices of seven bilateral subcortical structures. Shape differences were observed across all Hoehn and Yahr (HY) stages, as well as correlations with motor and cognitive symptoms. Notably, we observed incrementally thinner putamen from HY1, caudate nucleus and amygdala from HY2, hippocampus, nucleus accumbens, and thalamus from HY3, and globus pallidus from HY4-5. Subregions of the thalami were thicker in HY1 and HY2. Largely congruent patterns were associated with a longer time since diagnosis and worse motor symptoms and cognitive performance. Multivariate regression revealed patterns predictive of disease stage. These cross-sectional findings provide new insights into PD subcortical degeneration by demonstrating patterns of disease stage-specific morphology, largely consistent with ongoing degeneration.
© 2024. The Author(s).
Conflict of interest statement
Figures
References
Grants and funding
- U54 NS092091/NS/NINDS NIH HHS/United States
- R01AG059874/Foundation for the National Institutes of Health (Foundation for the National Institutes of Health, Inc.)
- R01 AG066152/AG/NIA NIH HHS/United States
- R01 AG080734/AG/NIA NIH HHS/United States
- U54EB020403/Foundation for the National Institutes of Health (Foundation for the National Institutes of Health, Inc.)
- P01 AG066597/AG/NIA NIH HHS/United States
- RC4 NS073008/NS/NINDS NIH HHS/United States
- R01NS107513/Foundation for the National Institutes of Health (Foundation for the National Institutes of Health, Inc.)
- P30 AG072979/AG/NIA NIH HHS/United States
- 021683/Michael J. Fox Foundation for Parkinson's Research (Michael J. Fox Foundation)
- R01 AG058854/AG/NIA NIH HHS/United States
- 1RO1NS107513-01A1/U.S. Department of Health & Human Services | NIH | National Institute of Neurological Disorders and Stroke (NINDS)
- P41 EB015922/EB/NIBIB NIH HHS/United States
- P01 AG084497/AG/NIA NIH HHS/United States
- T32 AG000258/AG/NIA NIH HHS/United States
- 14848/Michael J. Fox Foundation for Parkinson's Research (Michael J. Fox Foundation)
- R01 AG076832/AG/NIA NIH HHS/United States
- R01 MH116147/MH/NIMH NIH HHS/United States
- P50 NS053488/NS/NINDS NIH HHS/United States
- U01 NS107027/NS/NINDS NIH HHS/United States
- U54 EB020403/EB/NIBIB NIH HHS/United States
- R01 MH117601/MH/NIMH NIH HHS/United States
- 1R01AG058854-01A1/Foundation for the National Institutes of Health (Foundation for the National Institutes of Health, Inc.)
- R01 NS107513/NS/NINDS NIH HHS/United States
- P50 NS062684/NS/NINDS NIH HHS/United States
- R56 AG058854/AG/NIA NIH HHS/United States
- K23 NS075097/NS/NINDS NIH HHS/United States
- R01MH117601/Foundation for the National Institutes of Health (Foundation for the National Institutes of Health, Inc.)
- U19 AG062418/AG/NIA NIH HHS/United States
- R01 AG070885/AG/NIA NIH HHS/United States
- R01MH116147/Foundation for the National Institutes of Health (Foundation for the National Institutes of Health, Inc.)
- R01 NS109260/NS/NINDS NIH HHS/United States
- R01 NS115114/NS/NINDS NIH HHS/United States
- R56AG058854/Foundation for the National Institutes of Health (Foundation for the National Institutes of Health, Inc.)
- R01 AG059874/AG/NIA NIH HHS/United States
LinkOut - more resources
Full Text Sources
Miscellaneous
