. 2024 Nov 18;8(1):265.
doi: 10.1038/s41698-024-00729-0.

Genomic and transcriptomic analyses identify distinctive features of triple-negative inflammatory breast cancer

Collaborators, Affiliations

Genomic and transcriptomic analyses identify distinctive features of triple-negative inflammatory breast cancer

Xiaoping Wang et al. NPJ Precis Oncol. .

Abstract

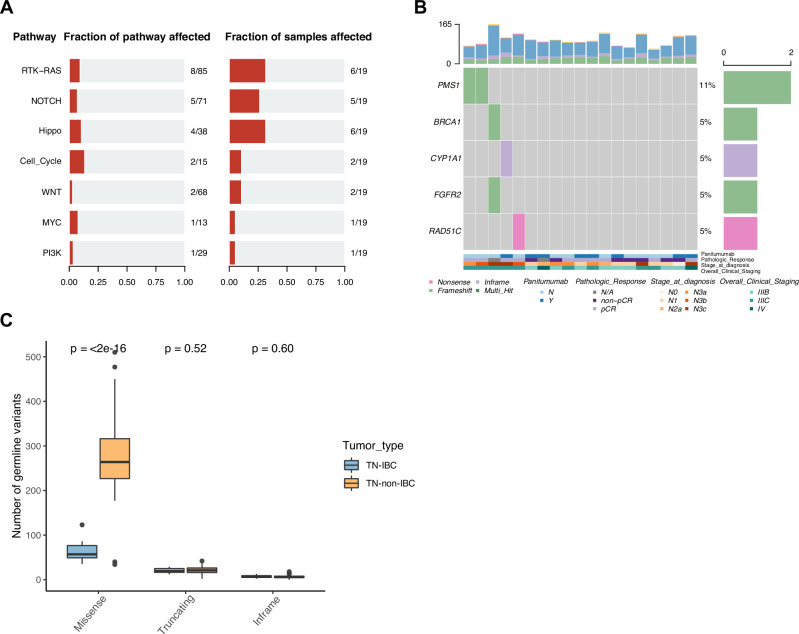
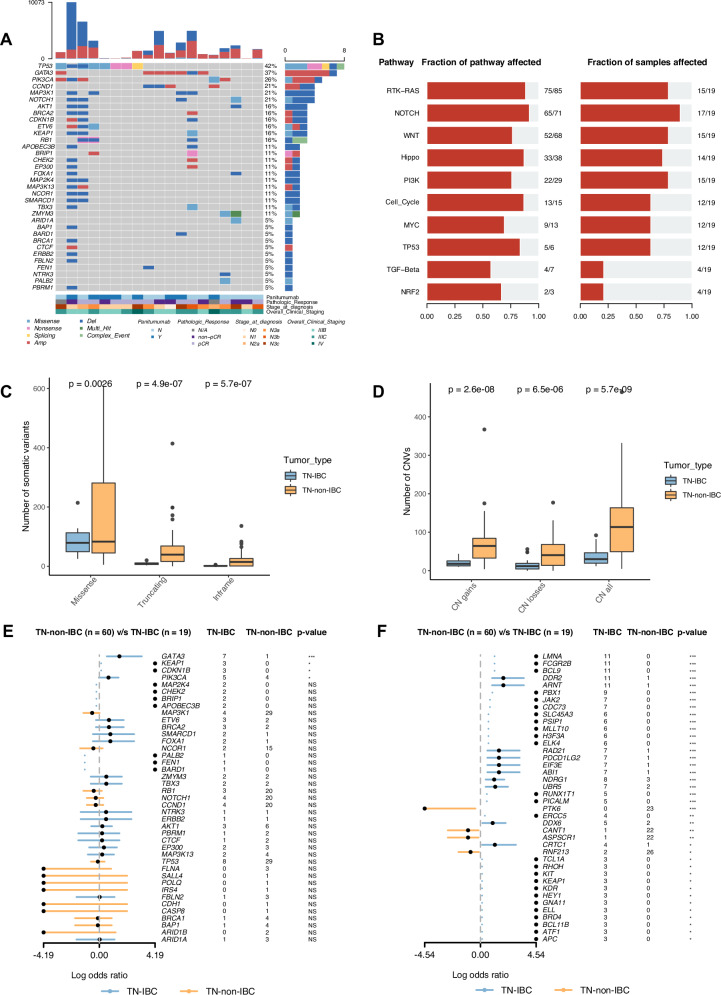
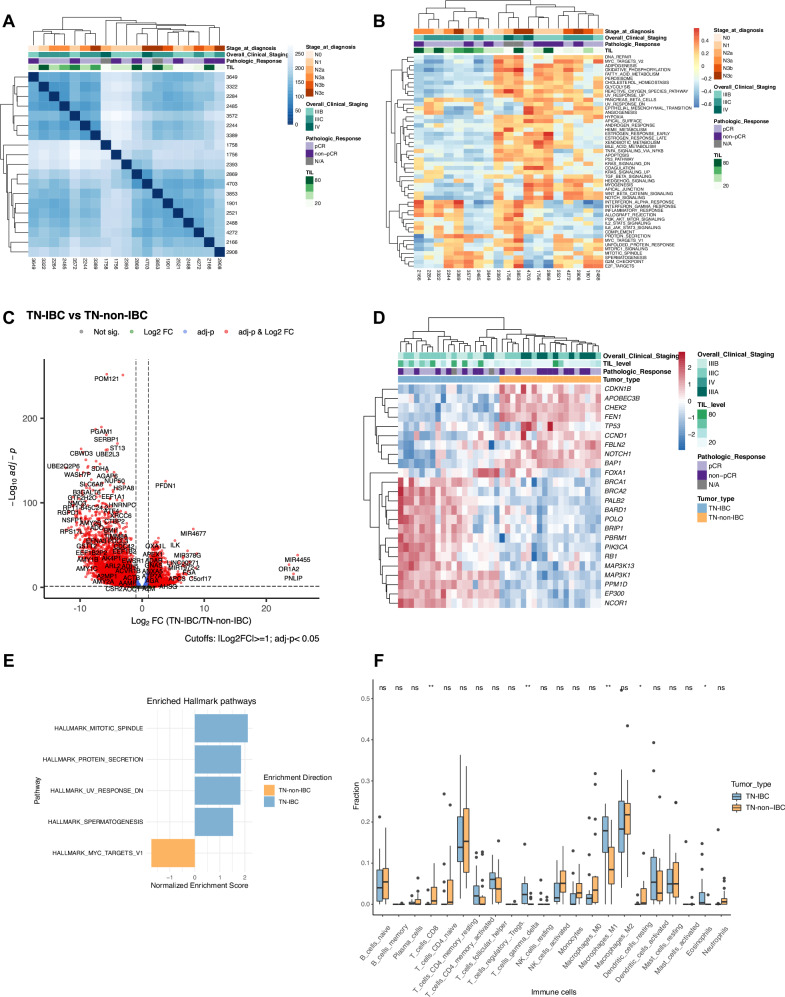
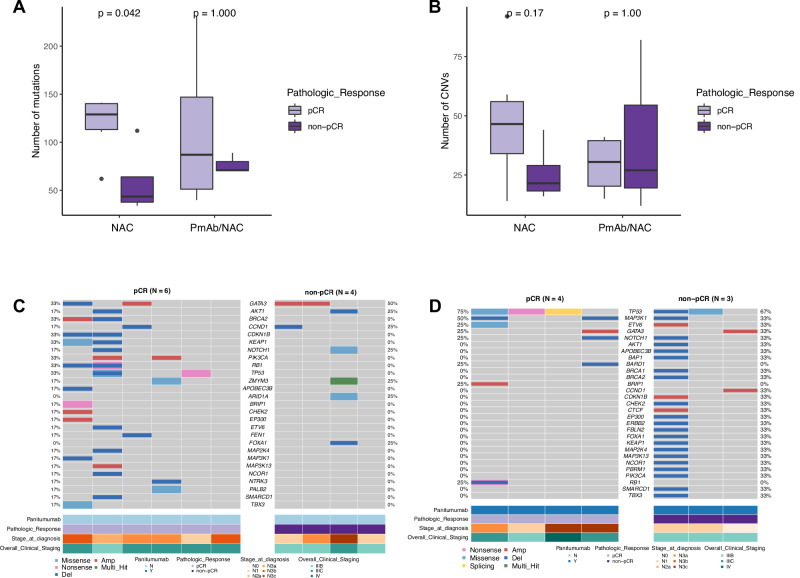
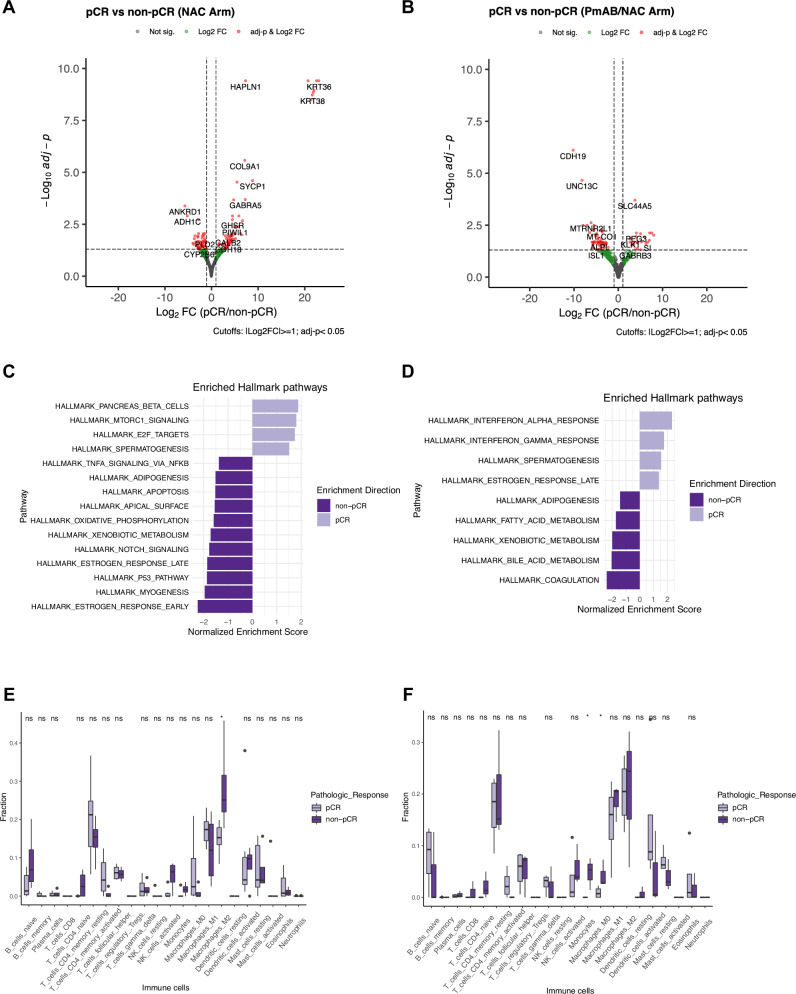
Triple-negative inflammatory breast cancer (TN-IBC) is the most aggressive type of breast cancer, yet its defining genomic, molecular, and immunological features remain largely unknown. In this study, we performed the largest and most comprehensive genomic and transcriptomic analyses of prospectively collected TN-IBC patient samples from a phase II clinical trial (ClinicalTrials.gov, NCT02876107, registered on August 22, 2016) and compared them to similarly analyzed stage III TN-non-IBC patient samples (ClinicalTrials.gov, NCT02276443, registered on October 21, 2014). We found that TN-IBC tumors have distinctive genomic, molecular, and immunological characteristics, including a lower tumor mutation load than TN-non-IBC, and an association of immunosuppressive tumor-infiltrating immune components with an unfavorable response to neoadjuvant chemotherapy. To our knowledge, this is the only study in which TN-IBC and TN-non-IBC samples were collected prospectively. Our analysis improves the understanding of the molecular landscape of the most aggressive subtype of breast cancer. Further studies are needed to discover novel prognostic biomarkers and druggable targets for TN-IBC.


Conflict of interest statement

Competing interests C.Y. has received research support (to the institution) from Amgen, Merck, Genentech, and GSK. N.T.U. holds consulting roles with the following companies: AstraZeneca Pharmaceuticals LP (USA and UK), Bayer AG, Bristol Myers Squibb Company, Carna Biosciences, Inc., CytoDyn Inc., Daiichi Sankyo Co., Ltd., Eisai Co., Ltd., Eli Lilly and Company, Genentech, Inc., Genomic Health, Inc., Gilead Sciences, Inc., Lavender Health, OncoCyte Corporation, Pear Bio, Peptilogics, Inc., Pfizer Inc., Phoenix Molecular Designs, Preferred Medicine, Carisma Therapeutics, Inc., Sysmex Corporation, Takeda Pharmaceutical Company Limited (Japan), and Unitech Medical, Inc. N.T.U. holds consulting roles with the following companies: AstraZeneca Pharmaceuticals LP (USA and UK), Bayer AG, Bristol Myers Squibb Company, Carna Biosciences, Inc., CytoDyn Inc., Daiichi Sankyo Co., Ltd., Eisai Co., Ltd., Eli Lilly and Company, Genentech, Inc., Genomic Health, Inc., Gilead Sciences, Inc., Lavender Health, OncoCyte Corporation, Pear Bio, Peptilogics, Inc., Pfizer Inc., Phoenix Molecular Designs, Preferred Medicine, Carisma Therapeutics, Inc., Sysmex Corporation, Takeda Pharmaceutical Company Limited (Japan), and Unitech Medical, Inc. N.T.U. has ownership of stock: Pear Bio and Phoenix Molecular Designs. N.T.U. holds speaker or preceptorship roles with the following companies: Daiichi Sankyo Co., Ltd., Kyowa Kirin Co., Ltd., Pfizer Inc., AstraZeneca Pharmaceuticals LP, Total Health Conferencing, and Eli Lilly and Company. N.T.U. has research agreements in place with the following companies: AnHeart Therapeutics Inc., Eisai Co., Ltd., Gilead Sciences, Inc., Phoenix Molecular Designs, Daiichi Sankyo, Inc., Puma Biotechnology, Inc., Merck Co., Oncolys BioPharma Inc., OBI Pharma Inc., ChemDiv, Inc., Tolero Pharmaceuticals, Inc., and VITRAC Therapeutics, LLC. All other authors have no relevant conflict of interest disclosures.

Figures

Fig. 1
Fig. 1. Germline mutations identified in TN-IBC and comparison with TN-non-IBC.
A Altered oncogenic pathways affected by germline mutations in TN-IBC. B Germline mutations of breast cancer susceptibility genes in TN-IBC. Top: bar graph defining the total number of different types of germline mutations in each patient; bottom: annotation for PmAb treatment, pathologic response, stage at diagnosis, and overall clinical stage. C Number of germline variants, including missense, truncating, and inframe, in TN-IBC and TN-non-IBC samples. In this boxplot, the center line represents the median of the data. The edges of the box correspond to the 75th percentile and the 25th percentile respectively, showing the interquartile range (IQR). The whiskers extend to the largest and smallest values within 1.5 times the IQR from the 25th and 75th percentiles. Outliers, defined as data points beyond the whiskers, are plotted individually as dots.
Fig. 2
Fig. 2. Somatic alterations identified in TN-IBC and comparison with TN-non-IBC.
A Somatic alterations identified in breast cancer driver genes in TN-IBC. Gene names and relative frequency of mutations are reported in the double y-axis. Top: bar graph defining the total number of different types of somatic alterations in each patient; bottom: annotation for PmAb treatment, pathologic response, stage at diagnosis, and overall clinical staging. B Altered oncogenic pathways affected by somatic alterations in TN-IBC. C,D Number of somatic variants, including missense, truncating, and inframe variants (C), and CNV load, including copy number gains, losses, and both (D), in TN-IBC and TN-non-IBC. E,F Enrichment of somatic alterations in breast-cancer-associated genes (E) and cancer hallmark genes (F) in TN-IBC compared to TN-non-IBC. *P < 0.05; **P < 0.01; ***P < 0.001; NS, not significant. In C and D, the center line represents the median of the data. The edges of the box correspond to the 75th percentile and the 25th percentile respectively, showing the interquartile range (IQR). The whiskers extend to the largest and smallest values within 1.5 times the IQR from the 25th and 75th percentiles. Outliers, defined as data points beyond the whiskers, are plotted individually as dots.
Fig. 3
Fig. 3. Transcriptomic profiles of TN-IBC and comparison with TN-non-IBC.
A Heatmap of sample-to-sample distances calculated from the RNA expression profiles of TN-IBC. B Heatmap of the enrichment scores of cancer hallmark pathways in TN-IBC. C Volcano plot of differentially expressed genes with Log2FC ≥ 1 or ≤−1 and adj-p < 0.05 in TN-IBC compared to TN-non-IBC. D Heatmap of the differentially expressed breast-cancer-associated genes in TN-IBC compared to TN-non-IBC. E GSEA of the significantly enriched hallmark pathways in TN-IBC compared to TN-non-IBC. F Relative immune cell fractions in TN-IBC and TN-non-IBC analyzed by CIBERSORT. *P < 0.05; **P < 0.01; NS, not significant. In A,B,D Top: annotation for stage at diagnosis, overall clinical stage, pathologic response, and TIL. In F, the center line represents the median of the data. The edges of the box correspond to the 75th percentile and the 25th percentile respectively, showing the interquartile range (IQR). The whiskers extend to the largest and smallest values within 1.5 times the IQR from the 25th and 75th percentiles. Outliers, defined as data points beyond the whiskers, are plotted individually as dots.
Fig. 4
Fig. 4. Comparison of somatic alterations between tumor samples collected from TN-IBC patients who did and did not have pCRs in the NAC and PmAb/NAC arms.
A,B Comparison of somatic mutation load (A) and CNV load (B) between TN-IBC patients who did and did not have pCRs in the NAC and PmAb/NAC arms. C,D Somatic alterations of breast-cancer-associated genes identified in tumor samples from TN-IBC patients who did and did not have pCRs in the NAC (C) and PmAb/NAC arms (D). Gene names and relative frequency of mutations are reported in the double y-axis. Bottom: annotation for PmAb treatment, pathologic response, stage at diagnosis, and overall clinical stage. In A and B, the center line represents the median of the data. The edges of the box correspond to the 75th percentile and the 25th percentile respectively, showing the interquartile range (IQR). The whiskers extend to the largest and smallest values within 1.5 times the IQR from the 25th and 75th percentiles. Outliers, defined as data points beyond the whiskers, are plotted individually as dots.
Fig. 5
Fig. 5. Comparison of gene expression and immune cell composition between tumor samples collected from TN-IBC patients who did and did not have pCRs in the NAC and PmAb/NAC arms.
A,B Volcano plots of differentially expressed genes with Log2FC ≥ 1 or ≤−1 and adj-p < 0.05 in tumor samples collected from TN-IBC patients who did and did not have pCRs in the NAC (A) and PmAb/NAC (B) arms. C,D GSEA of the significantly enriched hallmark pathways in tumor samples collected from TN-IBC patients who did and did not have pCRs in the NAC (C) and PmAb/NAC (D) arms. E,F Comparison of the immune cell composition in tumor samples collected from TN-IBC patients who did and did not have pCRs in the NAC (E) and PmAb/NAC (F) arms. *P < 0.05; NS, not significant. In E and F, the center line represents the median of the data. The edges of the box correspond to the 75th percentile and the 25th percentile respectively, showing the interquartile range (IQR). The whiskers extend to the largest and smallest values within 1.5 times the IQR from the 25th and 75th percentiles. Outliers, defined as data points beyond the whiskers, are plotted individually as dots.

References

    1. Cristofanilli, M., Buzdar, A. U. & Hortobagyi, G. N. Update on the management of inflammatory breast cancer. Oncologist8, 141–148 (2003). - PubMed
    1. Abraham, H. G., Xia, Y., Mukherjee, B. & Merajver, S. D. Incidence and survival of inflammatory breast cancer between 1973 and 2015 in the SEER database. Breast Cancer Res Treat.185, 229–238 (2021). - PubMed
    1. Dawood, S. et al. Differences in survival among women with stage III inflammatory and noninflammatory locally advanced breast cancer appear early: a large population-based study. Cancer117, 1819–1826 (2011). - PubMed
    1. Yamauchi, H. et al. Inflammatory breast cancer: what we know and what we need to learn. Oncologist17, 891–899 (2012). - PMC - PubMed
    1. Masuda, H. et al. Long-term treatment efficacy in primary inflammatory breast cancer by hormonal receptor- and HER2-defined subtypes. Ann. Oncol.25, 384–391 (2014). - PMC - PubMed

Associated data

LinkOut - more resources