. 2024 Nov 18;7(1):1527.
doi: 10.1038/s42003-024-07193-3.

Exploring human pancreatic organoid modelling through single-cell RNA sequencing analysis

Affiliations

Exploring human pancreatic organoid modelling through single-cell RNA sequencing analysis

Alessandro Cherubini et al. Commun Biol. .

Abstract

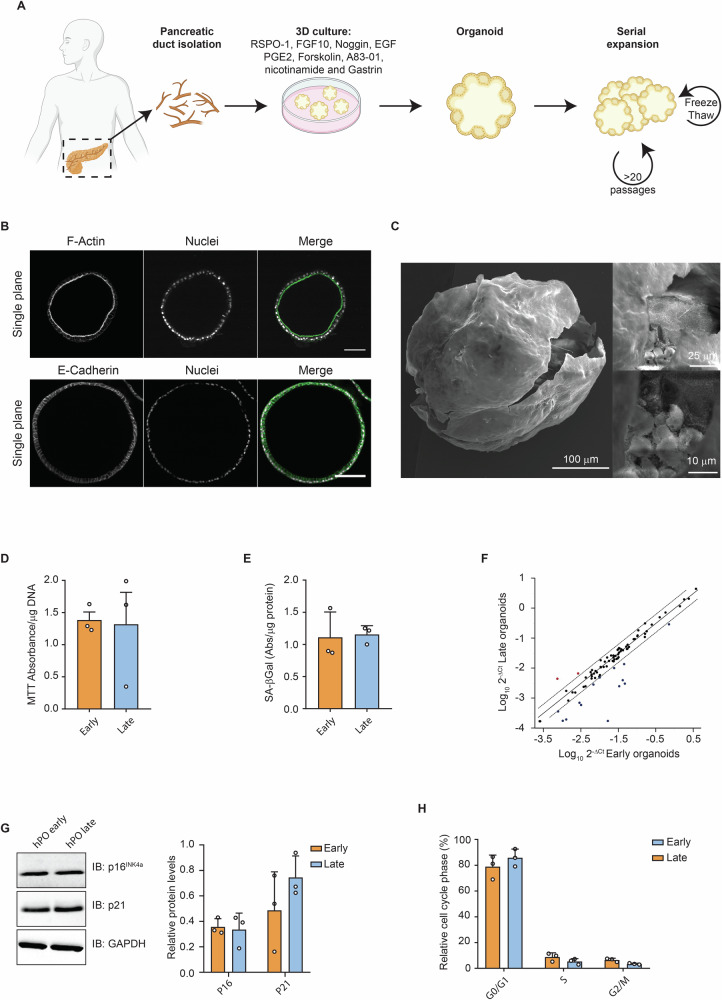
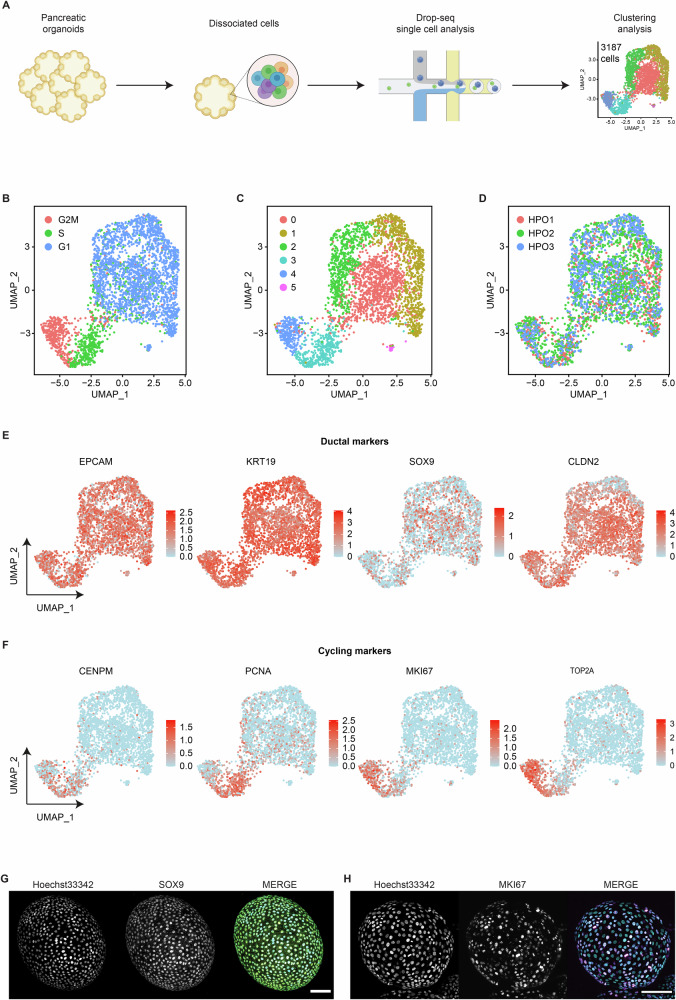
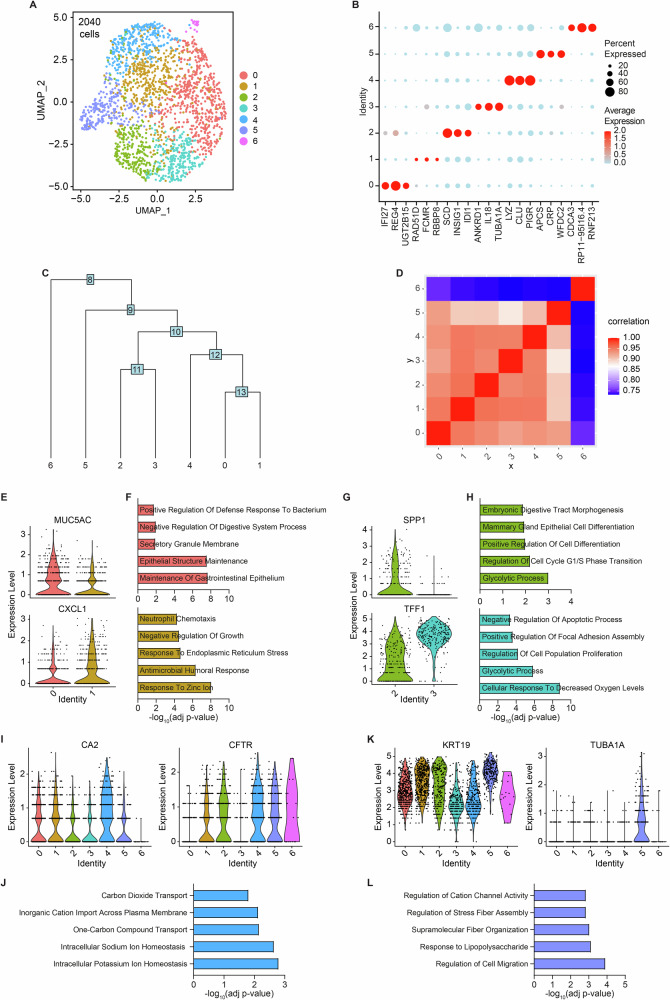
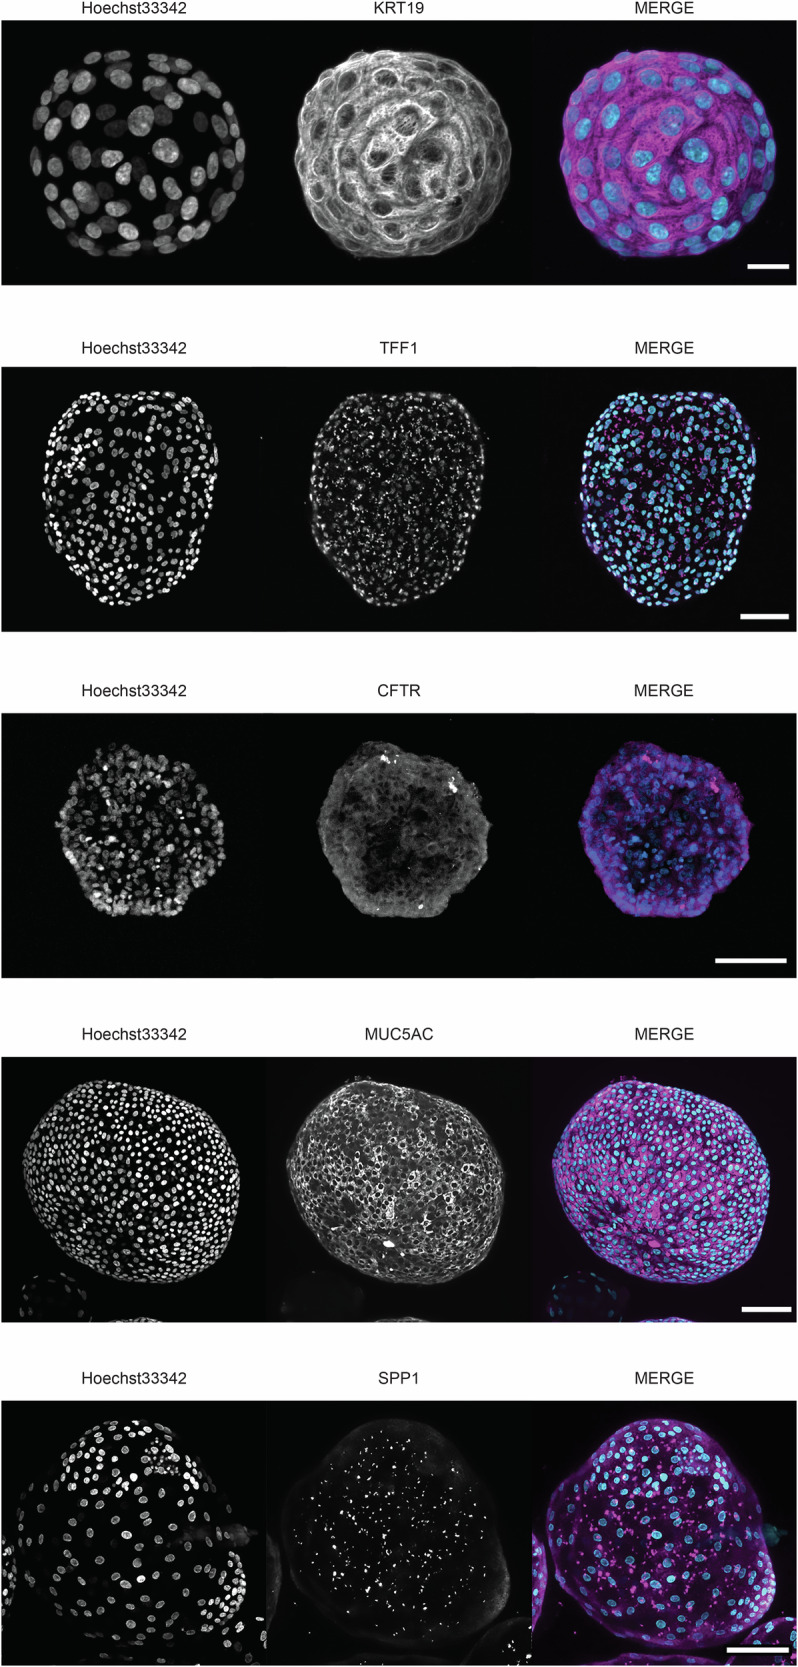
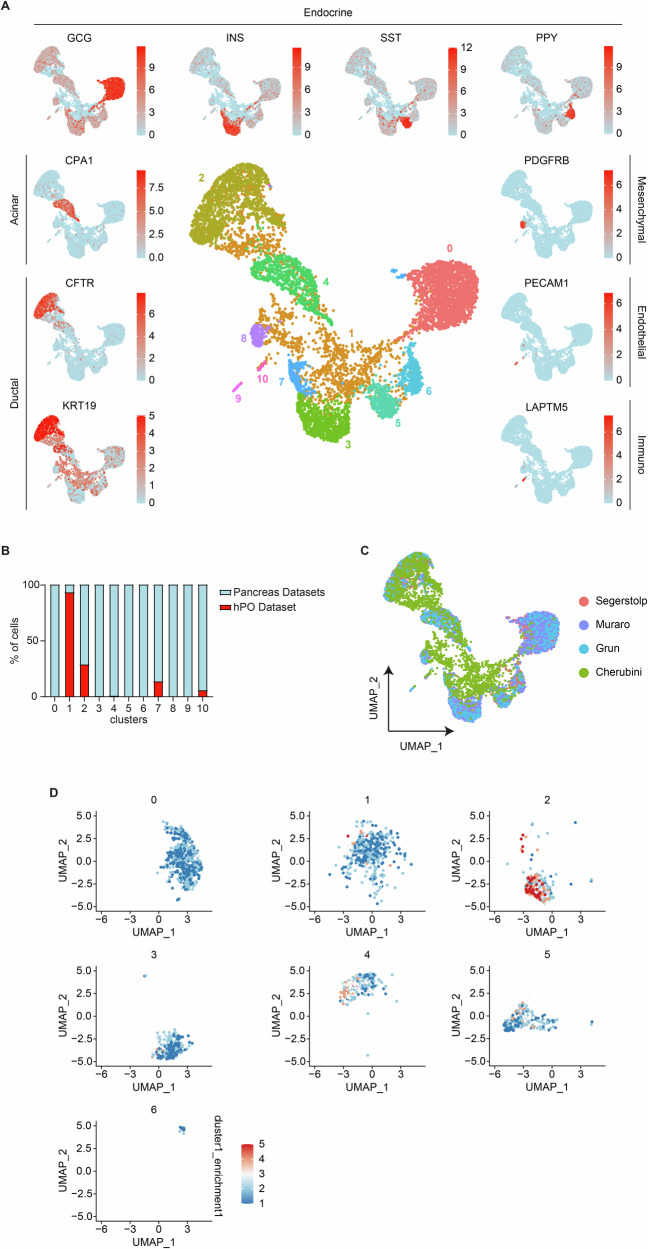
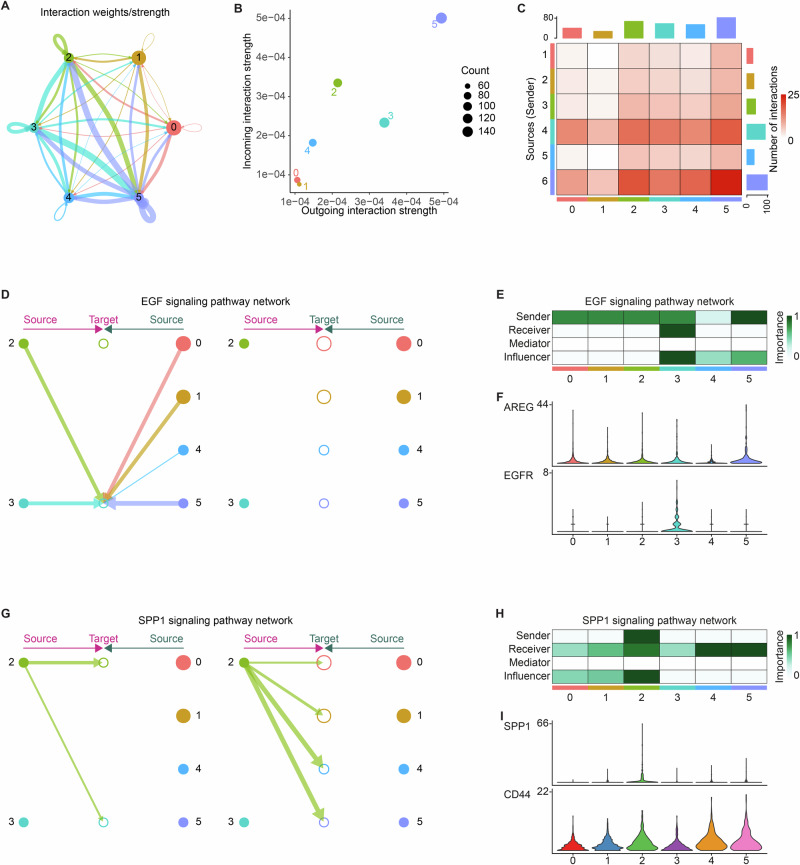
Human organoids have been proposed to be powerful tools mimicking the physiopathological processes of the organs of origin. Recently, human pancreatic organoids (hPOs) have gained increasing attention due to potential theragnostic and regenerative medicine applications. However, the cellular components of hPOs have not been defined precisely. In this work, we finely characterized these structures, focusing first on morphology and identity-defining molecular features under long-term culture conditions. Next, we focused our attention on hPOs cell type composition using single-cell RNA sequencing founding a complex heterogeneity in ductal components, ranging from progenitor components to terminally differentiated ducts. Furthermore, an extensive comparison of human pancreatic organoids with previously reported transcriptomics signature of human and mouse pancreatic ductal populations, confirmed the functional pancreatic duct subpopulation heterogeneity. Finally, we showed that pancreatic organoid cells follow a precise developmental trajectory and utilize diverse signalling mechanisms, including EGF and SPP1, to facilitate cell-cell communication and maturation. Together our results offer an in-depth description of human pancreatic organoids providing a strong foundation for future in vitro diagnostic and translational studies of pancreatic health and disease.


Conflict of interest statement

Competing interests The authors declare no competing interests.

Figures

Fig. 1
Fig. 1. Primary human pancreatic organoids show no senescence-related phenotype in long-term culture.
A Schematic representation of the human pancreatic organoids isolation protocol. Created in BioRender. Cherubini, A. (2024) BioRender.com/m35c022. B Confocal images of day-12 organoids immunostained for the apical marker F-actin (green), the adherent junction marker E-cadherin (green), and DAPI (blue). Scale bars, 200 μm. C Scanning electron microscopic image of a partially opened human pancreatic organoid showing its 3D architecture and basal and apical ultrastructure. Detailed views show the apical surfaces of secretory cells. D Cell viability of hPO early and late passages measured by MTT assay normalized on μg of DNA. Data are means ± SD (n = 3 biologically independent samples). E senescence-associated beta galactosidase (SA-βGal) activity measurement. Data are means ± SD (n = 3 biologically independent samples). F Scatterplots of the PCR array comparing gene expression data of hPO early and late passages. Dashed lines delimitate fold changes (FC) of genes up- (red) and downregulated (blue) in hPO late with respect to hPO early passage. G Western blots of P16INK4a and P21 in hPOs in early and late passages; GAPDH was used as a loading control. Signal quantification is reported. Data are means ± SDs (n = 3 biologically independent samples). H Cell-cycle profiles of hPOs in early and late passages. Data are means ± SD (n = 3 biologically independent samples).
Fig. 2
Fig. 2. Primary human pancreatic organoids show a broad expression of ductal markers and a presence of a subset of cycling cells.
A Schematic representation of the experimental workflow, depicting the collection and processing of human pancreatic organoids for scRNA-seq. Created in BioRender. Cherubini, A. (2024) BioRender.com/e66i954. B UMAP plot of expanded hPO from three distinct donors (n = 3187 cells) labelled by cycling state. C UMAP plot showing cell clusters of the primary human pancreatic organoid scRNA-seq data. D UMAP plot coloured on the basis of hPO line. E UMAP plots indicating the expression of representative ductal markers. F UMAP plots indicating the expression of representative markers associated with proliferation. G Confocal image of day-12 organoids immunostained for the ductal marker SOX9. Scale bar, 100 μm. H Confocal image of day-12 organoids immunostained for the proliferation marker MKI67. Scale bar, 100 μm.
Fig. 3
Fig. 3. Single-cell RNA sequencing pinpoints a ductal heterogeneity in primary human pancreatic organoids.
A UMAP plot depicting the re-clustering of organoids without cells in G2 phase. B Dot plot of the three dot marker genes for each cluster. Rows indicate clusters and columns indicate genes. C Cluster dendrogram created using PlotClusterTree function shows the Euclidean relationships between clusters. D Heatmap of the Spearman correlation matrix calculated using average gene expression for each cluster. E Stacked violin plots show two differentially expressed genes (MUC5AC and CXCL1) in cluster 0 vs. 1. F Five altered biological processes from Gene Ontology comparing cluster 0 vs. 1 are depicted. G Stacked violin plots show two differentially expressed genes (SPP1 and TFF1) in cluster 2 vs. 3. H Five altered biological processes from Gene Ontology comparing cluster 2 vs. 3 are depicted. I Violin plots show two differentially expressed genes (CA2 and CFTR) in cluster 4. J Five biological processes from Gene Ontology enriched in cluster 4. K Violin plots show two differentially expressed genes (KRT19 and TUBA1A) in cluster 5. L Five biological processes from Gene Ontology enriched in cluster 5.
Fig. 4
Fig. 4. Ductal subtype-specific markers located within primary human pancreatic organoids.
Confocal images of day-12 organoids immunostained for the ductal subtype markers (KRT19, TFF1, CFTR, MUC5AC and SPP1) identified by scRNA-seq analysis. Scale bar, 100 μm.
Fig. 5
Fig. 5. Alignment against human whole pancreas transcriptome datasets.
A Integration of primary pancreatic organoids with three primary pancreas scRNA-seq data sets,, into 11 Louvain clusters (middle plot). UMAP expression plots display cell type-specific marker genes for each cluster (surrounding plots). Scale bars for each marker denote average expression in gene counts. B UMAP plot showing distribution of pancreatic organoid cells (green colour) vs. the whole-pancreas datasets. C Stacked bar plots showing the distribution of cells derived from different sample origins in each cell cluster. D Enriched expression of the marker genes for the quiescent progenitor cells defined in Qadir et al. in primary human pancreatic organoids clustering analysis.
Fig. 6
Fig. 6. Primary human organoid progenitors show a transitional trajectory able to differentiate in all ductal cell subtypes.
A Organoid lineage tree inferred by StemID2 is shown in the RaceID3 clusters. Only significant links are shown (P < 0.01). Node colour represents the level of transcriptome entropy, edge colour describes the level of significance, and edge width describes link score. B Barplot of StemID2 scores for RaceID3 clusters. Cluster 17, which shows highest expression of progenitor markers, such as SPP1 and TFF1, receives the highest StemID2 score. C Monocle 3 UMAP and trajectory of primary human pancreatic organoids duct clusters 0–5. D Each cell’s relative pseudotime value is depicted that is a measurement of the distance between its position along the trajectory and the starting point (cluster 4). E Expression changes of the modules generated by Monocle 3 analysis are shown for each cluster. F, G Expression of modules 1, 19, and 13 along trajectory and relative top 5 deregulated gene ontology biological processes terms.
Fig. 7
Fig. 7. Estimation of cell–cell communication within primary human pancreatic organoids using CellChat.
A Circle plots displaying putative ligand-receptor interactions, with the width of edges representing the strength of the communication. B Scatter plots comparing the outgoing and incoming interaction strength in the 2D space in primary human pancreatic organoids. C Heatmaps of the differential number of interactions showing the outgoing and incoming signalling change of each cluster. The top coloured bar plot represents the sum of each column of values displayed in the heatmap (incoming signalling). The right coloured bar plot represents the sum of each row of values (outgoing signalling). D Hierarchical plot shows the inferred intercellular communication network for EGF signalling pathway. Left and right panels highlight the autocrine and paracrine signalling respectively. E Network centrality scores of the EGF signalling pathway for each cluster. F Stacked violin plots showing the expression levels of ligand-receptor pair included in the EGF signalling pathway in the different clusters. G Hierarchical plot shows the inferred intercellular communication network for SPP1 signalling pathway. Left and right panels highlight the autocrine and paracrine signalling respectively. H Network centrality scores of the SPP1 signalling pathway for each cluster. I Stacked violin plots showing the expression levels of ligand–receptor pair included in the SPP1 signalling pathway in the different clusters.

References

    1. Bouwens, L. & Pipeleers, D. G. Extra-insular beta cells associated with ductules are frequent in adult human pancreas. Diabetologia41, 629–633 (1998). - PubMed
    1. Lee, M. G., Ohana, E., Park, H. W., Yang, D. & Muallem, S. Molecular mechanism of pancreatic and salivary gland fluid and HCO3 secretion. Physiol. Rev.92, 39–74 (2012). - PMC - PubMed
    1. Chong, S. K., Lindridge, J., Moniz, C. & Mowat, A. P. Exocrine pancreatic insufficiency in syndromic paucity of interlobular bile ducts. J. Pediatr. Gastroenterol. Nutr.9, 445–449 (1989). - PubMed
    1. Wilschanski, M. & Novak, I. The cystic fibrosis of exocrine pancreas. Cold Spring Harb. Perspect. Med.3, a009746 (2013). - PMC - PubMed
    1. Boxhoorn, L. et al. Acute pancreatitis. Lancet Lond. Engl.396, 726–734 (2020). - PubMed