. 2024 Dec;25(12):2320-2330.
doi: 10.1038/s41590-024-02018-1. Epub 2024 Nov 18.

Cutaneous T cell lymphoma atlas reveals malignant TH2 cells supported by a B cell-rich tumor microenvironment

Affiliations

Cutaneous T cell lymphoma atlas reveals malignant TH2 cells supported by a B cell-rich tumor microenvironment

Ruoyan Li et al. Nat Immunol. 2024 Dec.

Erratum in

  • Author Correction: Cutaneous T cell lymphoma atlas reveals malignant TH2 cells supported by a B cell-rich tumor microenvironment.
    Li R, Strobl J, Poyner EFM, Balbaa A, Torabi F, Mazin PV, Chipampe NJ, Stephenson E, Ramírez-Suástegi C, Shanmugiah VBM, Gardner L, Olabi B, Coulthard R, Botting RA, Zila N, Prigmore E, Gopee NH, Chroscik MA, Kritikaki E, Engelbert J, Goh I, Chan HM, Johnson HF, Ellis J, Rowe V, Tun W, Reynolds G, Yang D, Foster AR, Gambardella L, Winheim E, Admane C, Rumney B, Steele L, Jardine L, Nenonen J, Pickard K, Lumley J, Hampton P, Hu S, Liu F, Liu X, Horsfall D, Basurto-Lozada D, Grimble L, Bacon CM, Weatherhead SC, Brauner H, Wang Y, Bai F, Reynolds NJ, Allen JE, Jonak C, Brunner PM, Teichmann SA, Haniffa M. Li R, et al. Nat Immunol. 2025 Jan;26(1):147. doi: 10.1038/s41590-024-02046-x. Nat Immunol. 2025. PMID: 39622949 Free PMC article. No abstract available.

Abstract

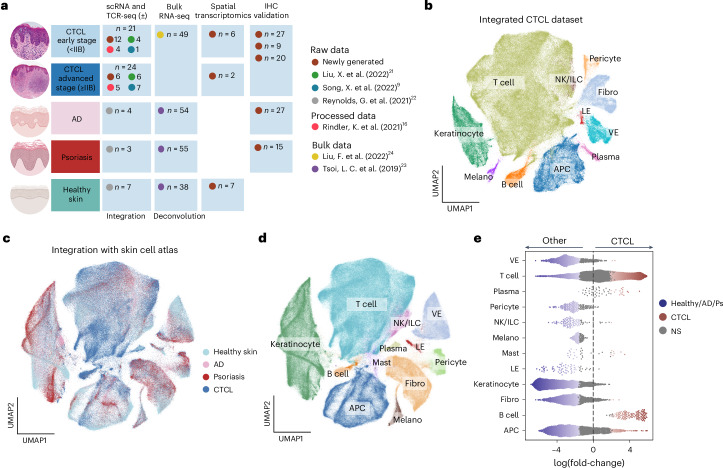
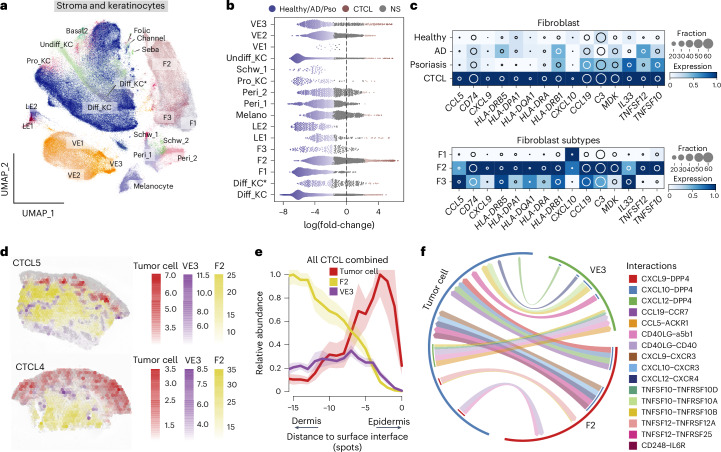
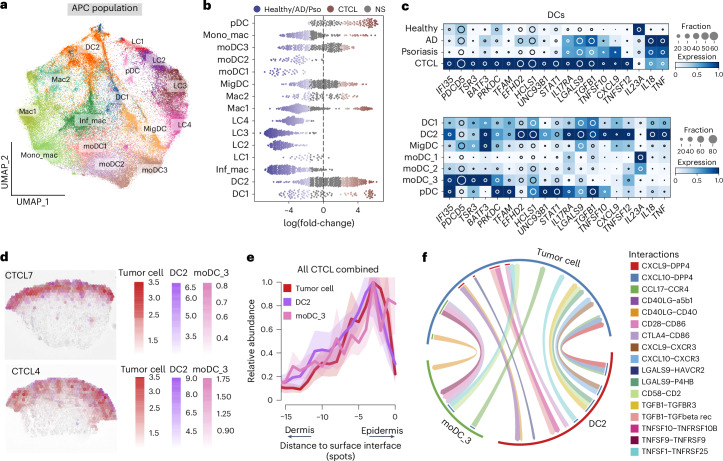
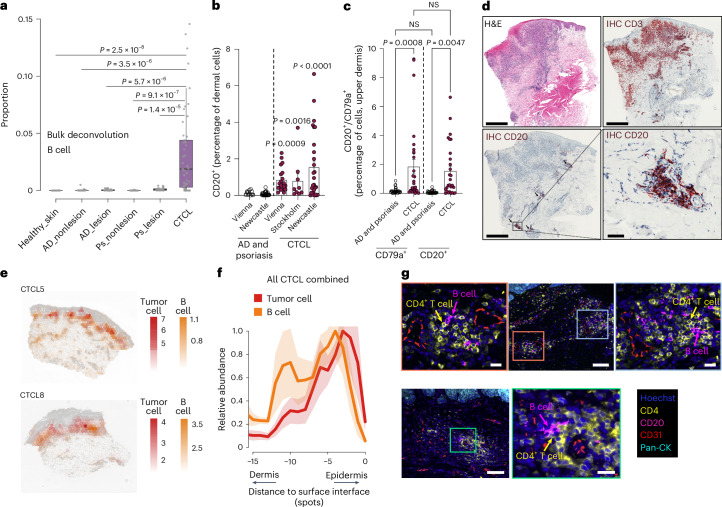
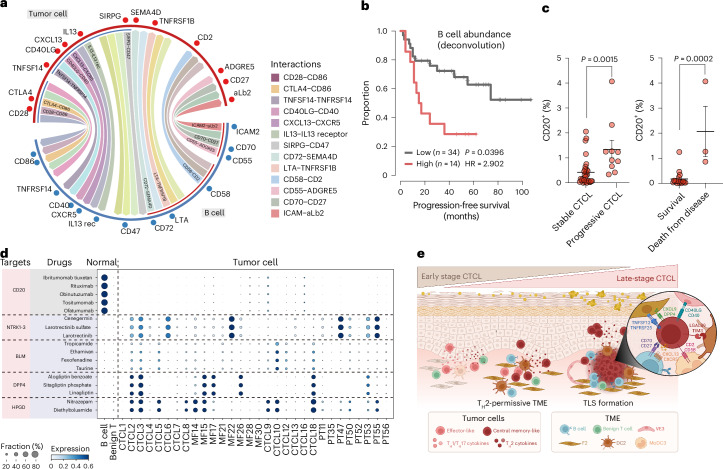
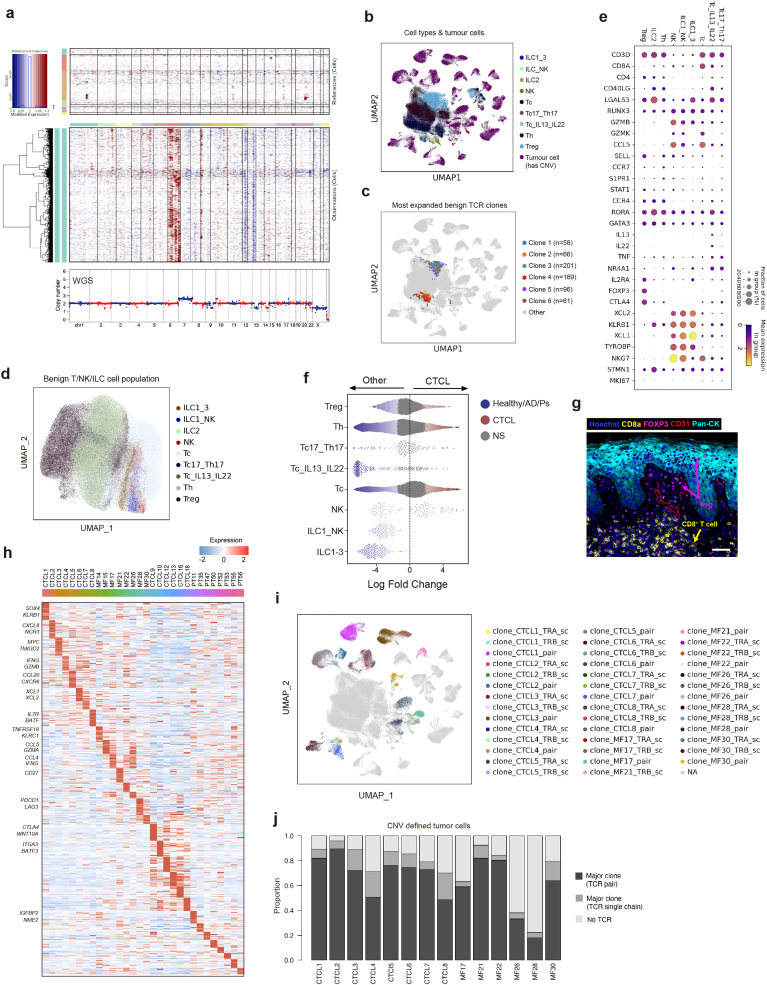
Cutaneous T cell lymphoma (CTCL) is a potentially fatal clonal malignancy of T cells primarily affecting the skin. The most common form of CTCL, mycosis fungoides, can be difficult to diagnose, resulting in treatment delay. We performed single-cell and spatial transcriptomics analysis of skin from patients with mycosis fungoides-type CTCL and an integrated comparative analysis with human skin cell atlas datasets from healthy and inflamed skin. We revealed the co-optation of T helper 2 (TH2) cell-immune gene programs by malignant CTCL cells and modeling of the tumor microenvironment to support their survival. We identified MHC-II+ fibroblasts and dendritic cells that can maintain TH2 cell-like tumor cells. CTCL tumor cells are spatially associated with B cells, forming tertiary lymphoid structure-like aggregates. Finally, we validated the enrichment of B cells in CTCL and its association with disease progression across three independent patient cohorts. Our findings provide diagnostic aids, potential biomarkers for disease staging and therapeutic strategies for CTCL.


Conflict of interest statement

Competing interests: In the past 3 years, S.A.T. has received remuneration for scientific advisory board membership from Sanofi, GlaxoSmithKline, Foresite Labs and Qiagen. She is a co-founder of and holds equity in Transition Bio and Ensocell. From 8 January 2024, she has been a part-time employee of GlaxoSmithKline. The remaining authors declare no competing interests.

Figures

Fig. 1
Fig. 1. Overview of the CTCL dataset and comparisons to skin cell atlas.
a, Detailed summary of newly generated data and integrated external datasets,,– in the present study. b, Overall UMAP showing major cell types in our CTCL dataset. c, UMAPs showing the integrated CTCL and skin cell atlas data colored by diseases. d, UMAPs showing the broad cell types in the CTCL and skin cell atlas integrated object. e, Beeswarm plot of the log-transformed fold-changes in abundance of cells in CTCL versus those in healthy skin, AD and psoriasis from the skin cell atlas. Differential abundance neighborhoods at a false discovery rate (FDR) of 10% are colored. APC, antigen-presenting cells; Fibro, fibroblasts; ILC, innate lymphoid cells; LE, lymphatic endothelial cells; Melano, melanocytes; NS, not significant; VE, vascular endothelial cells.
Fig. 2
Fig. 2. Spatial characterization of CTCL TME.
a, A multiplex protein immunofluorescence image (RareCyte) showing a representative view of CTCL TME. Scale bars, 100 μm and 10 μm (zoomed in). b, IHC staining for CD3 and CD20 in a representative sample. Scale bar, 1 mm. c, Left, dot plot showing estimated NMF weights of cell types across NMF factors (NMF-based microenvironment) using cell2location. The fractions of cells across factors are shown. Right, silhouette score showing the similarity of a cell type to its own microenvironment compared with other microenvironments. Higher values indicate better clustering.
Fig. 3
Fig. 3. Characterization of malignant T cells in CTCL.
a, UMAP visualization of T cells, NK cells and innate lymphoid cells (ILC) in our CTCL dataset. Dots are colored by donors. b, Volcano plot showing DEGs between malignant and benign T cells. Dot color indicates the log2(transformed fold-change). Dot size indicates the log10(transformed Padj values). P values are calculated using a quasi-likelihood F-test and adjusted using the Benjamini–Hochberg procedure. c, Heat map showing gene expression programs and intratumor expression heterogeneity among malignant T cells in a representative patient. Program annotations and representative genes are labeled. The color key indicates scaled expression levels. d, Heat map depicting shared expression metaprograms across all patients. The Jaccard index is used to measure the similarity between any two intratumor expression programs.
Fig. 4
Fig. 4. Comparison of malignant T cells from early stage and advanced-stage CTCL.
a, Heat map of DEGs in early or advanced-stage CTCL samples. Color represents expression level categorized between 0 and 1. The inset circle indicates the percentage of cells expressing a given gene. b, Left, heat map showing the proportion of putative TH1, TH2 and TH17 cell-like malignant cells in each patient with CTCL. Patients are categorized into early or advanced stages. Right, violin plot comparing the proportion of TH2 cell-like malignant cells in early stage (n = 18) and advanced-stage (n = 21) CTCL samples. The P value was calculated using a two-sided Wilcoxon’s rank-sum test. The lower edge, upper edge and center of the box represent the 25th (Q1) percentile, 75th (Q3) percentile and median, respectively. The interquartile range (IQR) is Q3 − Q1. Outliers are values beyond the whiskers (upper, Q3 + 1.5 × IQR; lower, Q1 − 1.5 × IQR).
Fig. 5
Fig. 5. Characterization of the stromal and keratinocyte compartments in CTCL.
a, UMAP visualization of the stromal and keratinocyte (KC) population in the current dataset integrated with skin cell atlas, colored by cell types. b, Beeswarm plot of the log-transformed fold-changes in abundance of stromal cell subsets in CTCL versus those in healthy skin, AD and psoriasis. Differential abundance neighborhoods at FDR of 10% are colored. c, Heat map showing gene expression in CTCL-enriched fibroblasts. The color represents the expression level standardized between 0 and 1. The inset circle indicates the percentage of cells expressing a given gene. d, Spatial mapping of F2, VE3 and tumor cells in two representative samples. The estimated abundance (color intensity) is overlaid on histology images. e, Curve plot showing the mean (across all samples) per-spot normalized abundance of F2, VE3 and tumor cells along the axis to skin surface. Shaded regions represent the 95% 2 s.d. confidence intervals (CIs). f, Circos plot showing putative ligand–receptor interactions between F2 or VE3 and malignant T cells. Representative interactions are colored. Diff, Differentiated; F, fibroblasts; Melano, melanocytes; Schw, Schwann.
Fig. 6
Fig. 6. Characterization of the APC population in CTCL.
a, UMAP visualization of the APC population in the current dataset integrated with skin cell atlas, colored by cell types. b, Beeswarm plot of the log-transformed fold-changes in abundance of stromal cell subsets in CTCL versus those in healthy skin, AD and psoriasis. Differential abundance neighborhoods at FDR of 10% are colored. c, Heat map showing gene expression in CTCL-enriched DCs. The color represents expression level standardized between 0 and 1. The inset circle indicates the percentage of cells expressing a given gene. d, Spatial mapping of DC2, moDC_3 and tumor cells in two representative samples. Estimated abundance (color intensity) is overlaid on histology images. e, Curve plot showing the mean (across all samples) per-spot normalized abundance of DC2, moDC_3 and tumor cells along the axis to the skin surface. Shaded regions represent the 95% 2 s.d. CIs. f, Circos plot showing putative ligand–receptor interactions. Representative interactions are colored.
Fig. 7
Fig. 7. B cell enrichment in CTCL.
a, Box plot showing deconvolution of B cells in bulk RNA-seq datasets of healthy skin (n = 38), AD (nonlesion: n = 27; lesion: n = 27), psoriasis (Ps; nonlesion: n = 27; lesion: n = 28) and CTCL (n = 49). The numbers of samples in the categories are labeled. The P value is calculated using a two-sided Wilcoxon’s rank-sum test. The lower edge, upper edge and center of the box represent the 25th (Q1) percentile, 75th (Q3) percentile and median, respectively. The IQR is Q3 − Q1. Outliers are values beyond the whiskers (upper, Q3 + 1.5 × IQR; lower, Q1 − 1.5 × IQR). b, Bar plot showing IHC staining of CD20 in AD, psoriasis and CTCL skin samples in three independent cohorts (AD or psoriasis cohorts, n = 27, n = 15, respectively; CTCL cohorts, n = 27, 9, 20). The P values were calculated using ordinary one-way analysis of variance (ANOVA) with Tukey’s correction for multiple testing. The error bars show the s.e.m. c, Bar plot showing CD79a+ and CD20+ cells in CTCL (n = 27) and AD or psoriasis (n = 30). The P values were calculated using ordinary one-way ANOVA with Tukey’s correction for multiple testing. Data are shown as individual values and the mean percentage of IHC-positive cells among all cells of the dermis; error bars indicate the s.e.m. d, H&E image and IHC staining for CD3 and CD20 in a representative sample. The zoomed-in box and arrows highlight B cells. Scale bars, 1 mm and 200 μm (zoomed-in). e, Spatial mapping of B cells and tumor cells in two representative samples. The estimated abundance (color intensity) is overlaid on the histology images. f, Curve plot showing the mean (across all samples) per-spot normalized abundance of B cells and tumor cells along the axis to the skin surface. Shaded region represents the 95% 2 s.d. CIs. g, Multiplex protein immunofluorescence images (RareCyte) in two representative tumors. Representative views of B cell and CD4+ T cell interaction are zoomed in. Scale bars, 100 μm and 20 μm (zoomed-in). Images from two patients, representing n = 8 patients (triplicate staining performed for each patient skin sample).
Fig. 8
Fig. 8. B cells interact with malignant T cells and associate with prognosis.
a, Circos plot showing putative ligand–receptor interactions between B cells and malignant T cells. Representative interactions are colored. b, Progression-free survival probability of patients with CTCL according to stratification of B cell abundance estimated by bulk deconvolution. The P value was calculated by multivariate Cox’s regression. c, IHC staining of CD20 in stable and progressive CTCL skin samples and survival and death cases. Data shown as mean percentages of CD20+ cells per mm2 ± s.e.m. (n = 27 (Vienna cohort)). A two-sided, unpaired Student’s t-test was used. d, Dot plot showing the expression of drug targets predicted by drug2cell. e, Schematic of the features depicting the TME of CTCL. Panel e created in BioRender. Strobl, J. (2024) BioRender.com/q48l570.
Extended Data Fig. 1
Extended Data Fig. 1. Overview of the data and data integration.
a, Representative FACS gating strategy for scRNA-seq for dermal (top) and epidermal (bottom) samples. Plots follow on from classical live singlet gating using DAPI and FSC-A/FSC-H/SSC-W respectively. b, UMAP visualisation of the current CTCL data object coloured by patients. c and d, UMAPs of the current CTCL dataset coloured by datasets (c) and skin tissues (d). e, Gene expression dot plot of marker genes for broad cell types. Dot colour indicates log-transformed and normalised expression value. Dot size indicates the percentage of cells in each cell type expressing a given gene. f, UMAPs showing the integrated CTCL and skin cell atlas data coloured by lesion/non-lesion and skin tissues. g, UMAP showing the fine-grained annotations of cell types in the integrated CTCL and skin cell atlas dataset. Labels (annotations) are transferred from the skin cell atlas using CellTypist, except for ‘tumour cell’ which is inferred based on CNVs. h, A multiplex protein immunofluorescence image (Rarecyte) showing a representative view of CTCL TME. Scale bars: 100 μm (zoomed-out) and 20 μm (zoomed-in). Image representative of n = 8 patients.
Extended Data Fig. 2
Extended Data Fig. 2. Malignant and benign T cells.
a, Upper: Heat map showing CNVs inferred from scRNA-seq data in a representative sample (CTCL1). Top panel represents reference normal cells. Bottom heat map represents malignant T cells. Lower: CNVs inferred from whole genome sequencing (WGS) of the same sample. b, UMAP visualisation of the malignant T cell and benign T/NK/ILC cells in our CTCL dataset, coloured by cell types. c, UAMP of all T cells from CTCL skin showing the six most expanded benign T cell clones determined by TCR analysis in the dataset. The size of each expanded clonotype is in the parentheses. d, UMAP visualisation of benign T and NK/ILC populations in integrated CTCL and skin cell atlas data, coloured by cell types. e, Gene expression dot plot of marker genes for T cell and NK/ILC subsets. f, Beeswarm plot of the log-transformed fold changes in abundance of cells in CTCL versus those in healthy skin, AD and psoriasis from skin cell atlas. Differential abundance neighbourhoods at FDR 10% are coloured. NS, not significant. g, A multiplex protein immunofluorescence image (Rarecyte) in a representative tumour. Scale bar, 50 μm. Image representative of n = 8 patients (triplicate staining performed for each patient skin sample). h, Heat map showing inter-tumour DEGs across patients. Representative genes are labelled. i, UMAP of T, NK and ILC cells in our CTCL dataset coloured by the predominant TCR clonotype in each patient. ‘pair’ represents T cells that have both TCR alpha and beta chains. ‘TRA_sc’ represents cells that only have TCR alpha chain. ‘TRB_sc’ represents cells that only have TCR beta chain. j, Bar plot showing the proportion of CNV defined malignant T cells with the major expanded TCR clonotype alpha-beta pair, the major TCR clonotype single alpha or beta chain, and no TCR in each tumour.
Extended Data Fig. 3
Extended Data Fig. 3. Characterisation of malignant T cells in CTCL.
a, Gene expression dot plot of DEGs in malignant T cells across patients in the integrated CTCL datasets. b, IHC staining for TOX and GTSF1 in representative healthy skin, AD, psoriasis and CTCL samples. Scale bar, 100 µm. c, Dot plots comparing the IHC results in healthy skin (n = 6), AD (n = 6), psoriasis (n = 4) and CTCL samples (n = 13). P values are calculated using ordinary one-way ANOVA with Tukey correction for multiple testing. d, Heat map of DEGs between malignant T cells from dermis and epidermis. Colour represents expression level standardised between 0 and 1. The inset circle indicates the percentage of cells expressing a given gene. e, Box plots showing the expression of two gene scores in bulk RNA-seq data. Patients are divided into two groups: stage IIB (without large cell transformation: LCT; n = 18) and over stage IIB plus LCT (n = 30). EM, effector memory; CM, central memory. Gene lists for calculating scores are shown in Fig. 4a. P value is calculated using a two-sided Wilcoxon rank sum test. The lower edge, upper edge and centre of the box represent the 25th (Q1) percentile, 75th (Q3) percentile and the median, respectively. The interquartile range (IQR) is Q3 – Q1. Outliers are values beyond the whiskers (upper, Q3 + 1.5 × IQR; lower, Q1 − 1.5 × IQR).
Extended Data Fig. 4
Extended Data Fig. 4. Characterisation of stromal population in CTCL and comparing with healthy skin, AD and psoriasis.
a, UMAP visualisation of the stromal population in the current dataset integrated with skin cell atlas, coloured by skin conditions. b, Gene expression dot plot of marker genes for stromal cell subsets. Dot colour indicates log-transformed and normalised expression value. Dot size indicates the percentage of cells in each cell type expressing a given gene. c, Box plot of deconvolution of F2 and VE3 in bulk RNA-seq datasets of healthy skin (n = 38), AD (nonlesion: n = 27; lesion: n = 27), psoriasis (nonlesion: n = 27; lesion: n = 28) and CTCL (n = 49). The lower edge, upper edge and centre of the box represent the 25th (Q1) percentile, 75th (Q3) percentile and the median, respectively. The interquartile range (IQR) is Q3 – Q1. Outliers are values beyond the whiskers (upper, Q3 + 1.5 × IQR; lower, Q1 − 1.5 × IQR). d, Dot plot showing MHC-II and co-stimulatory molecules expression in fibroblasts in CTCL. e, Heat maps of DEGs in CTCL enriched keratinocyte, vascular endothelial cell and melanocyte. Colour represents expression level standardised between 0 and 1. The inset circle indicates the percentage of cells expressing a given gene. f, Spatial mapping of F2, VE3 and tumour cells in four representative CTCL samples. Estimated abundance (colour intensity) is overlaid on histology images. g, Curve plot showing the mean (across all samples) per-spot normalised abundance of F2, VE3 (in healthy and CTCL skin) and tumour cells along the axis to skin surface. Shaded regions represent the 95% 2 SD confidence intervals.
Extended Data Fig. 5
Extended Data Fig. 5. Characterisation of APC population in CTCL and comparing with healthy skin, AD and psoriasis.
a, UMAP visualisation of the APC population in the current dataset integrated with skin cell atlas, coloured by skin conditions. b, Gene expression dot plot of marker genes for APC cell subsets. Dot colour indicates log-transformed and normalised expression value. Dot size indicates the percentage of cells in each cell type expressing a given gene. c, Box plot of deconvolution of DC2 in bulk RNA-seq datasets of healthy skin (n = 38), AD (nonlesion: n = 27; lesion: n = 27), psoriasis (nonlesion: n = 27; lesion: n = 28) and CTCL (n = 49). Two-sided Wilcoxon rank-sum. The lower edge, upper edge and centre of the box represent the 25th (Q1) percentile, 75th (Q3) percentile and the median, respectively. The interquartile range (IQR) is Q3 – Q1. Outliers are values beyond the whiskers (upper, Q3 + 1.5 × IQR; lower, Q1 − 1.5 × IQR). d, Spatial mapping of moDC_3, DC2 and tumour cells in two representative samples. Estimated abundance (colour intensity) is overlaid on histology images. e, Curve plot showing the mean (across all samples) per-spot normalised abundance of DC2, moDC_3 (in healthy and CTCL skin) and tumour cells along the axis to skin surface. Shaded regions represent the 95% 2 SD confidence intervals. f, Heat maps of DEGs in CTCL enriched Langerhans cell (LC) and macrophage. Colour represents expression level standardised between 0 and 1. The inset circle indicates the percentage of cells expressing a given gene.
Extended Data Fig. 6
Extended Data Fig. 6. B cell enrichment in CTCL.
a, Bar plot showing number of B cells from patients captured by scRNA-seq. Colours indicate different disease stages. b, UMAPs of B cell population in our dataset coloured by cell subtypes. c, Gene expression dot plot of marker genes for B cell subsets. Dot colour indicates log-transformed and normalised expression value. Dot size indicates the percentage of cells in each cell type expressing a given gene. d, Dot plot showing the expression of follicular T cell marker genes in malignant T cells in three scRNA-seq datasets. e, Dot plot showing the expression of CXCL13 among the T cell population in healthy skin, AD, psoriasis and CTCL. f, Box plot showing the expression of CXCL13 in bulk RNA-seq data from healthy skin (n = 38), AD (nonlesion: n = 27; lesion: n = 27), psoriasis (nonlesion: n = 27; lesion: n = 28) and CTCL samples (n = 49). The lower edge, upper edge and centre of the box represent the 25th (Q1) percentile, 75th (Q3) percentile and the median, respectively. The interquartile range (IQR) is Q3 – Q1. Outliers are values beyond the whiskers (upper, Q3 + 1.5 × IQR; lower, Q1 − 1.5 × IQR). g, Spatial mapping of B cell and tumour cells in two representative samples. Estimated abundance (colour intensity) is overlaid on histology images. h, A multiplex protein immunofluorescence image (Rarecyte) in a representative tumour. A representative view showing B cell and CD4 + T cell interaction is zoomed in. Scale bars, 100 μm and 20 μm. Image representative of n = 8 patients (triplicate staining performed for each patient skin sample). i, Progression free survival probability of CTCL patients according to stratification of B cell abundance estimated by mean expression of CD79A and CD79B. HR, hazard ratio. P value is calculated by multivariate Cox regression. j, IHC staining of CD20 and CD79a in stable and progressive CTCL skin samples, and survival and death cases. Data shown as individual values of CD20+ cells per mm2 +/− SEM and mean percentages of CD79a+ cells among all cells +/− SEM, n = 27 (Vienna cohort). A two-sided unpaired t-test is used. k, Spatial mapping of tumour cells, F2, VE3, moDC_3, DC2 and B cell in Visium data for two representative tumours. Estimated abundance for cell types (colour intensity) across locations (dots) is overlaid on histology images.

References

    1. Dobos, G. et al. Epidemiology of cutaneous T-cell lymphomas: a systematic review and meta-analysis of 16,953 patients. Cancers12, 2921 (2020). - PMC - PubMed
    1. Cai, Z. R. et al. Incidence trends of primary cutaneous T-cell lymphoma in the US from 2000 to 2018: a SEER population data analysis. JAMA Oncol.8, 1690–1692 (2022). - PMC - PubMed
    1. Olsen, E. et al. Revisions to the staging and classification of mycosis fungoides and Sezary syndrome: a proposal of the International Society for Cutaneous Lymphomas (ISCL) and the cutaneous lymphoma task force of the European Organization of Research and Treatment of Cancer (EORTC). Blood110, 1713–1722 (2007). - PubMed
    1. Dummer, R. et al. Cutaneous T cell lymphoma. Nat. Rev. Dis. Primers7, 61 (2021). - PubMed
    1. Willemze, R. et al. The 2018 update of the WHO-EORTC classification for primary cutaneous lymphomas. Blood133, 1703–1714 (2019). - PMC - PubMed

MeSH terms

LinkOut - more resources