. 2024 Dec;21(12):2260-2270.
doi: 10.1038/s41592-024-02496-z. Epub 2024 Nov 18.

Probe set selection for targeted spatial transcriptomics

Affiliations

Probe set selection for targeted spatial transcriptomics

Louis B Kuemmerle et al. Nat Methods. 2024 Dec.

Abstract

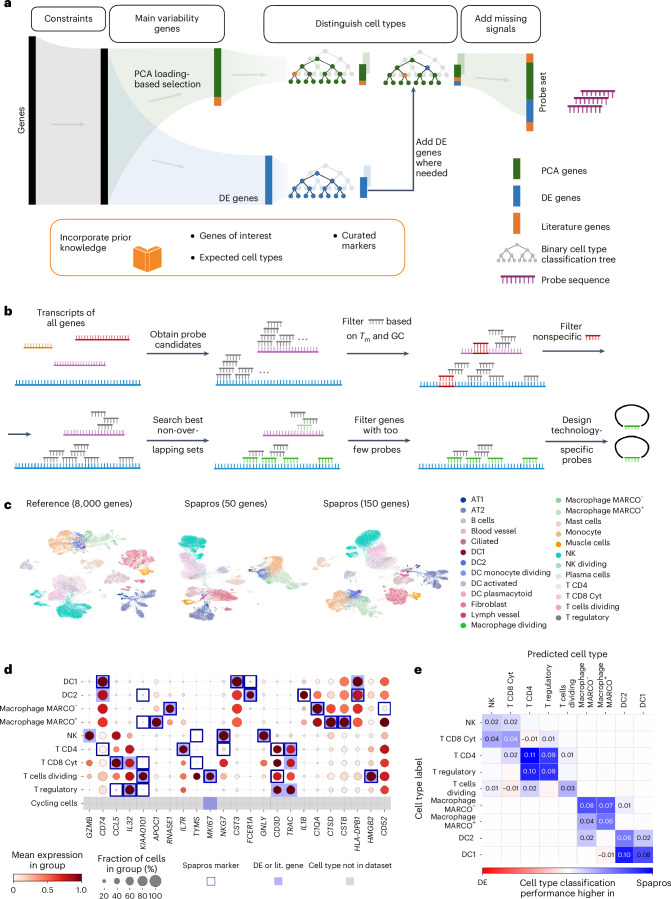
Targeted spatial transcriptomic methods capture the topology of cell types and states in tissues at single-cell and subcellular resolution by measuring the expression of a predefined set of genes. The selection of an optimal set of probed genes is crucial for capturing the spatial signals present in a tissue. This requires selecting the most informative, yet minimal, set of genes to profile (gene set selection) for which it is possible to build probes (probe design). However, current selections often rely on marker genes, precluding them from detecting continuous spatial signals or new states. We present Spapros, an end-to-end probe set selection pipeline that optimizes both gene set specificity for cell type identification and within-cell type expression variation to resolve spatially distinct populations while considering prior knowledge as well as probe design and expression constraints. We evaluated Spapros and show that it outperforms other selection approaches in both cell type recovery and recovering expression variation beyond cell types. Furthermore, we used Spapros to design a single-cell resolution in situ hybridization on tissues (SCRINSHOT) experiment of adult lung tissue to demonstrate how probes selected with Spapros identify cell types of interest and detect spatial variation even within cell types.


Conflict of interest statement

Competing interests: F.J.T. consults for Immunai Inc., CytoReason Ltd, Cellarity and BioTuring Inc., and has an ownership interest in Dermagnostix GmbH and Cellarity. M.D.L. contracted for the Chan Zuckerberg Initiative and received speaker fees from Pfizer and Janssen Pharmaceuticals. P.H., F.K. and T.B. acknowledge support from TKP2021-EGA09, Horizon-BIALYMPH, -SYMMETRY, -SWEEPICS, -Fair-CHARM and OTKA-SNN 139455.

Figures

Fig. 1
Fig. 1. Probe set selection problem and evaluation of selected gene sets.
a, Schematic of the probe set selection problem. A gene set is selected from scRNA-seq data and used for targeted spatial transcriptomics (ST). The gene set is optimized to identify cell types of interest and to capture cellular variation beyond cell types. b, Schematic of the probe design constraint. To measure a specific gene’s expression, there must be enough unique probes that can be designed. The unique sequences only occur in at least the expressed isoforms of the targeted gene and not in any RNA of other genes. Sequences that do not have that property are labeled as shared. c, Performance comparison for gene sets selected with basic feature selection methods and schematic diagrams of our test suite to evaluate the suitability of selected gene sets for targeted spatial transcriptomic experiments. The test suite includes multiple metrics that are categorized in variation recovery, cell type classification, gene redundancy, computation time and fulfillment of experimental constraints. The aggregated score is the average between variation recovery metrics and the first two cell type classification (classif.) metrics. The red star for DE selected genes indicates that the selection method used cell type annotations in the selection. Acc., accuracy; expr., expression; perc., percent.
Fig. 2
Fig. 2. The Spapros probe set selection pipeline.
a, Schematic diagram of the probe set selection pipeline. b, Schematic of the transcriptome-wide probe design pipeline. Genes for which not enough probes can be designed are filtered out before gene set selection (first step in a). For the selected gene set, technology-specific ready-to-order probes are designed (final step in a) (created with https://www.biorender.com). c, UMAP comparison of probe sets selected with Spapros for 50 and 150 genes and a reference of 8,000 HVGs for the Madissoon2020 human lung dataset. d, Dot plot of probes selected on the lung dataset. Genes are ordered by the Spapros ranking system based on feature importance (Methods). For each cell type, the genes that are important for cell type classification based on the forest classification step are highlighted (Spapros marker). A minimum number of markers per cell type (DE or literature (lit.) gene) defined by the user is selected. For cell types not found in the dataset, genes from a curated marker list are added. KIAA0101 refers to the PCNA clamp associated factor (PCLAF). e, Difference of cell type classification confusion matrices between gene sets of Spapros and DE selections. AT1, type I alveolar cell; AT2, type II alveolar cell; DC1, type 1 dendritic cell; DC2, type 2 dendritic cell; NK, natural killer cell; T CD4, CD4+ T cell; T CD8 Cyt, cytotoxic CD8+ T cell.
Fig. 3
Fig. 3. Spapros probe sets identify cell types and spatial variation within cell types.
Spatial lung data measured with SCRINSHOT technology for a probe set selected with Spapros. a, Mean expression in spatial cell types in an intralobar lung sample (blue) and in cell types from the single-cell reference (red). The shown genes are identified as the most important genes for cell type identification in the Spapros selection. b, Annotated cell types in the intralobar lung sample. ce, Spatial distribution of two orthogonal variation axes within tracheal basal cells. Alv, alveolar. c, FOS expression in the UMAP of the scRNA-seq reference dataset and expression of FOS, KRT15 and S100A2 in the magnified basal and goblet subset. d,e, UMAP (d) and spatial distribution (e) of FOS, KRT15 and S100A2 in basal cells in a tracheal lung sample.
Fig. 4
Fig. 4. Spapros outperforms classical selection strategies and state-of-the-art methods.
a, Table showing mean performances of Spapros and other methods, based on 20 bootstrap samples for selecting 50 genes from the Madissoon2020 lung dataset. Methods that use cell type information are annotated with a red star. b, P values from two-sided t-tests comparing the aggregated scores of these methods on the bootstrap samples in a. Methods are ranked by mean performance. c, Two-sided paired t-test P values for the mean aggregated scores across 12 datasets on 50-gene selections. d, Pareto front showing the tradeoff between variation recovery and cell type classification scores for 50-gene selections from the Madissoon2020 lung data. e, Correlation between variation recovery scores on dissociated data and CCI recovery on spatial data, using matched snRNA-seq and MERFISH data from the human brain. Data are presented as mean values ± s.d. over selections on seven bootstrap samples of the snRNA-seq reference for selecting 50 genes. f, Performance benefit of probe design constraint: comparison of the aggregated scores for different methods after excluding genes failing probe design criteria, using 50-gene selections from 20 bootstrap samples of the Madissoon2020 data. Center line, median; box limits, upper and lower quartiles; whiskers, 1.5× interquartile range; points, outliers.
Extended Data Fig. 1
Extended Data Fig. 1. Spapros evaluations show cell type specific classification performance.
Evaluations on the Madissoon2020 dataset. a, Normalized cell type classification confusion matrices (red color scale) for gene sets of 150 genes selected with DE, PCA, HVG, and random selection, and linearly smoothed step function of the diagonal elements at 0.8 (blue color scale). The summary metrics cell type classification accuracy and percentage of captured cell types are the means of the diagonal and the thresholded values respectively. b, Maximal Pearson correlation of marker genes from a curated marker list and gene sets selected with DE, HVG, PCA, SPCA, as well as highest expressed and randomly selected genes. In the bottom heatmap values below the maximum correlation of each cell type are masked (gray). The summary metrics marker correlation and cell type balanced marker correlation are the row means of all genes (top heatmap) and per cell type (bottom heatmap) respectively.
Extended Data Fig. 2
Extended Data Fig. 2. Variation recovery metrics for different granularity levels and correlation evaluations.
a, Clustering similarity and neighborhood overlap metrics evaluated on the Madissoon2020 dataset of gene sets with 150 genes selected with PCA, DE, SPCA, HVG, as well as highest expressed genes and random selection. The summary metrics coarse and fine clustering similarity are the AUCs of the normalized mutual information in the intervals [6,20] and [21,60] respectively, and neighborhood overlap is the AUC of knn overlaps over multiple k’s. b, Gene correlation on the Madissoon2020 dataset of gene sets with 150 genes selected with DE, PCA, SPCA, HVG, as well as highest expressed genes and random selection. The redundancy score is a linearly smoothed step function at 0.8 of the maximal correlation of each gene. The summary metrics gene correlation and percentage of highly expressed genes are the AUCs of the normalized mutual information in the intervals [6,20] and [21,60] respectively, and neighborhood overlap is the AUC of knn overlaps over multiple k’s.
Extended Data Fig. 3
Extended Data Fig. 3. Correspondance between dissociated and spatial evaluations.
a, Correlation between performance metrics on dissociated and spatial data based on matched snRNA-seq and MERFISH human brain data. Data are presented as mean values ± SD over selections on 7 bootstrap samples of the snRNA-seq reference for selecting 50 genes. b, Correlation between spatial variation metric on the MERFISH data and fine clustering similarity on the snRNA-seq data. Same error bars as in (a).
Extended Data Fig. 4
Extended Data Fig. 4. Spapros outperforms state-of-the-art methods.
Heatmap of our evaluation metrics comparing Spapros with recently published methods as well as DE, and PCA-based selections. We compared selections of 50 and 150 genes for lung and heart data sets. Methods are sorted and ranked by the aggregated score of variation recovery and cell type classification. Methods that use cell type information are annotated with a red star.
Extended Data Fig. 5
Extended Data Fig. 5. Spapros selections show robust cross dataset performance.
a, UMAPs of the three lung datasets with unified cell type annotations for cross dataset evaluation. b, Cross dataset evaluations of selections on the lung data sets and on the donor samples within each data set. Cell type clfs. perform. is the average of the metrics cell type classification accuracy and percentage of captured cell types. Variability recovery is the average of the metrics coarse and fine clustering similarity, and neighborhood overlap.
Extended Data Fig. 6
Extended Data Fig. 6. Intra-cell type variation and validation with IF.
a, Validation of the spatially variable FOS signal in tracheal basal cells. FOS expression of adjacent IF and SCRINSHOT samples are correlated along the registered annotated tracheal epithelium. b, Spatial intra-cell type variation of genes in the intralobar SCRINSHOT lung sample.
Extended Data Fig. 7
Extended Data Fig. 7. Uniqueness of Spapros on balancing performance metrics.
Pareto fronts, showing the trade-off between variation recovery and cell type classification scores for 50- and 150-gene selections from the Madissoon2020 lung and Litvinukova2020 heart data.
Extended Data Fig. 8
Extended Data Fig. 8. Method benchmark significance tables.
a, P-values from two-sided t-tests comparing cell type recovery, variation recovery, and the aggregated score of the different selection methods on selections on bootstrap samples of the Madissoon2020 lung data for 50- and 150-genes selections. Methods are ranked by mean performance. b, Two-sided paired t-test P-values for the mean scores of the same metrics across 12 datasets on 50- and 150-gene selections.
Extended Data Fig. 9
Extended Data Fig. 9. Cell-cell interactions of selected gene sets for MERFISH human brain data.
Volcano plots of the 16 cell type interaction pairs with the highest number of significant genes affected by cell-cell interaction of the given cell type pair (based on two-sided Wald-tests of the NCEM model on MERFISH human brain data). Significant hits are shown for a 150 genes Spapros selection on snRNA-seq human brain data. Genes of the selected gene set are highlighted by star symbols. P-values of 0 were set to the minimal non-zero observed p-value of ~10−16.
Extended Data Fig. 10
Extended Data Fig. 10. Proportion of probe design filtered genes and technical aspects of Spapros and selections.
a, Proportion of genes that pass the SCRINSHOT probe design constraints for the same datasets. Center line, median; box limits, upper and lower quartiles; whiskers, 1.5x interquartile range; points, outliers. b, Computation time and c, memory of Spapros selections for datasets with different numbers of cell types and cells per cell type. The filled area shows the standard deviation. d, Computation time of different steps in the Spapros gene set selection. Center line, median; box limits, upper and lower quartiles; whiskers, 1.5x interquartile range; points, outliers. Each box comprises typical selection scenarios of 100 selections with different numbers of sampled cells per cell type over 5 datasets (same selections as for (b) and (c)).

References

    1. Aldridge, S. & Teichmann, S. A. Single cell transcriptomics comes of age. Nat. Commun.11, 4307 (2020). - PMC - PubMed
    1. Tabula Muris Consortium et al. Single-cell transcriptomics of 20 mouse organs creates a Tabula Muris. Nature562, 367–372 (2018). - PMC - PubMed
    1. Asp, M. et al. A spatiotemporal organ-wide gene expression and cell atlas of the developing human heart. Cell179, 1647–1660 (2019). - PubMed
    1. Zhang, M. et al. Spatially resolved cell atlas of the mouse primary motor cortex by MERFISH. Nature598, 137–143 (2021). - PMC - PubMed
    1. Moffitt, J. R. et al. Molecular, spatial, and functional single-cell profiling of the hypothalamic preoptic region. Science362, eaau5324 (2018). - PMC - PubMed

LinkOut - more resources