. 2024 Dec;16(12):3057-3088.
doi: 10.1038/s44321-024-00159-2. Epub 2024 Nov 18.

Salmonella cancer therapy metabolically disrupts tumours at the collateral cost of T cell immunity

Affiliations

Salmonella cancer therapy metabolically disrupts tumours at the collateral cost of T cell immunity

Alastair Copland et al. EMBO Mol Med. 2024 Dec.

Abstract

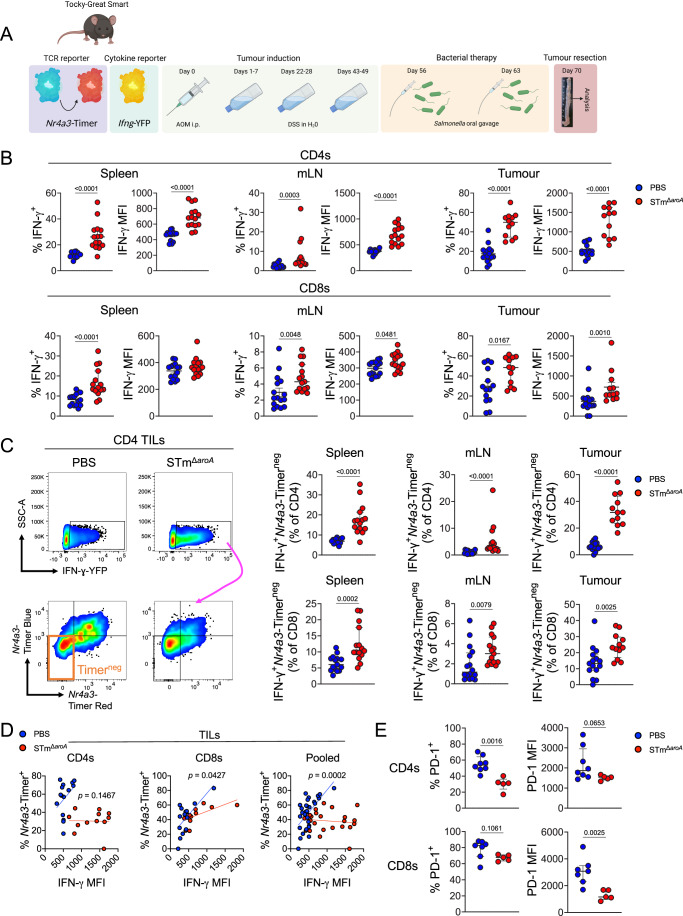
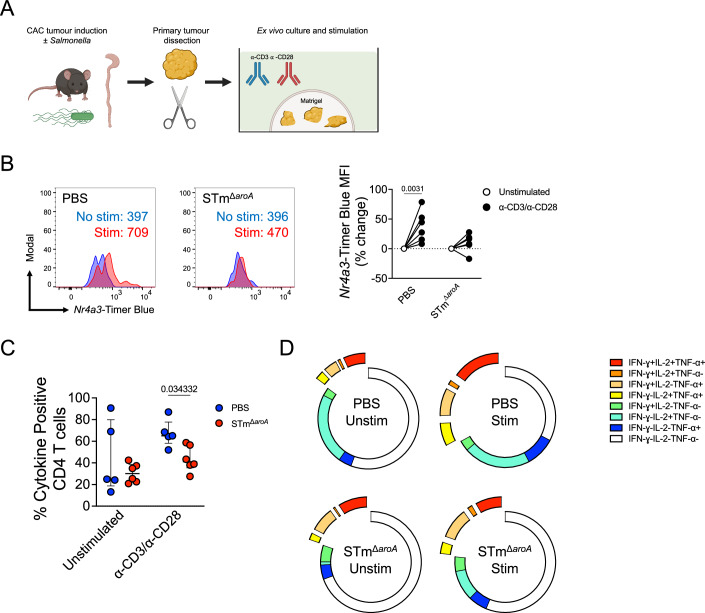
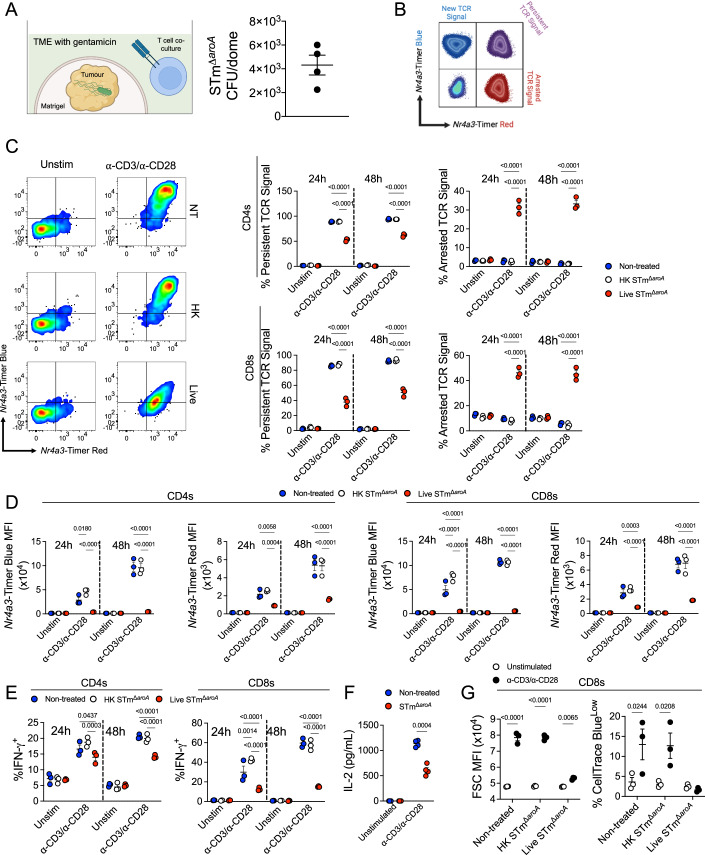
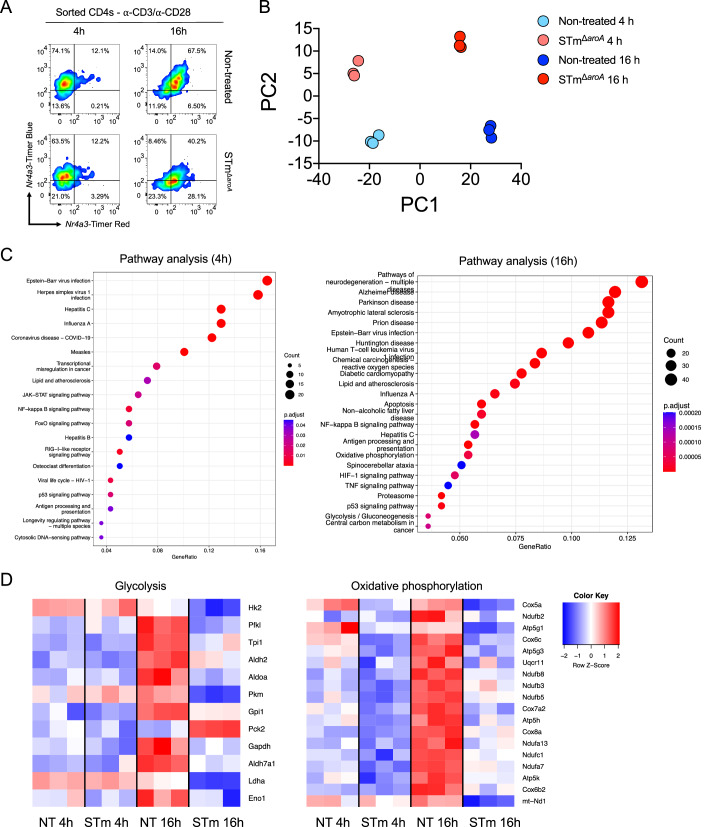
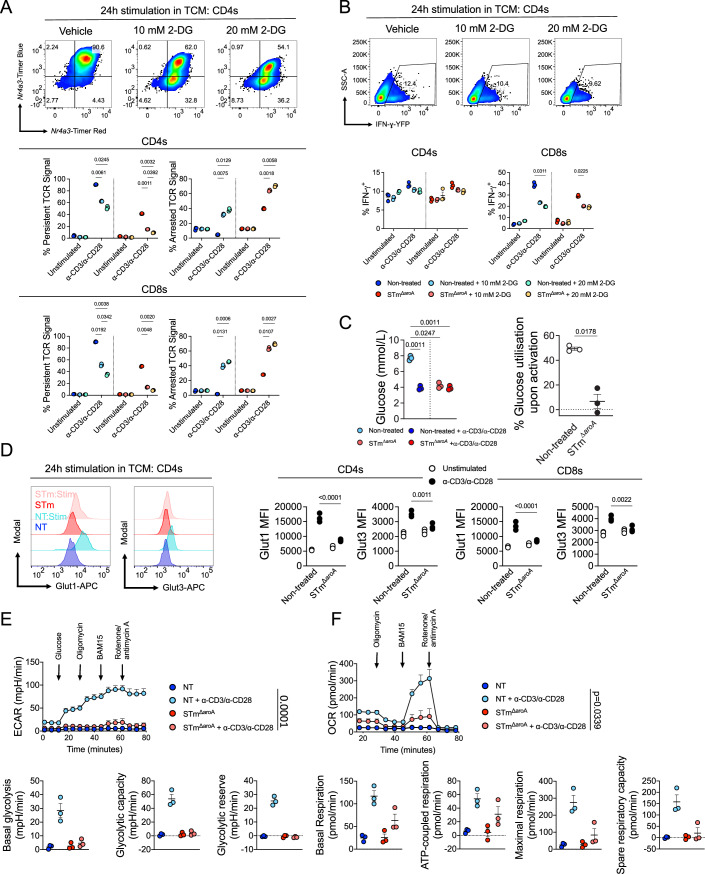
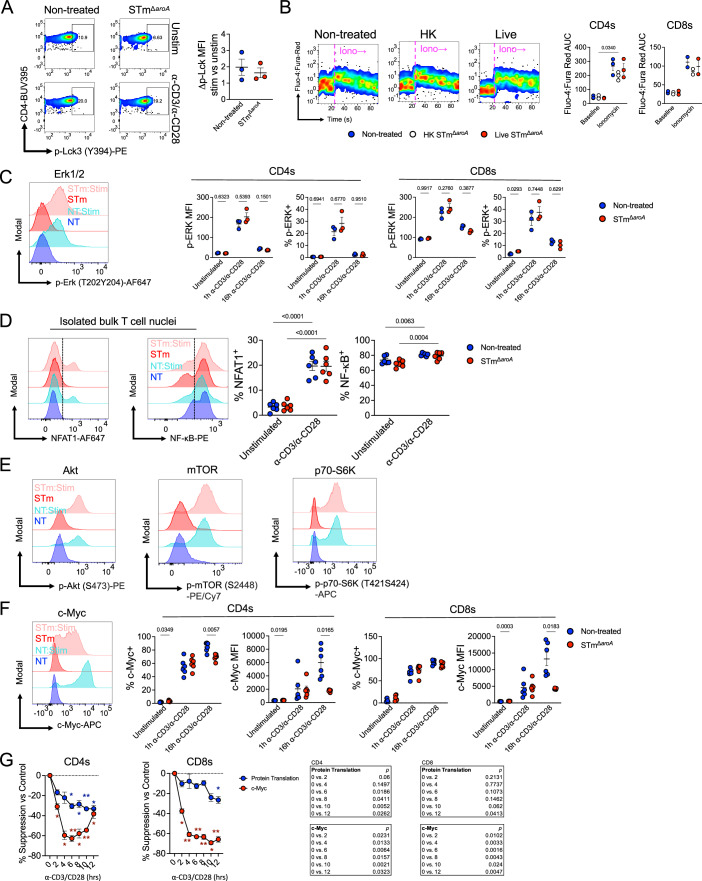
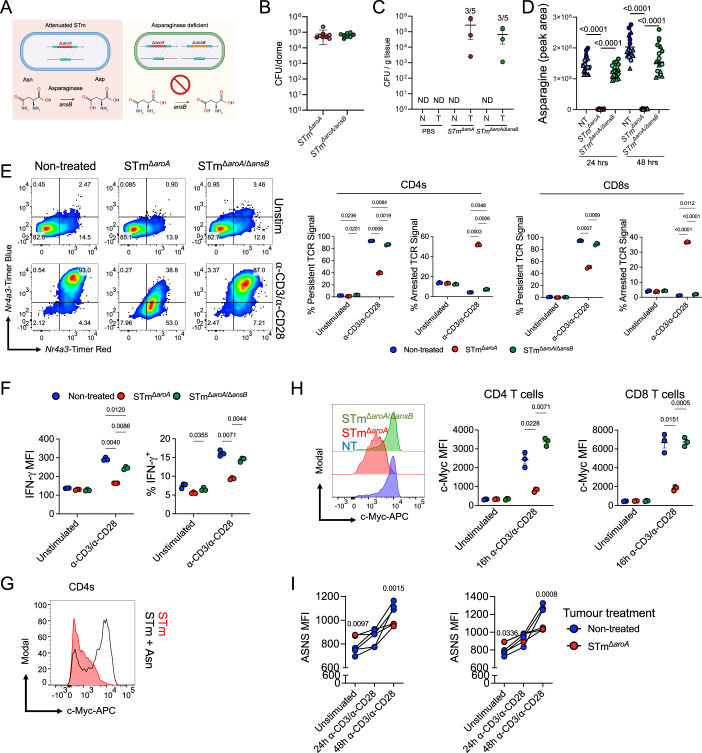
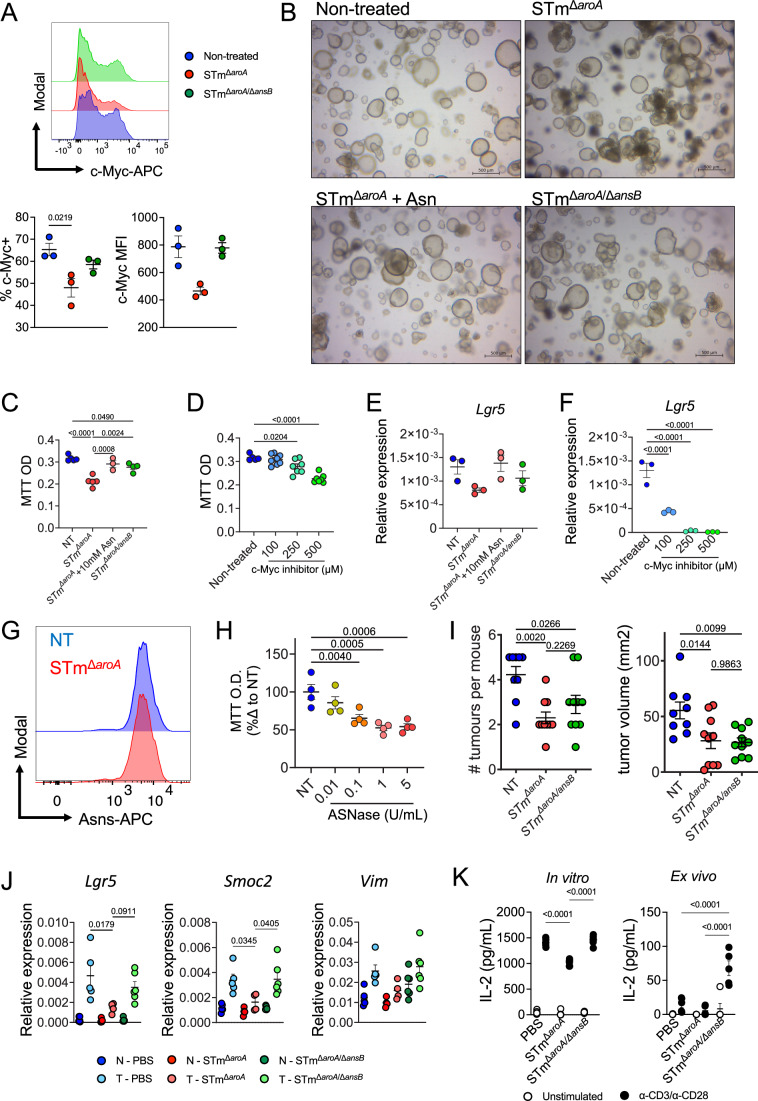
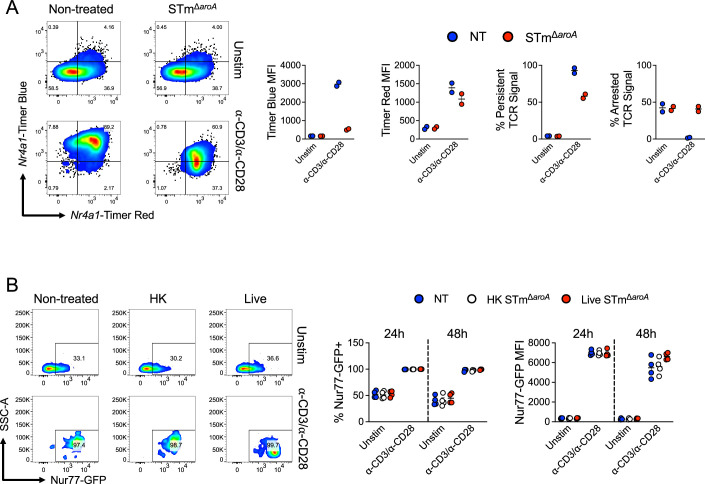
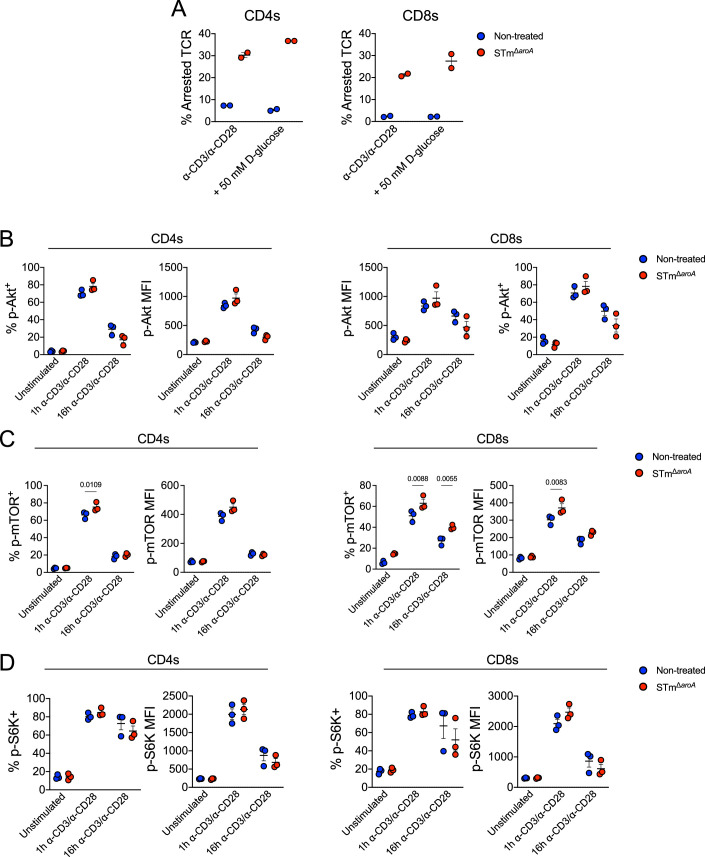
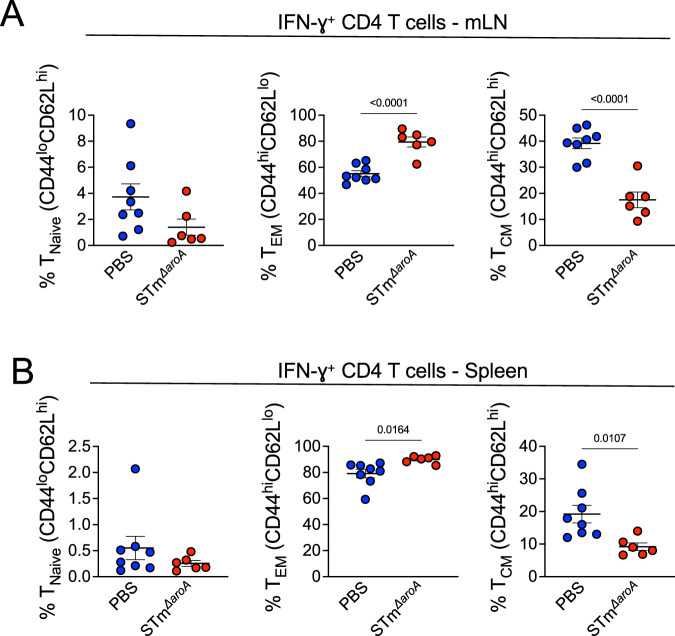
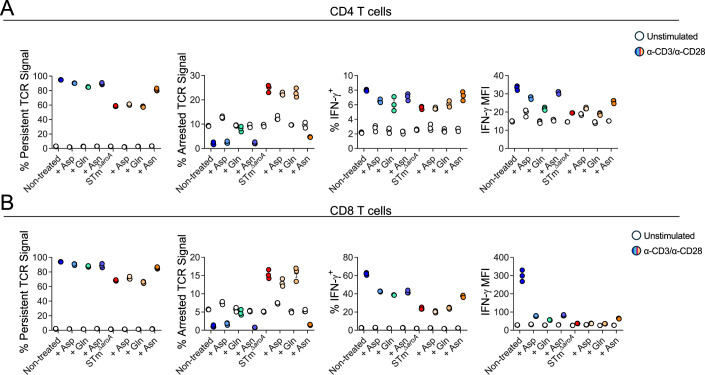
Bacterial cancer therapy (BCT) is a promising therapeutic for solid tumours. Salmonella enterica Typhimurium (STm) is well-studied amongst bacterial vectors due to advantages in genetic modification and metabolic adaptation. A longstanding paradox is the redundancy of T cells for treatment efficacy; instead, STm BCT depends on innate phagocytes for tumour control. Here, we used distal T cell receptor (TCR) and IFNγ reporter mice (Nr4a3-Tocky-Ifnγ-YFP) and a colorectal cancer (CRC) model to interrogate T cell activity during BCT with attenuated STm. We found that colonic tumour infiltrating lymphocytes (TILs) exhibited a variety of activation defects, including IFN-γ production decoupled from TCR signalling, decreased polyfunctionality and reduced central memory (TCM) formation. Modelling of T-cell-tumour interactions with a tumour organoid platform revealed an intact TCR signalosome, but paralysed metabolic reprogramming due to inhibition of the master metabolic controller, c-Myc. Restoration of c-Myc by deletion of the bacterial asparaginase ansB reinvigorated T cell activation, but at the cost of decreased metabolic control of the tumour by STm. This work shows for the first time that T cells are metabolically defective during BCT, but also that this same phenomenon is inexorably tied to intrinsic tumour suppression by the bacterial vector.

Keywords: Salmonella; Asparagine; Cancer Therapy; Immunometabolism; T Cells.


Conflict of interest statement

Disclosure and competing interests statement. The authors declare no competing interests.

Figures

Figure 1
Figure 1. Attenuated Salmonella cancer therapy induces aberrant T cell activation that decouples IFN-γ from TCR signalling.
(A) Schematic depicting the induction of colonic tumours in mice by the CAC model using azoxymethane (AOM) and dextran sodium sulfate (DSS) and treatment with attenuated Salmonella. (B) Flow cytometric analysis of IFN-γ-YFP in CD4 and CD8 T cells, across spleen, mLN and tumour. Percentage positive and median fluorescence intensity (MFI) of the positive fraction are depicted. (C) Left: representative flow cytometry plot showing gating on IFN-γ+ T cells and sub-analysis of Nr4a3-Timer expression (Blue or Red form). Right: analysis of the IFN-γ+ and Timerneg cells as a fraction of either CD4 or CD8 T cells. (D) Analysis of tumour IFN-γ+ T cells and a correlation between IFN-γ intensity (MFI) and frequency of TCR signalling (%Nr4a3-Timer+). The line depicts simple linear regression. (E) Flow cytometric analysis of PD-1 expression (percentage and MFI) within tumour IFN-γ+ T cells. Bars median average with interquartile range. Each point represents one mouse. (BD) Spleen: PBS n = 15, STM n = 15; mLN: PBS = 16, STm = 15; Tumour CD4s: PBS n = 16, STm n = 12; Tumour CD8s: PBS n = 14, STm n = 12. E PBS n = 8, STm n = 5. Significance was tested by unpaired Mann–Whitney (B, C, E) or by linear regression of the two curves (D). Data were pooled from two experiments (BD).
Figure 2
Figure 2. TILs from mice treated with Salmonella are functionally defective.
(A) Schematic depicting dissection of primary tumours in the CAC model, followed by culture in Matrigel for ex vivo synchronous activation. (B) Primary TILs were stimulated with α-CD3/α-CD28 antibodies (1 and 5 μg/mL, respectively) for 16 h, and then CD4 T cells were assessed for Nr4a3-Timer expression by flow cytometry, indicative of TCR-driven T cell activation. Left: Representative histograms showing T cell activation in PBS and STm-treated mice. Right: Quantified data from multiple mice showing % change in Nr4a3-Timer MFI upon activation. PBS n = 6, STm n = 6. (C) Tumour fragments were activated with α-CD3/α-CD28 antibodies in the presence of brefeldin A (10 μg/mL) for 6 h, and concurrent cytokine production was measured by intracellular cytokine staining (ICS; IL-2, IFNγ, TNFα). Displayed is the total cytokine production in CD4 T cells. PBS n = 5, STm n = 6. (D) Boolean analysis was performed on each possible cytokine combination in all four conditions. Shown are combined results from all mice depicting averages. Each point represents one mouse. Bars depict the median average with interquartile range. Significance was tested by two-way ANOVA with Sidak’s post-test (unstimulated vs stimulated) (B) or by multiple Mann–Whitney tests with Holm–Sidak correction for multiple tests (C). B, C are from independent experiments.
Figure 3
Figure 3. Salmonella-infected organoids recapitulate induction of T cell dysfunction and demonstrate arrested TCR activation.
(A) Left: Schematic depicting the co-culture model of tumour organoid culture with T cells/splenocytes. Cells (1–2 × 106 splenocytes) were either directly cultured with the tumour or with TCM. In direct cultures, T cells infiltrate the Matrigel. Right: Representative intra-tumoural STm CFU counts after 48 h culture, each dot represents one Matrigel dome in a 24-well plate, n = 4. (B) Schematic of flow cytometric analysis of Nr4a3-timer based on Bending et al, . (C) Splenocytes were cultured directly with uninfected, HK STm-treated or live STm-infected tumours for up to 48 h ± α-CD3/α-CD28 antibodies (1 and 5 μg/mL, respectively), and at each timepoint, cells were aspirated for analysis by flow cytometry at the indicated timepoints. Left: Representative plot depicting Nr4a3-Timer expression after stimulation in the three groups (Blue+Red- = New TCR Signal, Blue+Red+ = Persistent TCR Signal, Blue-Red+ = Arrested TCR Signal). Right: Summary data showing the locus of TCR reporter in CD4+ (top) or CD8+ (bottom) cells. (D) Summary analysis of Nr4a3-Timer Blue and Red MFI values. (E) Summary data for IFN-γ+ T cells at 24 or 48 h. (F) Splenocytes were stimulated for 24 h in TCM from NT or STm-infected tumours, and IL-2 was measured in supernatants by ELISA. (G) Splenocytes were stained with CellTrace Blue and stimulated for 3 days in TCM from NT or uninfected tumours as described above. Left: Flow cytometric measurement of cell size (FSC-A) after stimulation. Right: Analysis of proliferating cells by gating on the CellTraceBluelow fraction (as a percentage of CD8+ cells). Bars depict means ± SEM. Each point represents one mouse or organoid infection. Statistical significance was tested by two-way ANOVA comparing conditions unstimulated or stimulated groups with Tukey’s post-test (CG) or by two ANOVA with Sidak post-test comparing unstimulated to stimulated responses (F). Data were from n = 3 mice in three organoid infections and representative of more than five experiments (C–E, G), or n = 3 mice testing TCM from three independent experiments (F). Source data are available online for this figure.
Figure 4
Figure 4. Salmonella-infected tumours suppress key metabolic genes in T cells, accompanied by an innate-like transcriptional signature.
(A) Splenocytes (1 × 106 per condition) were cultured with TCM from non-treated or STm-infected tumours for 4 or 16 h, and then purified CD4 T cells were FACS sorted from these bulk splenocytes and Nr4a3-Timer expression was measured by flow cytometry. The data shown are a representative mouse. (B) 3’ mRNA libraries were generated from isolated CD4s, and transcription was quantified using QuantSeq. Shown is a principal component analysis (PCA) displaying variance in the dataset along PC1 and PC2. (C) DEGs were input into the KEGG database for pathway analysis for 4 h (left) and 16 h (right). (D) Heatmap of the DEGs involved in glycolysis (left) or oxidative phosphorylation (right) with Z-score key. Data were derived from n = 3 mice, representing one of two similar experiments. All DEGs were generated with a 1.5-fold change threshold. Source data are available online for this figure.
Figure 5
Figure 5. T cell metabolic paralysis is induced by Salmonella-infected tumours.
(A, B) Splenocytes (1 × 106/well) were cultured with TCM from non-treated or STm-infected tumours, alongside 10–20 mM 2-DG, or vehicle control (water) added at the beginning of the experiment. Indicated groups were then activated with α-CD3/α-CD28 antibodies (1 and 5 μg/mL, respectively) and assessed for Nr4a3-Timer loci (A) and IFN-γ expression (B) in CD4+ and CD8+ T cells. Blue+Red+ = Persistent TCR Signal, Blue-Red+ = Arrested TCR Signal. (C) Splenocytes were cultured and activated for 24 h in TCM from NT or STm-treated tumours. Supernatants were then tested (left) for glucose concentration (Sinocare), and percent utilisation was calculated (right). (D) Splenocytes were cultured and activated for 24 h in TCM from NT or STm-treated tumours. After 24 h, cells were fixed and permeabilised. Cells were stained with either rabbit anti-Glut1 or anti-Glut3, followed by anti-rabbit-APC to reveal total Glut1/3 levels. Left: Representative histogram showing flow cytometric levels of Glut1 and Glut3 gated on CD4 T cells. Right: Compiled results from n = 3 mice. (E, F) Splenocytes were cultured in TCM from NT or STm-treated tumours for 48 h and then analysed on Agilent Seahorse XF analyser for ECAR (E) and OCR (F). Data were representative of two (A, B) or one (C) independent experiments testing n = 3 mice splenocytes on TCM from two infections, or one experiment testing TCM from two independent infections on n = 3 mice (DF). Statistical significance was tested by two-way ANOVA comparing all groups with Sidak’s post-test, displaying the stimulated in-group comparisons (A, B), or one-way ANOVA with Tukey’s post-test (C), two-way ANOVA with Sidak’s post-test between unstim vs stim (D) and one-way ANOVA with Tukey’s post-test, displaying the stimulated group only (E, F). Source data are available online for this figure.
Figure 6
Figure 6. c-Myc is selectively inhibited by STm-treated tumours, but the TCR signaolsome remains intact.
(A) Splenocytes were cultured directly with non-treated, HK STm-treated or live STm-infected tumours for 24 h. Cells were then stimulated for 15 min with α-CD3/α-CD28 antibodies (1 and 5 μg/mL, respectively) and then stained, fixed and permeabilised according to the PhosFlow protocol (see Methods). Cells were stained for Lck phosphorylation (Y394) and analysed by flow cytometry. Data shown are gated on CD4+ T cells. n = 3 all groups. (B) Splenocytes were cultured directly with NT, HK STm-treated or live STm-infected tumours for 24 h. Cells were then stained with lineage markers and Fluo-4/Fura-Red (calcium dyes), and run on a flow cytometer to measure baseline calcium. Ionomycin (1 μg/mL) was added after ~25 s, and calcium flux was measured by a ratio of Fluo-4:Fura-red and calculating the area under curve (AUC) before and after treatment. Left: Representative plots showing calcium flux for each group, gated on CD4 T cells. Right: Pooled data from n = 3 (CD4) or n = 2 (CD8) mice. (C) Splenocytes were activated in TCM for 1 or 16 h with α-CD3/α-CD28. Cells were stained according to the PhosFlow protocol, and p-Erk (T202/Y204) was measured. Left: representative histogram showing induction in both activated groups. Right: Pooled data from n = 3 mice, all groups. (D) Purified bulk T cells (>98% purity) were cultured in NT or STm TCM for 24 h. One hour before the end of the culture, a-CD3/a-CD28 was added to the indicated groups to measure nuclear translocation. Nuclei were then separated and analysed by flow cytometry for NFAT1 and NF-kB. Left: Representative histograms showing NFAT1 and NF-kB translocation after activation. Right: Pooled data from three experiments, n = 6 mice, all groups. (E) Representative flow cytometry histograms of p-Akt (S473), p-mTOR (S2448) and p-p70-S6K (T421/S424). Cells were stimulated in NT and STm TCM for 1 h and processed as previously described. Data representative of n = 3 mice. Quantification shown in EV Fig. 2B–D. (F) Splenocytes were cultured in TCM for 1 or 16 h with a-CD3/a-CD28. Cells were stained, fixed, permeabilised and stained with rabbit anti-c-Myc, followed by anti-rabbit APC. Left: Representative histogram after 1 h stimulation. Right: Data pooled from two experiments, n = 6 mice, all groups. (G) Splenocytes were activated in TCM from non-treated or STm-infected tumours with α-CD3/α-CD28 for up to 12 h, and global protein translation was measured by intracellular puromycin staining, alongside a separate c-Myc stain. Differences in %ΔMFI for puromycin (protein translation) or c-Myc in the STm group vs the non-treated control at each timepoint are shown. n = 3 all groups (but n = 2 10 h c-Myc). Data shown are pooled from two (B, F), three (D, G) or one (E) independent experiments, or representative of two/three independent experiments (A, C, respectively). Bars depict means ± SEM. Statistical significance was tested by two-way ANOVA with Sidak post-test between treatments (B, D), timepoints (NT vs STm) (C, F) and mixed-effects model with Dunnett’s post-test (G).
Figure 7
Figure 7. Deletion of bacterial asparaginase ansB restores T cell function.
(A) Schematic depicting the asparaginase-deficient attenuated STm mutant and the impaired catalytic reaction. (B) CFU analysis of organoids NT or infected with STm∆aroA or STm∆aroA/∆ansB for 24 h. Each dot represents an individual Matrigel dome, representative of >3 repeats in two independent organoid lines. The pale colour represents small-intestinal-derived tumour and darker shade represents colonic-derived tumour organoids, both from Apcmin/+. n = 4 per group. (C) CFU analysis of normal (N) or tumour (T) tissue from AOM/DSS induced mice, given two oral doses of indicated STm, once per week, and culled on 3rd week. Representative of two experiments. n = 5 per group. (D) In vitro measurement (LC-MS) of asparagine in culture supernatant after 24 or 48 h infection with STm∆aroA or STm∆aroA/∆ansB, or non-treated (NT). Circles indicate colon tumour organoid, triangles small intestine; dark and light tones indicate independent experiments. One-way ANOVA with Turkey’s multiple comparisons test was performed on the means (black circles/triangles) of each experiment. n = 8 per group. (E) Splenocytes were cultured with TCM from tumours infected with STm∆aroA or STm∆aroA/∆ansB and activated with α-CD3/α-CD28 for 24 h. Left: representative flow cytometric plot showing Nr4a3-Timer, gated on CD4 T cells. Right: pooled data from multiple mice, showing the Timer loci in relation to TCR signalling in CD4 and CD8 T cells. TCM pooled from two independent infections, n = 3 mice. (F) IFN-γ expression in the same experiment (E), showing pooled responses gated on CD4 T cells. (G) c-Myc levels in CD4 T cells after supplementation with 0.5 mM asparagine, as measured by intracellular flow cytometry. Representative of one of n = 2 mice. (H) Splenocytes were cultured with TCM from tumours infected with STmΔaroA or STmΔaroA/ansB and activated with α-CD3/α-CD28 for 16 h. c-Myc expression in CD4 and CD8 T cells, representative flow cytometric plot from CD4 T cells. n = 3 mice. (I) Splenocytes were cultured in TCM from NT or STm-infected tumours and intracellular asparagine synthetase (ASNS) expression was analysed in CD4+ and CD8 + T cells 24–48 h after stimulation with a-CD3/a-CD28 antibodies (1 and 5 mg/mL, respectively). Each point represents an independent spleen donor, n = 3. Bars depict means ± SEM or median with interquartile range. Statistical significance was tested by two-way ANOVA with Sidak’s post-test (E, F, I) or two-way ANOVA with Tukey’s post-test (H). Source data are available online for this figure.
Figure 8
Figure 8. Deletion of bacterial asparaginase ansB result in loss of tumour c-Myc control but retains in vivo tumour suppression.
(A) Tumour organoids were infected with STmΔaroA or STmΔaroAansB for 24–48 h and then stained for intracellular c-Myc. Data pooled from two independent experiments (N = 2 and N = 1, technical replicates). Each dot represents an individual well of tumour organoids. (B,C) Tumour organoids were infected with the indicated STm mutant with or without asparagine supplementation for 24 h. Organoid viability/metabolic capacity was assessed by MTT assay (C). (B) Representative images of organoids after 24 h treatment. Dark blebbing organoids are dying. Each dot represents an individual well (technical replicate), n = 5 NT& STmΔaroA, n = 4 STmΔaroAansB, n = 3 STmΔaroA + 10 mM Asn. Representative of two independent experiments using two different Apcmin/+-derived tumour organoid lines. (D) Tumour organoids were treated with a c-Myc inhibitor for 24 h. Organoid viability/metabolic capacity was assessed by MTT assay. Each dot represents an individual well (technical replicate). n = 5 (NT), 8 (100 µM), 7 (250 & 500 µM). Representative of two independent experiments using two different Apcmin/+-derived tumour organoid lines. (E, F) RNA was isolated from organoids in (C, D) and qPCR for Lgr5 performed. n = 3, all groups. Each dot represents an individual well of tumour organoids (technical replicates). (G) NT or STm-infected tumour organoids (24 h) were stained for asparagine synthetase and analysed by flow cytometry. Representative plot of N = 2. (H) Tumour organoids were cultured with the indicated concentrations of E.coli-derived asparaginase for 24 h and growth was assessed by MTT assay. n = 4, each group. Representative of two independent experiments, each conducted on two independent Apcmin/+-derived tumour organoid lines. Each dot represents an individual well of tumour organoids (technical replicates). (I) CAC was induced in C57BL/6 mice using AOM/DSS followed by weekly oral gavage with 5 × 109 CFU of STmΔaroA, STmΔaroAansB or PBS control for 6 weeks, and tumour volume were assessed. Each dot represents one mouse (n = 10 per STm group, 9 PBS group). (Data of NT v’s STmΔaroA taken from Mackie et al, , rep of .five experiments), ansB treatment group representative of two experiments. (J) RNA was isolated from the normal colon (N) or tumour (T) from experiment in (I) and qPCR analysis of indicated stem/mesenchymal transcripts performed. Each dot represents tumour from one mouse, data representative of >3 experiments for the PBS and STmΔaroA groups and 1 experiment for the STmΔaroAansB group. (Data of NT v’s STmΔaroA taken from Mackie et al, 2021). n = 5 NT, n = 4 STmΔaroA, n-6 STmΔaro/ ΔansB. (K) IL-2 measured by ELISA from in vitro co-cultured splenocytes activated by a-CD3/28 in the presence of TCM from indicated STm strains (n = 6; pooled TCM tested on six independent spleen donors), or ex vivo re-stimulated TILs (n = 5; each dot representing TILs isolated from independent mice). Bars depict means ± SEM or median with interquartile range. Statistical significance was tested by one-way ANOVA with Tukey’s or Dunnett’s post-test (CF, H, I, K), or Kruskal–Wallis with Dunn’s post-test (A, J). Source data are available online for this figure.
Figure EV1
Figure EV1. Differential sensitivity of Timer and GFP-based TCR reporters in detecting arrested T cell activation.
TCM from NT or STm-infected tumour organoids was used to culture splenocytes from Nr4a1-Tempo (A) or Nur77-GFP (B) T cell reporter mice for 24 h (Tempo mice) or up to 48 h (Nur77 mice) after stimulation with α-CD3/α-CD28 (1 and 5 mg/mL, respectively). Data depict n = 2 (A) or n = 3 (B) mice.
Figure EV2
Figure EV2. T cells activated in the presence of STm-infected tumours are unable to increase glucose uptake and show normal TCR signalling cascades.
(A) Splenocytes were co-cultured with infected or non-treated tumours for 24 h in the presence of α-CD3/α-CD28 antibodies (1 and 5 μg/mL, respectively). During the final 6 h, a high dose of glucose (50 mM) was spiked into the culture in an attempt to reduce arrested TCR activation, as measured by Nr4a3-Timer Arrested TCR signal, i.e. Nr4a3-Timer BluenegTimer Redpos. Cells were then tested for activation by flow cytometry. Data show two independent infections; each data point represents splenocytes tested with an independent tumour infection. (BD) Quantification of PhosFlow signalling pathways as shown by representative plots in Fig. 6E. Cells were stimulated in NT and STm TCM for 1 or 16 h and processed for PhosFlow as previously described, showing p-Akt-S473 (B), p-mTOR-S2448 (C) and p70-S6K-T421/S424 (D). Bars depict means ± SEM. Statistical significance was tested by two-way ANOVA with Sidak’s post-test (non-treated vs STm). Data were derived from n = 3 mice testing pooled TCM from two tumour infections.
Figure EV3
Figure EV3. Activated lymphatic T cells from mice infected with STm show a TEM-bias.
Tumours were induced in mice using the CAC model, followed by two rounds of oral STm treatment as previously outlined for immunogenicity experiments. One week after the final dose, mice were culled and mLN and spleens were extracted, followed by preparation of single-cell suspensions and flow cytometry staining for T cell memory subsets within the IFN-γ+ CD4 (A) and CD8 T cell (B) populations. Cells were phenotyped based on the expression of CD44 and CD62L. Bars depict means ± SEM. Each data point represents one mouse, n = 8 NT, n = 6 STm∆aroA. Statistical significance was tested by unpaired two-tail t-test.
Figure EV4
Figure EV4. Asparagine supplementation is able to restore T cell activation when cultured with TCM from infected tumours.
Splenocytes were cultured in TCM from either non-infected or infected-tumour organoids and activated for 24 h with α-CD3/α-CD28 antibodies (1 and 5 μg/mL, respectively). To some cultures, Asp/Gln/Asn were added (10 mM) at the beginning of the culture, or else a vehicle control (H20) was used. Various metrics of either Nr4a3-Timer, indicative of TCR signalling, or IFN-g expression were quantified by flow cytometry for CD4 (A) and CD8 (B) T cells. Data are from n = 3 mice, using pooled TCM from two tumour infections. Bars depict means ± SEM.
Figure EV5
Figure EV5. Oncolytic bacteria possessing the high activity ASNase gene also suppress T cell Activation.
Tumour organoids were infected with either L. monocytogenes (Lm) or E. coli Nissle (EcN) and the TCM was used to stimulate splenocytes. (A) CFU assessment of Lm 24 hr after infection. Each dot represents an individual well of organoids, n = 3. (B) Nr4a3-Timer and IFN-γ expression of unstimulated or a-CD3/a-CD28 stimulated (1 and 5 mg/mL, respectively) CD8 + T cells from activated splenocytes cultured in Lm TCM. Data representative flow plots of n = 3 independent spleen donors. (C) CFU assessment of E.coli Nissle after 24 h infection. Each dot represents an individual well of organoids, n = 3. (D) Nr4a3-Timer and IFN-γ expression of unstimulated or a-CD3/a-CD28 stimulated (1 and 5 mg/mL, respectively) CD8 + T cells from activated splenocytes cultured in EcN TCM. Data representative flow plots of n = 3 independent spleen donors. Error bars depict SEM.

Similar articles

Cited by

References

    1. André T, Shiu K-K, Kim TW, Jensen BV, Jensen LH, Punt C, Smith D, Garcia-Carbonero R, Benavides M, Gibbs P et al (2020) Pembrolizumab in microsatellite-instability–high advanced colorectal cancer. N. Engl J Med 383:2207–2218 - PubMed
    1. Aulicino A, Rue-Albrecht KC, Preciado-Llanes L, Napolitani G, Ashley N, Cribbs A, Koth J, Lagerholm BC, Ambrose T, Gordon MA et al (2018) Invasive Salmonella exploits divergent immune evasion strategies in infected and bystander dendritic cell subsets. Nat Commun 9:4883 - PMC - PubMed
    1. Bending D, Martín PP, Paduraru A, Ducker C, Marzaganov E, Laviron M, Kitano S, Miyachi H, Crompton T, Ono M (2018a) A timer for analyzing temporally dynamic changes in transcription during differentiation in vivo. J Cell Biol 217:2931–2950 - PMC - PubMed
    1. Bending D, Paduraru A, Ducker CB, Prieto Martín P, Crompton T, Ono M (2018b) A temporally dynamic Foxp3 autoregulatory transcriptional circuit controls the effector Treg programme. EMBO J 37:e99013 - PMC - PubMed
    1. Bernal-Bayard J, Ramos-Morales F (2018) Molecular mechanisms used by Salmonella to evade the immune system. Curr Issues Mol Biol 25:133–168 - PubMed

MeSH terms

Substances

LinkOut - more resources