. 2024 Dec;9(12):3120-3134.
doi: 10.1038/s41564-024-01858-9. Epub 2024 Nov 18.

Coffee consumption is associated with intestinal Lawsonibacter asaccharolyticus abundance and prevalence across multiple cohorts

Affiliations

Coffee consumption is associated with intestinal Lawsonibacter asaccharolyticus abundance and prevalence across multiple cohorts

Paolo Manghi et al. Nat Microbiol. 2024 Dec.

Abstract

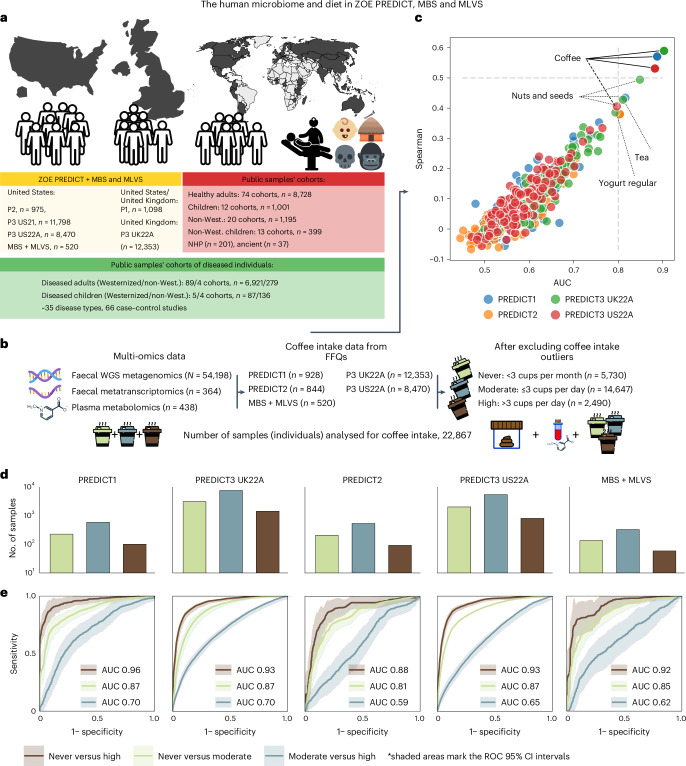
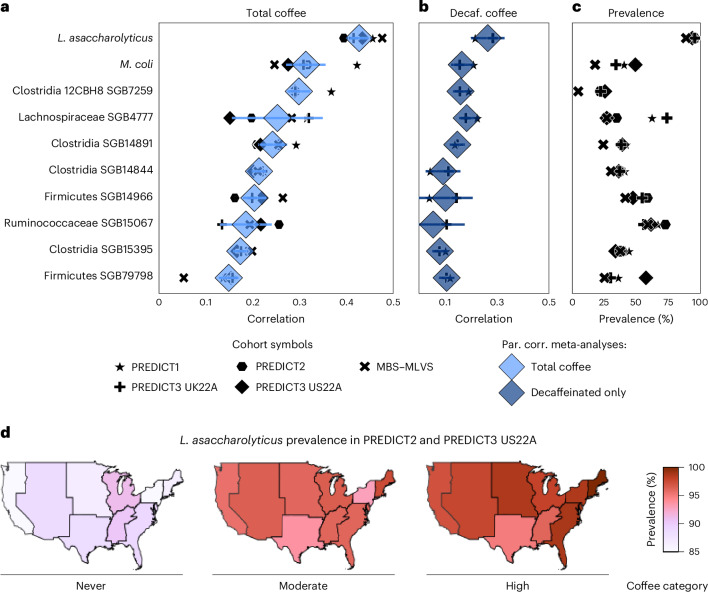
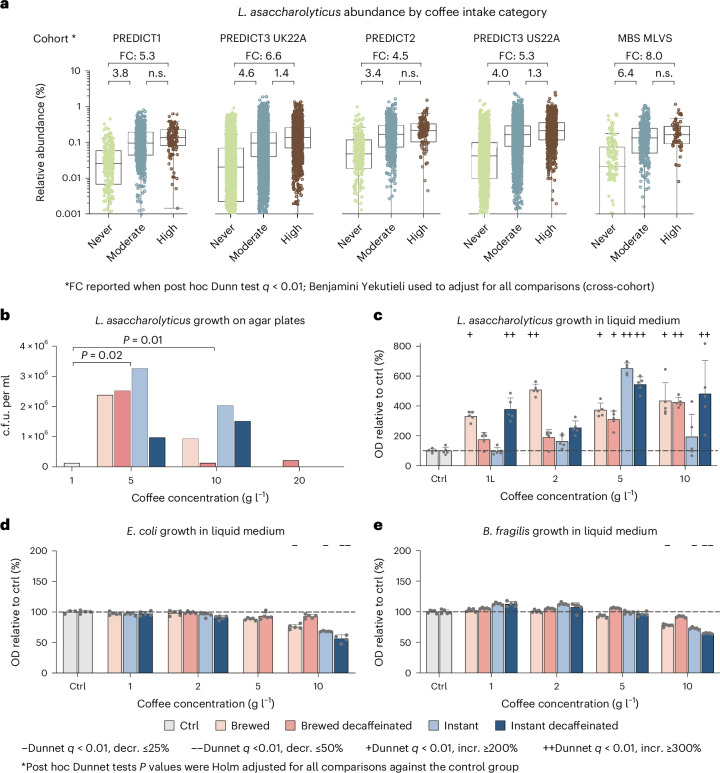
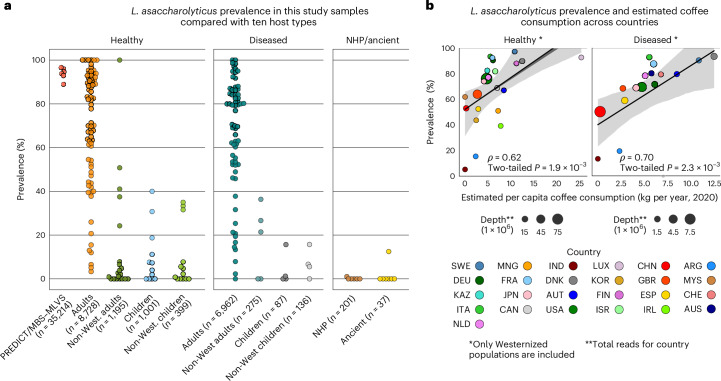
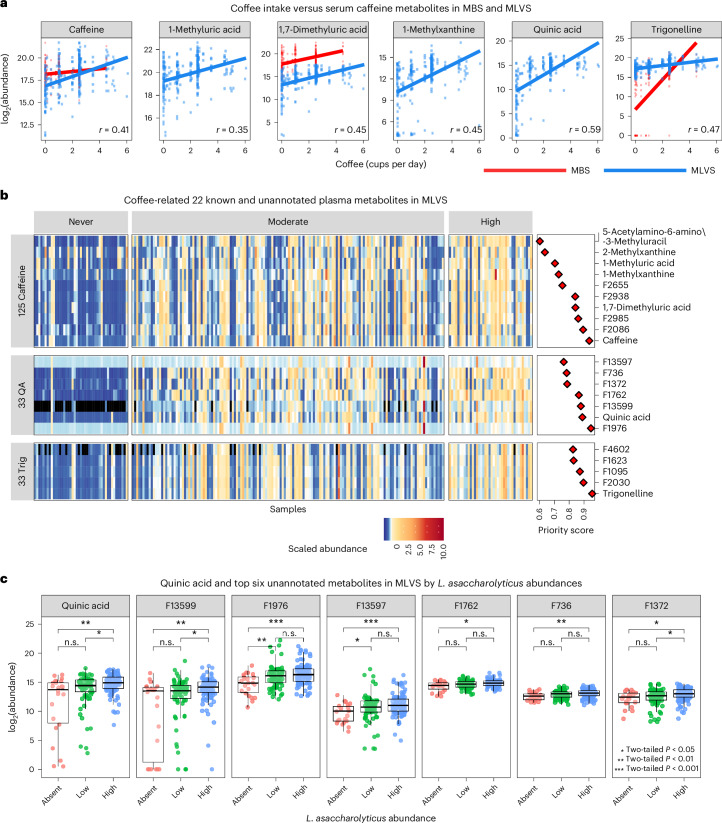
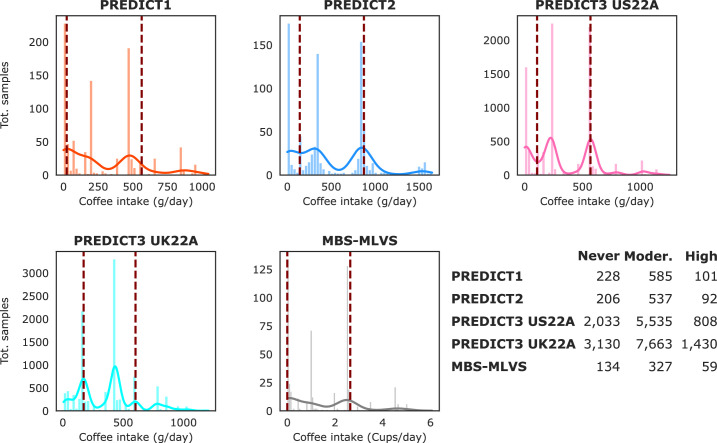
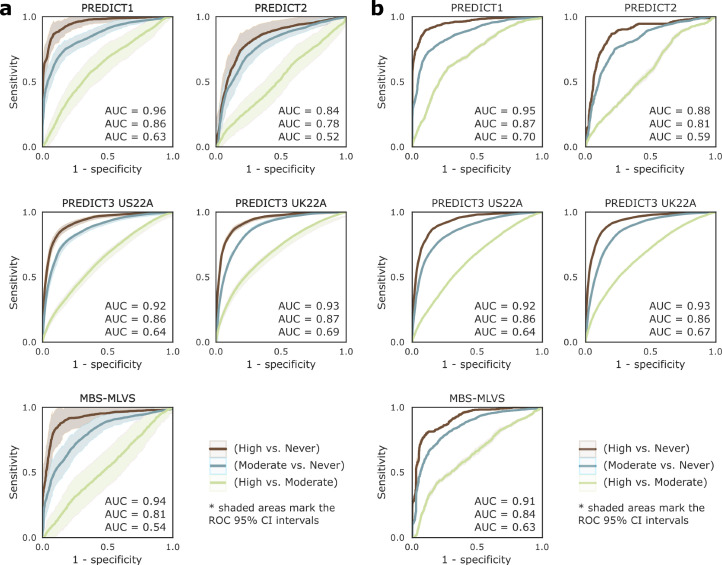
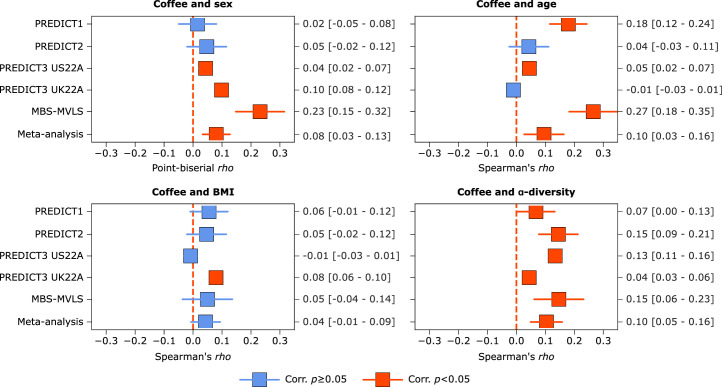
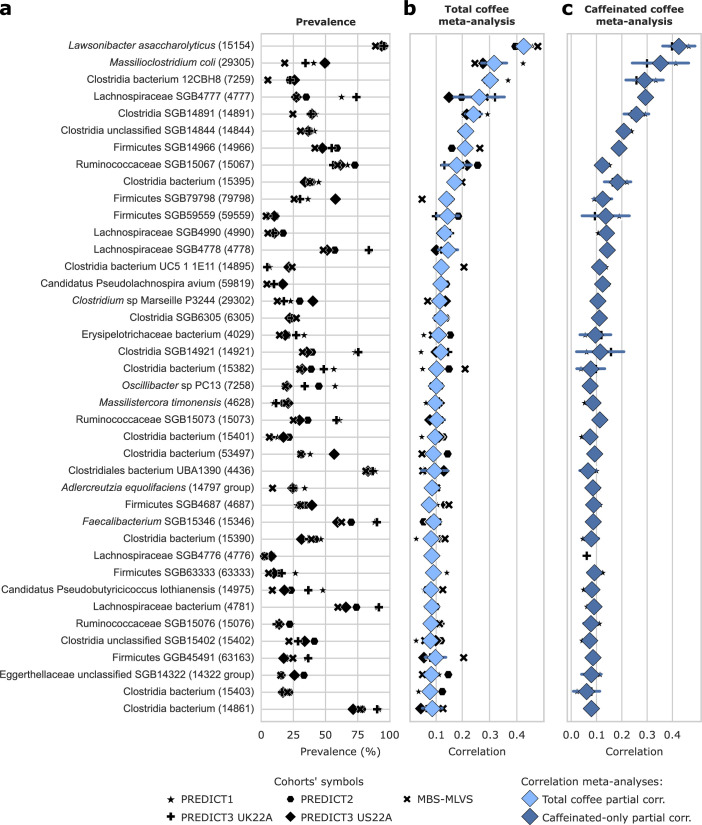
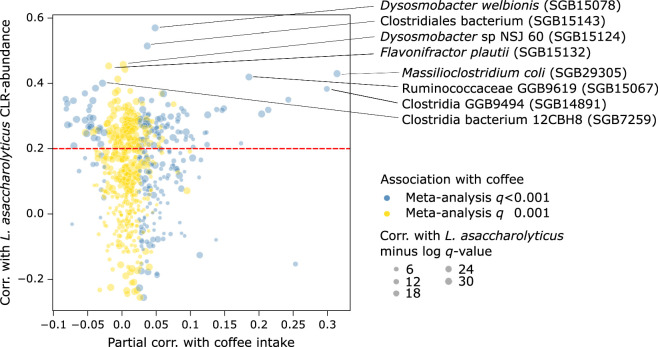
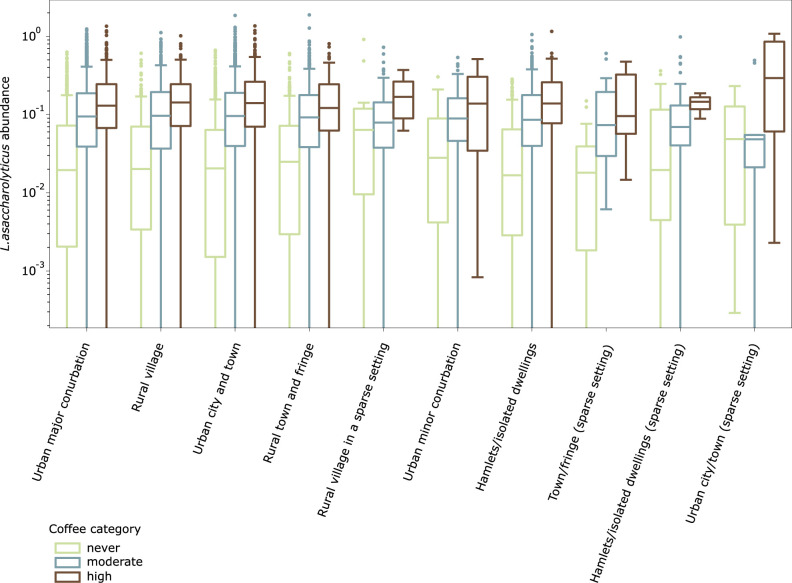
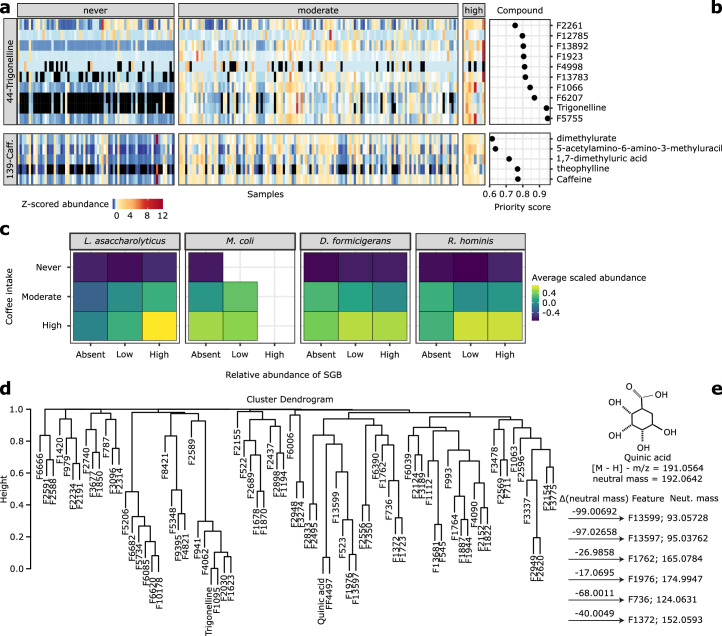
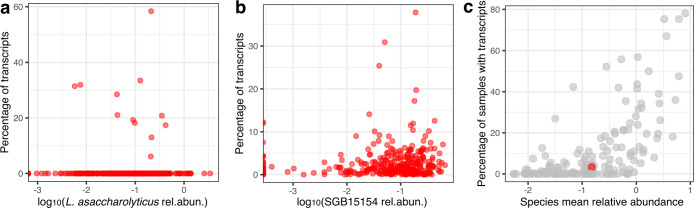
Although diet is a substantial determinant of the human gut microbiome, the interplay between specific foods and microbial community structure remains poorly understood. Coffee is a habitually consumed beverage with established metabolic and health benefits. We previously found that coffee is, among >150 items, the food showing the highest correlation with microbiome components. Here we conducted a multi-cohort, multi-omic analysis of US and UK populations with detailed dietary information from a total of 22,867 participants, which we then integrated with public data from 211 cohorts (N = 54,198). The link between coffee consumption and microbiome was highly reproducible across different populations (area under the curve of 0.89), largely driven by the presence and abundance of the species Lawsonibacter asaccharolyticus. Using in vitro experiments, we show that coffee can stimulate growth of L. asaccharolyticus. Plasma metabolomics on 438 samples identified several metabolites enriched among coffee consumers, with quinic acid and its potential derivatives associated with coffee and L. asaccharolyticus. This study reveals a metabolic link between a specific gut microorganism and a specific food item, providing a framework for the understanding of microbial dietary responses at the biochemical level.


Conflict of interest statement

Competing interests: G.H., J.W. and T.D.S. are co-founders of ZOE. G.H., J.W., R.D., F.G. and K.M.B. are or have been employees of ZOE. N.S., F.A., S.E.B., C.H. and T.D.S. are consultants to ZOE. T.D.S., R.D., J.W., G.H., F.A., N.S. and S.E.B. receive options with ZOE. All other authors declare no competing interests.

Figures

Fig. 1
Fig. 1. Consistent global links between coffee consumption and the human gut microbiome.
a, Five UK and/or US PREDICT cohorts (n = 975, 11,798, 8,470, 1,098 and 12,353), the MBS and the MLVS (n = 213 and n = 307, respectively) were used to assess diet–microbiome relationships (total n = 35,214). For later comparisons of microbiome distributions across different populations, we retrieved n = 18,984 metagenomic samples from public sources, including healthy adult individuals, newborns, non-Westernized (non-West.) individuals, ancient samples and non-human primates (NHP). P1, PREDICT1; P2, PREDICT2; P3, PREDICT3. b, We combined faecal metagenomics (n = 54,198), faecal metatranscriptomics (n = 364) and plasma metabolomics (n = 438), with the latter two from the MBS and MLVS cohorts. FFQs surveyed nutritional habits of the participants from four PREDICT cohorts, MBS and MLVS (n = 22,867 after removing individuals above the 99th percentile of coffee intake in the PREDICT cohorts as outliers). Participants were categorized as ‘high’, ‘moderate’ and ‘never’ coffee drinkers as previously established. c, Median Spearman’s correlation and median AUCs from a random forest regressor and a random forest classifier trained on the microbiome composition estimated by MetaPhlAn 4 (ref. ). d, The number of never (light green), moderate (dark cyan) and high-coffee drinkers (brown). e, ROC and AUC of random forest classifiers discriminating participants between pairs of the three coffee drinker classes, assessed in a tenfold, ten times repeated cross-validations (CV) that benefited from the other cohorts during the training phase as in the leave-one-dataset-out approach (LODO; Methods). The shaded areas represent the 95% confidence intervals (CIs) of a linear interpolation over all the folds of the test. Machine learning results using either only a CV or a LODO approach are reported in Extended Data Fig. 2a,b.
Fig. 2
Fig. 2. L.asaccharolyticus drives the association between the gut microbiome and coffee intake.
a, The top ten SGBs from a meta-analysis of partial correlations between SGB-ranked abundances and total per-individual coffee intake considering the five cohorts analysed in this study (q < 0.001). The black markers show the per-cohort partial correlations and the light blue markers indicate the average Spearman’s correlations adjusted by sex, age and BMI. b, The same SGBs are meta-analysed with Spearman’s partial correlations (par. corr.) between SGB abundances and decaffeinated (decaf.) coffee intake in the PREDICT1 and PREDICT3 UK22A cohorts, excluding individuals who consumed caffeinated coffee only (n = 262 and 4,055). The black markers show the per-cohort correlations and dark blue symbols refer to average correlations adjusted by sex, age, BMI and caffeinated coffee. c, The prevalence of the ten SGBs in the five cohorts analysed. d, The prevalence of L.asaccharolyticus across never, moderate and high coffee drinkers and nine US regions in the PREDICT2 and PREDICT3 US22A cohorts (n = 9,210).
Fig. 3
Fig. 3. L.asaccharolyticus is highly prevalent with about fourfold higher average abundance in coffee drinkers, and its growth is stimulated by coffee supplementation in vitro.
a, The relative abundance of L.asaccharolyticus in each cohort by coffee consumption category (never, moderate or high). The boxes represent the median and interquartile range (IQR) of the distributions, and top and bottom whiskers mark the point at 1.5 IQR. The median fold change of the high versus never comparison is reported on top if post hoc Dunn q < 0.01, and median fold change (FC) of the other two comparisons are reported on the top of each combination. n.s. (not significant) refers to post hoc Dunn q > 0.01. Total sample sizes are presented in Extended Data Fig. 1. b, L.asaccharolyticus growth on agar plates supplemented with increasing concentrations of coffee and measured by plate count (c.f.u. per ml). P values refer to one-sample t-tests compared with the control (ctrl) experiment value. ce, Bacterial growth of L.asaccharolyiticus (c), E.coli (d) and B.fragilis (e) in liquid medium supplemented with increasing coffee concentrations and measured by changes in optical density (OD650). Percentage growth is relative to the culture medium control not supplemented with coffee (100%). Absolute OD650 values are reported in Supplementary Tables 15 and 16. The bars and error lines indicate the mean ± s.d. of five technical replicates, except for E.coli control (n = 3 and n = 4) and B.fragilis instant 5 g l−1 (n = 4). The minus and plus signs refer to significant tests (Dunnett q < 0.01) that overcome specific thresholds of fold increase (incr.) or decrease (decr.).
Fig. 4
Fig. 4. L.asaccharolyticus is ubiquitous in modern, Westernized, adult populations and almost absent elsewhere.
a, The prevalence of L.asaccharolyticus in 11 different types of host (219 subpopulations, N = 54,198) including children and adults; healthy and diseased participants; from Westernized and non-Westernized communities; non-human primates and ancient samples, compared with the ZOE PREDICT and MBS–MLVS cohorts. Human, modern samples and participant records were obtained from a development version of curatedMetagenomicData (Supplementary Table 17). b, The per capita coffee consumption (kg per year, estimated by https://worldpopulationreview.com) for 25 countries (AUT, Austria; CHE, Switzerland; DEU, Germany; DNK, Denmark; ESP, Spain; FIN, Finland; FRA, France, GBR, UK; IRL, Ireland; ITA, Italy; LUX, Luxembourg; NLD, Netherlands; SWE, Sweden; CHN, China; IND, India; ISR, Israel; JPN, Japan; KAZ, Kazakhstan; KOR, Korea; MNG, Mongolia; MYS, Malaysia; ARG, Argentina; CAN, Canada; AUS, Australia) correlates with the prevalence of L.asaccharolyticus in healthy and diseased populations. The shaded areas around the regression line represent the 95% confidence interval estimated by bootstrapping.
Fig. 5
Fig. 5. Unannotated metabolites covarying with quinic acid are associated with L.asaccharolyticus.
a, The correlation of coffee intake versus abundances of six known coffee metabolites in plasma metabolomics samples from the MLVS (blue) and MBS (red). The highest rank correlation is reported in each plot. Three metabolites were not measured in MBS. b, Left, a heat map showing standardized abundances of the 14 unannotated and 8 previously annotated metabolites in the MLVS cohort (n = 307) with the highest MACARRoN priority score with respect to the presence of L.asaccharolyticus. QA, quinic acid; Trig, trigonelline. Right, MACARRoN priority scores. Samples are reported by coffee intake category. c, The log2-transformed abundances of quinic acid and the top six quinic acid-correlated unannotated metabolites according to L.asaccharolyticus relative abundance (RA) categories (absent, RA <0.01%; low, 0.1%> RA ≥0.01%; high, RA >0.1%) in 190 coffee drinkers. The boxes represent the median and IQR of the distributions, and top and bottom whiskers mark the point at 1.5 IQR.
Extended Data Fig. 1
Extended Data Fig. 1. Coffee intake estimated via FFQ in four ZOE PREDICT and the MBS-MLVS cohorts.
X-axis shows the estimated grams per day (ZOE PREDICT) and cups per day (MBS-MLVS), Y-axis shows the number of samples. Brown dashed lines indicate the 24.94th and 88.95th percentiles that correspond to the thresholds of 20 and 600 grams per day in the PREDICT1 cohort and have been used to determine the three categories never, moderate, and high coffee drinkers in the five cohorts. Continuous darker line marks the Gaussian kernel density estimation. Number of microbiome samples per cohort per category are also reported.
Extended Data Fig. 2
Extended Data Fig. 2. Cross validation and Leave-one-dataset-out validation.
a) receiver operating characteristic (ROC) curves and areas under the curve (AUCs) of random forest algorithms discriminating participants of the three combinations: never vs. moderate (light green), moderate vs. high (dark cyan), and high vs. never (brown), using the microbiome composition estimated by MetaPhlAn 4, assessed in a ten-fold, ten-times repeated cross-validations. b) ROC curve and AUCs of the same algorithm and experiment, using a leave-one-dataset-set-out (LODO) approach. Shaded areas represent the 95% confidence intervals of a linear interpolation over all the folds of the test.
Extended Data Fig. 3
Extended Data Fig. 3. Microbiome-correlated variables, sex, age, BMI, and ɑ-diversity are correlated with coffee intake.
Point-biserial correlation between sex and coffee, and Spearman’s correlation between age, BMI, ɑ-diversity and coffee consumption. Correlations coefficients are then pooled in a random-effects meta-analysis. Blue marks single study or pooled correlation which p ≥ 0.05, red marks single/pooled correlations which p < 0.05.
Extended Data Fig. 4
Extended Data Fig. 4. Meta-analysis of rank correlation between SGBs and coffee intake.
a) Prevalences in the five cohorts considered in this study of the 40 strongest SGB-abundance and coffee-intake pooled partial Spearman’s correlations found at q < 0.001. b) Single-study partial Spearman’s correlation between SGB relative abundance and per-individuals total coffee intake, adjusting by age, sex, and BMI (black symbols) and pooled partial correlation (light blue markers). c) Single-study partial Spearman’s correlation between SGB relative abundance and per-individuals caffeinated coffee intake only (black symbols), adjusting by age, sex, BMI, and decaffeinated coffee intake and pooled partial correlation (dark blue markers). Only the PREDICT1 and PREDICT3 22UKA cohorts were used in this analysis.
Extended Data Fig. 5
Extended Data Fig. 5. Coffee-associated SGBs tend to be correlated in abundance with L. asaccharolyticus.
(X-axis) correlation coefficients from the partial correlation meta-analysis with coffee consumption (Supplementary Table 7) vs correlation coefficients from a correlation meta-analysis with L. asaccharolyticus abundance (Y-axis, Supplementary Table 10). Correlations between L. asaccharolyticus and the other SGBs (Spearman’s) were computed after centred log-ratio transformation (CLR) following zero imputation with a multiplicative replacement method to control for the problem of relative abundances’ correlated structure. SGBs below 10% prevalence and not present in at least two cohorts were excluded (in total 707 SGBs were evaluated).
Extended Data Fig. 6
Extended Data Fig. 6. Different styles of urban and rural surroundings do not impact L. asaccharolyticus-coffee association.
L. asaccharolyticus relative abundance in never, moderate, and high coffee-drinkers and ten different rural/urban contexts that were available in the PREDICT3 UK22A cohort (n = 11,547). Boxes represent the median and interquartile range (IQR) of the distributions; top and bottom whiskers mark the point at 1.5 IQR.
Extended Data Fig. 7
Extended Data Fig. 7. L. asaccharolyticus in relation with sequencing depth and in 35 disease types.
a) L. asaccharolyticus is highly prevalent in patients from 35 diseases from 89 combinations of study + country + disease, when prevalence across same-disease datasets was computed via random-effect meta-analysis. b) Standardized mean difference of arcsin-square rooted abundances of L. asaccharolyticus in public case-control settings from 25 disease-types shows no strong association between L. asaccharolyticus and diseases. Effect-sizes of the same-disease datasets were computed via random effect meta-analysis. Total sample sizes are available in Supplementary Table 18,19.
Extended Data Fig. 8
Extended Data Fig. 8. Unannotated metabolites covarying with trigonelline and caffeine in a L. asaccharolyticus-dependent manner.
a) Heatmap showing the standardized abundance of 15 plasma metabolites in the MBS cohort (n = 213) showing the highest MACARRoN priority score for the presence of L. asaccharolyticus. b) MACARRoN priority scores for these metabolites. Samples are reported by coffee intake category. c) Mean scaled (z-score across metabolomes) relative abundances of the 25 metabolites in metabolomes that belong to one of the nine categories in the MLVS cohort. Enrichment of these metabolites is most prominent in L. asaccharolyticus and simultaneously linked to both higher coffee consumption and relative abundance (RA) of the species (Absent: RA < 0.01%; Low: 0.1% > RA ≥ 0.01%; High: RA > 0.1%). For the non coffee-associated SGBs, enrichment is seen to be linked only to higher coffee intake. d) Clustering dendrogram of the MACARRoN between metabolites correlations. e) Quinic acid structure and mass-to-charge ratio suggests that six unannotated metabolites prioritized by MACARRoN are derived by modification of quinic acid.
Extended Data Fig. 9
Extended Data Fig. 9. Metatranscriptomics of MLVS.
a) L. asaccharolyticus transcripts are detected in only twelve samples by metatranscriptomics. b) SGB-level profiling reveals that a large majority of samples contain L. asaccharolyticus (SGB15154) transcripts however transcript coverage is low. c) Species abundance and transcript detection are correlated where transcripts from higher abundance species are detected in a larger number of samples compared to transcripts from lower abundance species. The red dot indicates L. asaccharolyticus.

Similar articles

Cited by

References

    1. Liu, D. et al. Association of sugar-sweetened, artificially sweetened, and unsweetened coffee consumption with all-cause and cause-specific mortality: a large prospective cohort study. Ann. Intern. Med.175, 909–917 (2022). - PubMed
    1. O’Keefe, J. H. et al. Effects of habitual coffee consumption on cardiometabolic disease, cardiovascular health, and all-cause mortality. J. Am. Coll. Cardiol.62, 1043–1051 (2013). - PubMed
    1. Muley, A., Muley, P. & Shah, M. Coffee to reduce risk of type 2 diabetes?: a systematic review. Curr. Diabetes Rev.8, 162–168 (2012). - PubMed
    1. van Dam, R. M. & Hu, F. B. Coffee consumption and risk of type 2 diabetes: a systematic review. JAMA294, 97–104 (2005). - PubMed
    1. Barré, T. et al. Elevated coffee consumption is associated with a lower risk of elevated liver fibrosis biomarkers in patients treated for chronic hepatitis B (ANRS CO22 Hepather cohort). Clin. Nutr.41, 610–619 (2022). - PubMed

LinkOut - more resources