. 2024 Dec 11;52(22):e103.
doi: 10.1093/nar/gkae1052.

A deep mutational scanning platform to characterize the fitness landscape of anti-CRISPR proteins

Affiliations

A deep mutational scanning platform to characterize the fitness landscape of anti-CRISPR proteins

Tobias Stadelmann et al. Nucleic Acids Res. .

Abstract

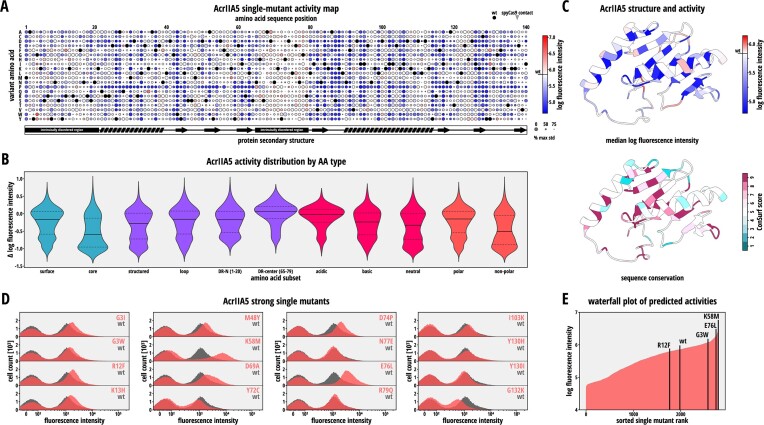
Deep mutational scanning is a powerful method for exploring the mutational fitness landscape of proteins. Its adaptation to anti-CRISPR proteins, which are natural CRISPR-Cas inhibitors and key players in the co-evolution of microbes and phages, facilitates their characterization and optimization. Here, we developed a robust anti-CRISPR deep mutational scanning pipeline in Escherichia coli that combines synthetic gene circuits based on CRISPR interference with flow cytometry coupled sequencing and mathematical modeling. Using this pipeline, we characterized comprehensive single point mutation libraries for AcrIIA4 and AcrIIA5, two potent inhibitors of CRISPR-Cas9. The resulting mutational fitness landscapes revealed considerable mutational tolerance for both Acrs, suggesting an intrinsic redundancy with respect to Cas9 inhibitory features, and - for AcrIIA5 - indicated mutations that boost Cas9 inhibition. Subsequent in vitro characterization suggested that the observed differences in inhibitory potency between mutant inhibitors were mostly due to changes in binding affinity rather than protein expression levels. Finally, to demonstrate that our pipeline can inform Acrs-based genome editing applications, we employed a selected subset of mutant inhibitors to increase CRISPR-Cas9 target specificity by modulating Cas9 activity. Taken together, our work establishes deep mutational scanning as a powerful method for anti-CRISPR protein characterization and optimization.


Figures

Graphical Abstract
Graphical Abstract
Figure 1.
Figure 1.
Implementation of a DMS pipeline for anti-CRISPR proteins. General setup of the DMS workflow comprising (A) a CRISPRi-based selection circuit in E. coli that generates a fluorescent output indicative of Acr activity, (B) a Flow-seq pipeline consisting of enrichment of Acr mutants with distinct activity by FACS, (C) followed by NGS, and a data analysis pipeline to predict inhibition potencies for each Acr mutant.
Figure 2.
Figure 2.
Validation of the bacterial CRISPRi gene circuit. E. coli carrying plasmids expressing an RFP reporter, dSpyCas9 and an RFP gene-targeting sgRNA were transformed with (A) a control vector containing no Acr, (B) with a vector expressing wild-type AcrIIA4 or AcrIIA5 or (C) with the AcrIIA4 and AcrIIA5 mutant libraries covering all possible single point mutations, followed flow cytometry analysis. Top: Schematics of the expected CRISPRi circuit behavior. Bottom: Histograms showing the RFP fluorescence distribution in the cell population. wt, wild-type.
Figure 3.
Figure 3.
Library sorting and library coverage analysis by NGS. (A,D) Four fractions corresponding to the indicated bins were selected for AcrIIA4 (A) and AcrIIA5 (D) libraries. 1 000 000 cells per fraction were sorted. (B, E) For each sorted fraction from the AcrIIA4 (B) and AcrII5 (E) libraries, cultures were re-grown and -induced overnight individually, followed by flow cytometry analysis. (C, F) Library coverage for each single mutant in the AcrIIA4 (C) and AcrIIA5 (F) libraries. Logarithmic total read counts across all fractions and replicates are shown for each single mutant.
Figure 4.
Figure 4.
Single Acr mutant cross-validation and activity prediction. (A, D) Cross-validation of NGS data. 16 AcrIIA4 (A) and AcrIIA5 (D) mutants were cloned individually and their inhibition potency was assessed using the CRISPRi circuit and flow cytometry as readout. Mutants showing different levels of Cas9 inhibition strengths according to the NGS data were selected for the cross-validation. (B, E) Leave-one-out cross-validation error for predicting Acr mutant activities from NGS read distribution across the four FACS-sorted fractions for the 16 AcrIIA4 (B) and AcrIIA5 (E) mutants. (C, F) Exemplary NGS read distribution for AcrIIA4 (C) and AcrIIA5 (F) mutants across sorted fractions versus corresponding fluorescence histograms from individual flow cytometry measurements.
Figure 5.
Figure 5.
The AcrIIA4 mutational fitness landscape reveals high mutational tolerance. (A) AcrIIA4 mutational fitness landscape. Circle color indicates the inhibitory potency of the indicated mutant. Circle size corresponds to the percentage of the maximum standard deviation of the activities determined for each AcrIIA4 mutant in the dataset. Larger circles correspond to smaller standard deviations and therefore more precise values. Black circles correspond to the wild-type residue. Gray triangles and gray regions in the secondary structure cartoon below the heat map indicate residues that directly interact with Cas9. (B) Violin plots showing the distribution of the predicted log mean fluorescence values for the indicated residue subgroups in AcrIIA4. (C) Mean log intensity for each residue (right) and the sequence conservation (left) plotted on the crystal structure of AcrIIA4 in complex with Cas9 (PDB 5VW1). (D) Waterfall plot of predicted mutant activities, i.e. mean log fluorescence intensity. Several individually tested Acr mutants and the wild-type (wt) Acr are indicated.
Figure 6.
Figure 6.
AcrIIA5 DMS reveals highly active mutants. (A) AcrIIA5 mutational fitness landscape. Circle size corresponds to the percentage of the maximum standard deviation of the activities determined for each AcrIIA5 mutant in the dataset. Larger circles correspond to smaller standard deviations and therefore more precise values. Black circles correspond to the wild-type residue. (B) Violin plots showing the distribution of the predicted log mean fluorescence values for the indicated residue subgroups and IDRs of AcrIIA5 single mutants. (C) Mean log intensity for each residue (top) and the sequence conservation (bottom) plotted on the NMR structure of AcrIIA5 (PDB 6LKF). (D) Histograms showing flow cytometry validation of several potent AcrIIA5 mutants (mutations are indicated) and their comparison to wild-type AcrIIA5. (E) Waterfall plot of predicted mutant activities, i.e. mean log fluorescence intensity. Several individually tested AcrIIA5 mutants and the wild-type (wt) AcrIIA5 are indicated.
Figure 7.
Figure 7.
In vitro affinity measurements and human cell application of AcrIIA4 mutants derived from DMS. (A) Scatter plot of predicted log mean fluorescence values in Figure 5A and corresponding Cas9 binding affinities as measured by BLI. (B) Cross-validation of inhibition potency for individual AcrIIA4 mutants in mammalian cells. HEK293T cells were co-transfected with constructs expressing (i) Renilla and firefly luciferase as well as a sgRNA targeting the firefly reporter gene, (ii) SpyCas9 and (iii) the indicated AcrIIA4 variant, followed by luciferase assay. The Cas9:Acr vector mass ratios used for transfection are indicated. Bars represent means, error bars the standard deviation and dots individual data points from n = 3 independent experiments. P: positive control, i.e. reporter with sgRNA. N: negative control, i.e. reporter with sgRNA + Cas9 (C) Scatter plot of predicted log mean fluorescence values in Figure 5A and corresponding luciferase activities in B (for the Acr:Cas9 ratio of 3:1). (D) Fusing Cas9 to mutant AcrIIA4 variants improves genome editing specificity. Cells were co-transfected with plasmids encoding Cas-Acr variants based on the indicated AcrIIA4 mutant (or wild-type AcrIIA4 as control) and an sgRNA targeting the AAVS1 (left) or HEK (right) locus. Following incubation for 72 hours, indel frequencies at the target and respective, prominent off-target sites were assessed using TIDE sequencing analysis. Bars represent means, error bars the standard deviation and dots individual data points from n = 3 independent experiments. (A–D) wt, wild-type AcrIIA4.

References

    1. Fowler D.M., Fields S.. Deep mutational scanning: a new style of protein science. Nat. Methods. 2014; 11:801–807. - PMC - PubMed
    1. Livesey B.J., Marsh J.A.. Using deep mutational scanning to benchmark variant effect predictors and identify disease mutations. Mol. Syst. Biol. 2020; 16:e9380. - PMC - PubMed
    1. Ogden P.J., Kelsic E.D., Sinai S., Church G.M.. Comprehensive AAV capsid fitness landscape reveals a viral gene and enables machine-guided design. Science. 2019; 366:1139–1143. - PMC - PubMed
    1. Spencer J.M., Zhang X.. Deep mutational scanning of S. pyogenes Cas9 reveals important functional domains. Sci. Rep. 2017; 7:16836. - PMC - PubMed
    1. Shams A., Higgins S.A., Fellmann C., Laughlin T.G., Oakes B.L., Lew R., Kim S., Lukarska M., Arnold M., Staahl B.T.et al. .. Comprehensive deletion landscape of CRISPR-Cas9 identifies minimal RNA-guided DNA-binding modules. Nat. Commun. 2021; 12:5664. - PMC - PubMed

MeSH terms

Substances

LinkOut - more resources